저작자표시-비영리-변경금지 2.0 대한민국 이용자는 아래의 조건을 따르는 경우에 한하여 자유롭게
l 이 저작물을 복제, 배포, 전송, 전시, 공연 및 방송할 수 있습니다. 다음과 같은 조건을 따라야 합니다:
l 귀하는, 이 저작물의 재이용이나 배포의 경우, 이 저작물에 적용된 이용허락조건 을 명확하게 나타내어야 합니다.
l 저작권자로부터 별도의 허가를 받으면 이러한 조건들은 적용되지 않습니다.
저작권법에 따른 이용자의 권리는 위의 내용에 의하여 영향을 받지 않습니다. 이것은 이용허락규약(Legal Code)을 이해하기 쉽게 요약한 것입니다.
Disclaimer
저작자표시. 귀하는 원저작자를 표시하여야 합니다.
비영리. 귀하는 이 저작물을 영리 목적으로 이용할 수 없습니다.
변경금지. 귀하는 이 저작물을 개작, 변형 또는 가공할 수 없습니다.
이학석사 학위논문
급성 골수성 백혈병에서
BCL2 패밀리 발현 Signature 및 Venetoclax 반응성 예측
BCL2 Family Expression Signature and Prediction of Venetoclax Response
in Acute Myeloid Leukemia
2021 년 2 월
서울대학교 대학원
의과대학 협동과정 종양생물학 전공
이 찬 섭
1. Abstract
BCL2 Family Expression Signature and Prediction of Venetoclax
Response
in Acute Myeloid Leukemia
Chansub Lee Major in Cancer Biology Interdisciplinary Graduate Program The Graduate School Seoul National University Introduction
Venetoclax is a B-cell lymphoma-2 (BCL2)-selective inhibitor for the treating of acute myeloid leukemia (AML). However, alternative anti-apoptotic BCL2 family proteins can take on the role of BCL2, resulting in resistance to venetoclax. The protein-protein interaction networks in the apoptosis pathway in the BCL2 family proteins indicate that the dynamics of expression of apoptosis genes may determine sensitivity to venetoclax.
Method
We utilized three patient-based AML RNA-seq datasets (BeatAML, LeuceGene, and TCGA), and a large-scale cell-line dataset (CCLE).
We developed an algorithm that finds optimal genes capturing BCL2 family expression patterns utilizing non-negative matrix factorization (NMF).
Briefly, we first collected genes regulationally- or functionally-related with BCL2 family from curated gene set databases. Then, to select
an optimal gene set which represents expression signatures of BCL2 family, a backward selection was performed with the pre-collected genes. In this procedure, we assumed better signatures show better performance of recovering BCL2 family profiles. In this respect, we sought “optimized genes” to the minimize recovery error of BCL2 family genes, which were processed to BCL2 family signatures.
To identify AML subtypes based on the BCL2 family, hierarchical clustering was conducted using the signatures. For characterizing of subtype-wise pathway enrichments, we performed Gene Set Enrichment Analysis (GSEA).
We developed a classifier predicting response to venetoclax using BeatAML. The classifier was compared with other variables and other machine learning methods. We then conducted external validation using LeuceGene. Additionally, we measured prediction performance for the response to MCL1-selective inhibitors using CCLE and GDSE2 (Genomics of Drug Sensitivity in Cancer2).
Results
From three AML RNA-seq datasets, we consistently identified three novel expression signatures reflecting the regulation network of the BCL2 family, which were named BCL2, MCL1/BCL2, and BFL1/MCL1 signatures. The signatures had determinants not only of BCL2 family members but also of their known regulation factors, which indicated that the signatures reflected the complicated regulation factors of the BCL2 family. As expected, the venetoclax resistant group had significantly high BFL1/MCL1 signature and low BCL2 signature.
Based on the signatures, obvious AML subtypes were identified, which were named BCL2 signature-enriched, MCL1/BCL2 signature-enriched, and BFL1/MCL1 signature-enriched subtypes.
Well-known cancer pathways known to control the BCL2 family were enriched in only some subtypes. Additionally, the mitogen-activated protein kinase (MAPK) pathway, JAK/STAT pathway, and hypoxia genes were upregulated in BFL1/MCL1 signature-enriched subtypes.
Our signature-based classifier that predicts response to venetoclax showed an area under the curve (AUC) of 0.874, outperforming other predictive models. Additionally, we confirmed the applicability of our approach to predict response to MCL1-selective inhibitors.
Conclusion
Our gene optimization algorithm can successfully extract BCL2 family signatures in AML. AML samples are clearly divided into three subtypes based on the signatures, which have distinct biologic characteristics. The signatures can be used to predict response to venetoclax and MCL1 inhibitors, and this can select out the patients who may benefit from anti-BCL2 family treatment. The signatures can also guide candidate pathways for drug combination strategies, such as MAPK, JAK/STAT, and hypoxia.
keywords: BCL2 family, expression signature, Venetoclax, response prediction, acute myeloid leukemia
Student Number: 2019-29433
2. Contents
1. Abstract ··· 1
2. Contents ··· 4
3. List of Figures and Tables ··· 5
4. Introduction ··· 6
5. Results ··· 9
6. Discussion ··· 16
7. Materials and Methods ··· 20
8. Figures and Tables ··· 29
9. Reference ··· 51
10. Abstract in Korean ··· 57
3. List of Figures and Tables
Fig. 1. Work Flow ··· 29
Fig. 2. Association of Venetoclax Response ··· 30
Fig. 3. Identification of BCL2 Family-Related AML Subtypes ··· 31
Fig. 4. Contribution of Optimized Genes to Signatures ··· 32
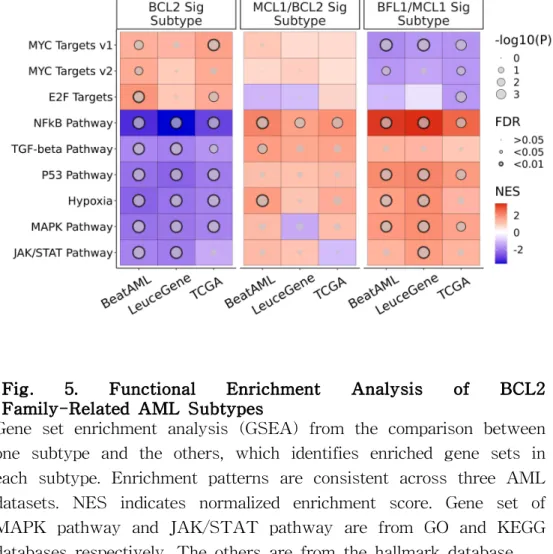
Fig. 5. Functional Enrichment Analysis of BCL2 Family-Related AML Subtypes ··· 34
Fig. 6. Prediction Performance of Signatures ··· 34
Fig. S1. Histogram of IC50 values from BeatAML dataset ··· 35
Fig. S2. Gene Optimization ··· 36
Fig. S3. Optimal Rank Selection for NMF ··· 37
Fig. S4. Weight of BCL2 Family in Signatures ··· 38
Fig. S5. Original Gene Expression Profile of Optimized Genes ·· 39
Fig S6. Identification of BCL2 Family-Related Subtypes in Other Hematologic Malignancies ··· 40
Fig. S7. Batch Effect Correction ··· 41
Fig. S8. External Validation of the Venetoclax Response Classifier ··· 42
Fig. S9. Prediction Performance of Signatures between Before and After Gene Optimization ··· 43
Fig. S10. Profile of Signatures in CCLE AML ··· 44
Fig. S11. Correlation between signatures and drug response in CCLE AML ··· 45
Fig. S12. Prediction Performance in Cell Line ··· 46
Fig. S13. Scheme of Gene Optimization Algorithm ··· 47
Table S1. Optimized BCL2-Related Genes ···48
4. Introduction
Acute myeloid leukemia (AML) is an aggressive hematologic cancer of myeloid cell lineage characterized by the interruption of myeloid precursor cells’ differentiation and clonal proliferation, resulting in the accumulation of abnormal hematopoietic cells (1). AML is the most common acute leukemia in adults and a 5-year relative survival rate of 67% (2, 3). Despite the improvement of sequencing technology assisting in understanding the biology of AML and providing potential targeted agents for the advance of the clinical therapy of AML (4), the overall prognosis for AML remains poor (1, 5).
Evasion of apoptosis is a hallmark of cancer (6), and the B-cell lymphoma-2 (BCL2) protein family plays an important role in survival by regulating intrinsic apoptosis. Depending on functions, they are divided into anti-apoptotic proteins (BCL2, MCL1, BFL1, BCLXL, and BCLW), and pro-apoptotic proteins (BAX, BAK, BOK, BID, BIM, BAD, BIK, NOXA, HRK, PUMA, and BMF) (7).
Pro-apoptotic proteins activate mitochondrial outer membrane permeabilization (MOMP), whereas anti-apoptotic proteins counteract them and consequently inhibit apoptosis (7, 8). Expansion of abnormal cells is often due to the imbalance of these anti- and pro-apoptotic BCL2 family proteins and often depends on specific anti-apoptotic proteins (9, 10). Therefore, targeting the cancer apoptosis pathway with drugs that can manipulate these proteins has been rigorously explored in cancer.
Recently, BCL2-selective inhibitor venetoclax has been approved in combination with standard AML agents (azacitidine, decitabine, or
low-dose cytarabine) by the United States Food and Drug Administration (FDA) for the treatment of newly diagnosed patients with AML who are aged 75 years or older or who have comorbidities that preclude the use of intensive induction chemotherapy (8, 11).
Despite the successful outcome of venetoclax, resistance mediated by MCL1, an alternative anti-apoptotic protein, has been discovered.
Accordingly, MCL1-selective inhibitors, such as S64315, AZD5991, and AMG176, have entered clinical trials (ClinicalTrials.gov identifier:
NCT02979366, NCT03218683, and NCT02675452). BFL1, which is another alternative anti-apoptotic protein, has also been highlighted as a potential biomarker of venetoclax resistance in AML (12, 13), but a BFL1-selective inhibitor has not been developed yet.
Due to the distinct two-part roles of proteins in intrinsic apoptosis, protein-protein interaction (PPI) knowledge has been accumulated. In fact, PPI networks of intrinsic apoptosis have been well researched and organized (14); specific interactions between pro-apoptotic proteins and anti-apoptotic proteins have been discovered (8). Based on these PPIs in cancer apoptosis, mitochondrial BH3 profiling has been suggested as a predictive biomarker of response to venetoclax in AML (15). More importantly, well-known biological pathways in cancer, such as TP53, NF-κB, and TGF-β pathway, are closely linked to BCL2 family genes (16-24). Considering BCL2 family PPIs and their link to cancer pathways, we speculated that the expression signature reflecting the complicated regulation network of the BCL2 family should exist. We hypothesized that signatures may help predict the response to anti-BCL2 family drugs more accurately.
To find the signatures, we decided to utilize Non-negative Matrix Factorization (NMF), an unsupervised approach that has previously been used to extract biologically hidden meaningful signatures in the gene expression matrix (25-27). We speculated that the appropriate selection of BCL2 family-related genes would enable us to identity BCL2 family signatures.
Hence, in this study, we mainly aim to select optimal genes that represent a complicated regulation network of the BCL2 family using large AML cohort RNA-seq data (BeatAML, LeuceGene, and TCGA-LAML). First, we selected genes based on well-established domain knowledge. Second, to optimize the above genes, we developed a novel approach in which genes not related to BCL2 family expression were filtered out sequentially. While the proportion of commonly identified genes is used for evaluating the performance of gene selection, differentially expressed genes (DEGs)-based gene selection is untenable in those datasets since only a small fraction of the outcome was available. Therefore, we introduced a novel gene selection approach using NMF that does not require the phenotype information.
5. Results
Outline of Study
An overall workflow of the study is described in Fig. 1. In summary, we first collected a set of genes related to the BCL2 family from domain knowledge. Using the three large-scale public AML RNA-seq datasets (BeatAML (n = 451), LeuceGene (n = 437), and TCGA (n = 179)), we optimized the genes to filter noise genes using our NMF-based approach for each dataset, to extract expression signatures which reflect expression patterns of BCL2 family. Using the signatures, we identified three AML subtypes and built a classifier to predict venetoclax response. We also suggested an application to guide a combination treatment strategy targeting the BCL2 family.
Association of BCL2, MCL1, and BF L1 with Venetoclax Response
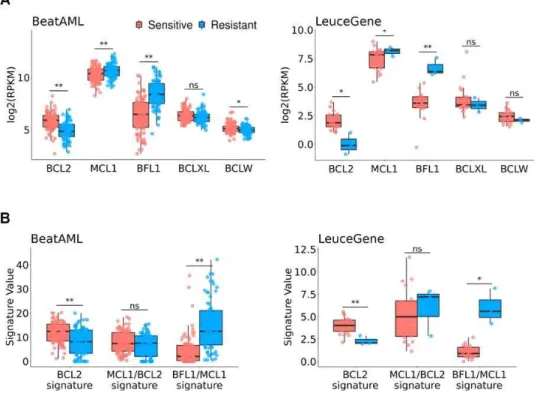
All the datasets used in the analyses were normalized in advance, as described in the Materials and Methods section. Before the signature extraction, we selected the anti-apoptotic genes whose expression is significantly different by venetoclax responses. We compared anti-apoptotic BCL2 family expressions between venetoclax-sensitive and -resistant samples of BeatAML dataset (n = 153 out of 451) and LeuceGene (n = 23 out of 437). Response groups were appointed by binarizing IC50 values to sensitive if IC50 ≤ 1µm and resistant if
IC50 ≥ 10µm (Fig. S1), respectively. As our expectation, both datasets showed statistically significant lower BCL2 expression and higher MCL1 and BFL1 expression in the resistant group than in the sensitive group, as shown in Fig. 2A (Welch’s t-test p < 0.05) (12).
Accordingly, we considered those genes as the main resistant factors for venetoclax response in further analysis.
Selection of Genes Representing Expression P atterns of BCL2 F amily
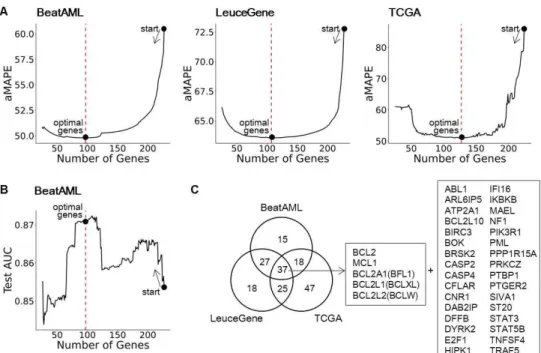
We collected 236 genes related to BCL2 family regulation from several curated gene-set databases and an extensive literature search, as described in the Materials and Methods section. Next, we optimized the pre-collected genes to rule out the genes that do not contribute to the recovery of BCL2 family in AML datasets. Here, a modified backward selection was conducted, which removes a gene yielding the smallest an average of mean absolute percentage errors (aMAPE) in removal at each step, and repeats this step until the number of genes reaches 20. The optimal genes were chosen among all the conducted steps by smallest aMAPE (Fig. S2A; details in Materials and Methods). As a result, 97, 107, and 127 genes were chosen for BeatAML, LeuceGene, and TCGA, respectively (Fig. S2B).
Interestingly, up to 84.5% of genes were commonly identified at least two datasets (84.5%, 83.2%, and 63.0% for BeatAML, LeuceGene, and TCGA, respectively), which reflects high concordance of the proposed approach (Fig. S3, Table S1).
I nvestigation of BCL2 F amily Signatures
To extract expression signatures, we decomposed the expression of the optimized genes for each dataset into two matrices that represent summarized patterns of genes (W) and samples (H), respectively (see details on Materials and Methods). We decided the number of signatures as three and confirmed that the number is optimal and identical across all the datasets we used, from our simulation for choosing the optimal number of signatures based on the cophenetic correlation coefficient from 50 repeatedly calculated H matrices (Fig.
S3).
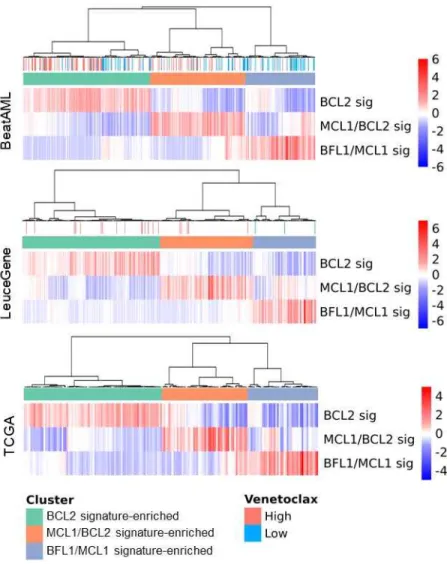
Interestingly, all of the AML datasets showed consistent patterns of the signatures (i.e., H matrix), as shown in Fig. 3. Moreover, our identified signatures showed that the optimal genes consistently contributed to each signature across three datasets (Fig. 4).
Especially, main venetoclax resistance factors (BCL2, MCL1, and BFL1; Fig. 2A) dominated the signatures consistently (Fig. S4).
Based on these results, we interpreted signatures using the three genes, and based on their contribution, we finally assigned each signature as BCL2, MCL1/BCL2, and BFL1/MCL1 signature (Fig. 3, Fig. 4). As shown in the inconsistencies of signature contribution to other hematologic malignancies (Fig. S4), the results suggest that the extracted BCL2 family signatures are specific to AML and heterogeneous across hematologic malignancies.
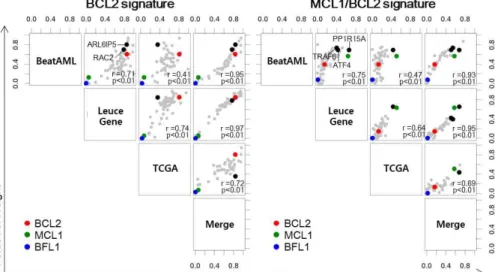
In addition, we identified not only BCL2 family genes but also other optimized genes that are closely related to the main signature genes with a comparable contribution, such as ARL6IP5 and RAC2 in the
BCL2 signature, TRAF6, ATF4, and PP1R15A in the MCL1/BCL2 signature, and HIF1A and BIRC3 in the BFL1/MCL1 signature (Fig.
4). It was inferred that the signatures were also determined by the various regulation factors of the BCL2 family.
Signature-based AML Subtyping
Our signature analysis of the three AML datasets revealed that the AML samples can be categorized into three molecular subtypes (Fig.
3, Fig. S7). We annotated those subtypes as BCL2 signature, MCL1/BCL2 signature, and BFL1/MCL1 signature subtypes. The sample proportion of subtypes is consistent across datasets (Fig. 3), meaning these subtypes would be prevalent in AML. As our expectation, the venetoclax-resistant group showed significantly higher BFL1/MCL1 signature (Welch’s t-test p < 0.01 in both BeatAML and LeuceGene) and lower BCL2 signature (p < 0.01 in BeatAML, and p < 0.05 in LeuceGene) than the venetoclax-sensitive group (Fig. 2B).
Subtype-Specific P athway Enrichment Analysis
To identify which pathways are enriched for each signature-based subtype, gene set enrichment analysis (GSEA) was conducted between the subtypes (Fig. 5). Through the analysis, we discovered that the signature-based subtypes manifest distinct enrichment patterns, and those patterns might be helpful to explain their biological characteristics. In detail, BFL1/MCL1 signature subtype
showed enrichment of NF-kB pathway, mitogen-activated protein kinase (MAPK) pathway, and JAK/STAT pathway significantly (FDR
< 0.05), and MCL1/BCL2 signature subtype presented significant enrichment of the TGF-β signal (FDR < 0.05). Similarly, the BCL2 signature subtype was linked to downregulation of the p53 pathway and upregulation of Myc and E2F hallmark target genes (FDR <
0.05). Similar to the heterogeneous composition of the signatures across other hematologic malignancies, their results of GSEA analysis showed distinct patterns (Fig. S6).
P rediction of Venetoclax Response
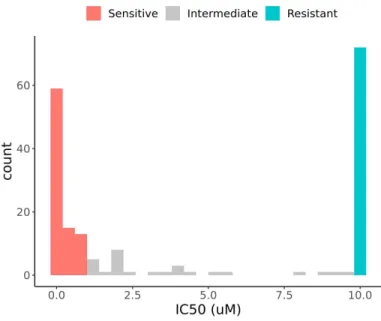
Using our signatures, we built a classifier for predicting venetoclax response that was trained by BeatAML dataset. Among the 186 samples with IC50-based venetoclax response, 87, 72, and 27 samples were assigned to sensitive, resistant, and intermediate groups, respectively (details in Materials and Methods) (Fig. S1). After excluding the samples with repeated observation, 153 samples (81 sensitive and 72 resistant) were used in the final analysis.
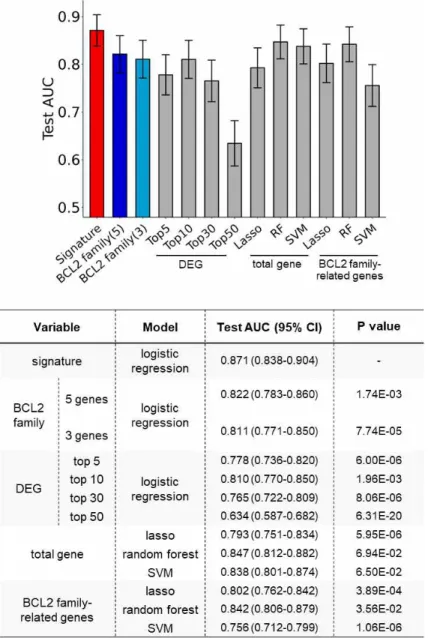
From internal validation using our 10-times repeated training-testing approach (see Materials and Methods), our signature-based classifier outperformed other classifiers with original expression- or machine learning-based approaches. First, a logistic regression classifier with the signatures from the training dataset showed an area under the curve (AUC) of 0.871 in the testing dataset (95% CI; 0.838–0.904) (Fig. 6) that was substantially superior to the classifiers using an original expression of anti-apoptotic BCL2 family or differentially
expressed genes (DEGs) (Fig. 6, AUC 0.634–0.822, DeLong’s test p
< 0.002). Further, in comparison with other machine learning methods (lasso, random forest, and support vector machine; AUC 0.756–0.847), our signature-based classifier showed better performance (Fig. 6, DeLong’s test p < 0.05 except two models with p < 0.07).
To perform external validation using LeuceGene, we optimized genes and calculated the signatures after combining and batch-correcting BeatAML and LeuceGene (n = 451+437) (Fig. S7A). Note that these steps are separated from the prediction step, since the optimization process does not require the phenotype information. The re-trained classifier with BeatAML (n = 153 out of 451) perfectly predicted the responses of the LeuceGene (n = 23 out of 437) test set with pronounced margin, outperforming other approaches (Fig. S8).
Despite the gene optimization process is completely independent from the prediction, the signatures using the optimized genes yielded higher performance than those from non-optimized genes (whole genes or domain knowledge-based collected genes), although these results were not insufficient to achieve statistical significace. The number of our signatures (rank=3) based on the stability of clustering also excelled (Fig. S9). During the optimization, performance tended to increase closer to optimized genes (Fig. S2C). These results indicated that our gene selection algorithm produced a parsimonious summary of the entire dataset, in addition to the better prediction performance.
Application of signatures to other inhibitors
To extend the proposed approach to other inhibitors, we analyzed cell line dataset. From the batch corrected merged data (BeatAML and CCLE; n = 451+34) (Fig. S7B), we re-optimized genes and re-calculated signatures (Fig. S10).
We found multiple examples exhibit the possibility of BCL2 family signatures can be applied in predicting drug response to not only BCL2 inhibitor but also MCL1 inhibitors (UMI-77, MIM1, and AZD5991). Inhibitory responses of venetoclax and UMI-77 were mainly correlated with the BCL2 and MCL1/BCL2 signatures (R2 = 0.29 and 0.53), respectively (Fig. S11). In addition, the sensitivity of MAPK inhibitors was correlated with MCL1-related signatures;
MCL1/BCL2 and BFL1/MCL1 signatures (R2 up to 0.23) (explained in Discussion) (Fig. S11). From the linear regression model for predicting ln(IC50), MIM1 and UMI-77 were more predictable (Leave-One-Out Cross-Validation Normalized Root Mean Square Error (LOOCV RMSE) = 0.41 and 0.34 respectively) when using the signatures than using an original expression, and AZD5991 and venetoclax showed similar performance (Fig. S12).
6. Discussion
In this study, we developed the novel gene selection process consist of domain knowledge-based and NMF-based approaches, considering to cover enough BCL2 family pathway and to filter out noise genes.
As a result, we revealed three expression signatures (BCL2, MCL1/BCL1, and BFL1/MCL1 signature) representing molecular patterns of BCL2 family. We found multiple previous reports that explain the relationship between main determinants in each signature, which presumably suggests reflection of regulation factors of BCL2 family. Among the main determinants of BCL signature, RAC2 and ARL6IP5 have been reported to regulate BCL2 (29-31). Similarly, among MCL1/BCL2 signature’s determinants, PPP1R15A, and TRAF6 have been reported to link to MCL1 stabilization (32). Moreover, ATF4 which is another determinant transcriptionally regulate NOXA that is a strong selective antagonizer of MCL1 (33).
Our signatures accurately predict response to venetoclax and MCL1 inhibitors. Our signature-based approach enables us to outperform original expression-based and machine learning-based predictive models. Based on these, we suggested that our BCL2 family signature profiling could be used as biomarkers for anti-BCL2 family treatment.
Based on the signatures, we identified three BCL2 family-based AML subtypes named BCL2 signature, MCL1/BCL2 signature, and BFL1/MCL1 signature subtypes consistently in three datasets, indicating our approach successfully reflect molecular biology of AML . These subtyping presumably could guide proteins to target among 3
anti-apoptotic BCL2 family proteins (BCL2, MCL1, and BFL1). BCL2 signature subtype would be sensitive to venetoclax. Moreover, MCL1/BCL2 signature subtype would be effective in the combination of MCL1 inhibitor and venetoclax, which is supported by a recent study with the combination treatment (34). Similarly, we suggest BFL1/MCL1 signature subtype would be effective in dual inhibition of BFL1 and MCL1. It is supported by a recent study with BFL1 and MCL1 dual inhibitor (35). Our signature profiling approach could overcome an unclarity about how to determine which anti-apoptotic protein to inhibit.
Pathway-level characterization of each subtype and cell line analysis gave various ideas about treatment strategies. Especially, we suggest the treatment strategies for BFL1/MCL1 signature subtype based on the enrichment results about MAPK pathway, JAK/STAT pathway, and hypoxia genes, and these suggestions are supported by the following previous literature.
First, the BFL1/MCL1 signature subtype could be effective in combining venetoclax with MAPK pathway or JAK/STAT pathway inhibitors. Active MAPK pathway up-regulates MCL1 and increases venetoclax resistance, which can be blocked through a MAPK pathway inhibitor (36-38). Correlation between various MAPK inhibitors response and BFL1/MCL1 signature in cell line analysis supports this suggestion. Similarly, JAK/STAT signalling is reported to control BFL1 and contribute to venetoclax response (39, 40).
Second, we suggest that the hypoxia-induced drug resistance would be mainly linked to BFL1/MCL1 signature subtype. In gene-wise pattern results, hypoxia genes HIF1A and BRIC3 intensively
contributed to BFL1/MCL1 signature (41). Hypoxia generally interrupted the drug-induced apoptosis. However, hypoxia-induced modulation was heterogeneous across BCL2 family proteins (42).
We additionally leave various candidate pathways for the drug combination strategy of targeting the BCL2 family. The cancer pathways including P53, NF-kB, TGF-β, MYC, and E2F are well-known controlling factors of BCL2 family, but little is known about the exact mechanisms controlling BCL2 family proteins (16-24, 43-48). However, our results showed subtype-specific enrichment in these pathways that could be explained by the fact that each BCL2 family protein has specific regulation mechanisms. These subtype-specific pathways suggest subtype-specific strategies for combination treatment with anti-BCL2 family drugs. Moreover, these enrichment patterns were distinct from other hematologic malignancies, which our discovery is a specific characteristic for AML.
This study has limitations. First, it is necessary to additionally study about predicting response to MCL1 or BFL1 inhibition. We only identified MCL1 or BFL1-related signatures and discovered some patients mainly have these signatures. It is uncertain if using the signatures ultimately helps predict response to not only BCL2 but also MCL1 or BFL1. Our analysis of response to MCL1 inhibitors was limited to the small number of cell lines of the patient tumor.
Second, our results were limited to AML. CLL and DLBCL were also analyzed, but they need to be validated in independent dataset.
Therefore, in other cancers, the optimization algorithm should be individually conducted again.
In summary, the gene optimization algorithm can extract the three BCL2 family signatures in AML. The signatures can be used to remarkably predict venetoclax and MCL1-selective inhibitor responses.
AML samples are clearly divided into three subtypes based on the signatures that have different enriched pathways from each other, which could guide subtype-specific treatment strategy targeting the BCL2 family.
7. Materials and Methods
Study Design
The overall study was designed to profile BCL2 family expression signatures, which were suggested as clinically applicable biomarkers for anti-cancer treatment targeting BCL2 family proteins. We used public RNA sequencing data of patients with blood cancers and tumor cell lines with no exclusion samples as outlined below paragraph.
Datasets for model development and validation
In this study, we utilized three patient-based AML RNA-seq datasets (BeatAML, LeuceGene, TCGA), in addition to a large-scale cell-line dataset (CCLE) (12, 51-53). Especially, BeatAML and CCLE were chosen from their partial availability of drug response data, which was essential to demonstrate the utility of the proposed method.
For BeatAML dataset, the Reads Per Kilobase of transcript per Million mapped reads (RPKM) values of RNA-seq of 451 samples and partially available venetoclax response of 186 samples were acquired from the supplementary data of the original study (51). For the LeuceGene dataset, accession numbers GSE49642, GSE52656, GSE62190, GSE66917, and GSE67039, which are listed in https://leucegene.ca/research-development/ were accessed from Gene Expression Omnibus (GEO; https://www.ncbi.nlm.nih.gov/geo/) for the RNA-seq dataset of 437 patients, in addition to partially available venetoclax response (n = 23) of patients from the original study (12).
For the TCGA dataset, TCGA-LAML 179 and TCGA-DLBC 48 raw data of RNA-seq were downloaded from GDC Legacy Archive (https://portal.gdc.cancer.gov/legacy-archive/), in addition to 111 RNA-seq data of CCLE-ES from ICGC data portal (https://dcc.icgc.org/). Cell line raw RNA-seq data of CCLE and drug IC50 information were obtained from Sequence Read Archive (SRA;
https://www.ncbi.nlm.nih.gov/sra) with accession number PRJNA523380 and GDSC2 (https://www.cancerrxgene.org/) respectively.
P re-processing of Sequencing Data
Since the BeatAML dataset is provided as RPKM values (51), we processed the other datasets as RPKM. Alignments were conducted using the Subread aligner (subjunc; ver. 1.5.0-p2) (54) on human GRCh37 build reference genome (human_g1k_v37.fasta) from the Genome Analysis Toolkit (GATK) resource bundle. Read counts were measured using featureCounts (ver. 1.5.0-p2) (55) with Ensembl release-75. For each dataset, all genes with mapped read count less than 10 across the same or more than 90% of samples were removed, as suggested in the processing of the BeatAML dataset (51). In case multiple ensembl genes are matched to one gene symbol, we first adopted the ensembl genes appear in BeatAML matrix, otherwise those with higher variance. The RPKM dataset was finalized after conditional quantile normalization (CQN) (56) that considers GC-content correction.
Expression Signatures of BCL2 family
In this study, we propose novel expression signatures representing the expression pattern of the BCL2 family. Our signatures were inspired from Non-negative Matrix Factorization (NMF), a dimension reduction technique that factorizes matrix by additive combinations of non-negative basis vectors. In brief, NMF factorizes expression matrix A (g × n) into two non-negative matrices W and H by the rank k, where g and n denote the number of genes and the number of samples, respectively. In this study, the k vectors of the W matrix summarize the gene-wise patterns, while those of H matrix summarize the sample-wise patterns. NMF was performed using NNLM (ver. 0.4.3) R package (57, 58) with loss function as mean Kullback-Leibler divergence (MKL), based on the optimality of the loss functions in count-based distributions (59). The signatures were calculated by two steps: gene collection and gene optimization using NMF.
Collection of BCL2 F amily-Related Genes
We collected genes transcriptionally-, regulationally- or functionally-related with the BCL2 family from a curated gene-set database, Molecular Signatures Database (MsigDB v6.2) (60) and GeneGo (https://portal.genego.com/). Additionally, BCL2 family regulation-related genes were also added to construct the initial candidate genes (denoted as pre-collected gene set) through an extensive literature curation, regardless of cell or tumor type. All sources of the pre-collected gene set were described in Table S1.
Optimization Genes Algorithm to Extract BCL2 family-Related Signatures
An overall scheme of our gene optimization is depicted in Fig. S13.
In order to select an optimal set of genes that represent expression signatures of BCL2 family genes, a backward selection was performed with the pre-collected gene set. In this procedure, we assumed better signatures show better performance of recovering anti-apoptotic BCL2 family profiles. In this respect, we sought to minimize the recovery error of anti-apoptotic BCL2 family genes by reconstructing their profiles using NMF with simulated missing datasets. In this study, the recovery error was defined as aMAPE (an average of mean absolute percentage errors) of each fold in 10-fold split samples. For MAPE, this error was calculated from comparing values of the original matrix and that of the imputed matrix. For each fold of the dataset, all expressions of the five anti-apoptotic BCL2 family genes were nullified to construct the simulated missing dataset. After applying NMF to the simulated dataset, their results were multiplied again to produce a “recovered matrix” whose missing values were imputed by NMF. Finally, the MAPE is calculated by comparing the recovered matrix to the original matrix.
Using aMAPE as a selection criterion, we performed a backward selection with the pre-collected genes, as follows. For each round, genes except for the five anti-apoptotic BCL2 family genes were individually eliminated to calculate aMAPE after removal of each gene, and then the gene with minimal aMAPE was removed. This process was repeated until the number of genes reaches a specific number, and we call the genes with minimal aMAPE as “optimal
genes” in this study. Eventually, we calculate H and W matrices from the expression matrix consisting of optimized genes.
Rank Selection in N MF
For optimal rank selection, we used a cophenetic correlation coefficient which reflects the stability of sample clustering for multiple ranks, using NMF (v0.21.0) R package (61). In detail, a consensus matrix was obtained from the connectivity matrices of the repeatedly calculated H matrix using the cophenetic correlation coefficient. Finally, we selected the rank in which the cophenetic correlation coefficient begins to fall.
Combining Multiple Datasets
Prior to combining datasets, we performed principal component analysis (PCA) of each dataset using log2-transformed RPKMs. In this study, we considered two merging scenarios which combine LeuceGene and BeatAML, and CCLE and BeatAML. The resultant datasets were generated by combining multiple datasets using removeBatchEffect function of limma R package (62). After merging LeuceGene and BeatAML using the merged dataset, the samples from LeuceGene was used as a test set about classifier which trained using those of BeatAML. The merged dataset of CCLE and BeatAML was used for extracting expression signatures to overcome the limitation of a small sample size of CCLE (n=34).
I dentification of AML Subtypes Based on the Signatures
To identify the subtype defined by anti-apoptotic BCL2 family expression signatures, we conduct hierarchical clustering with average linkage and Pearson correlation distance, using the signatures for AML datasets. Visualization of clustering and signature profile was conducted using pheatmap (v1.0.12) R package.
GSEA
For identifying subtype-wise pathway enrichments, GSEA was performed using fgsea (v1.10.1) (63) R package, as suggested in the maintainer’s manual. In this study, the following pathways of MsigDB (v7.0) (60) were considered: KEGG, GO, hallmark, BioCarta, Reactome, and PID. In this study, the result of GSEA was derived as the Normalized Enrichment Score (NES) and its p-value. In this step, we applied two types of NES calculation (one vs. others, one vs. one) using the subtypes from the above step.
Classifier for P redicting Venetoclax Response
To demonstrate the effect of the expression signatures, we developed a binary classifier using BeatAML which predicts response to venetoclax. The IC50 values were binarized by taking both extremes.
To avoid bias from the patients with multiple samples, only the sample with the latest time point was chosen when the samples had
the same response. Performance evaluation was repeated 10 times to avoid overfitting. For each run, 70% and 30% of the samples of the signature dataset were randomly assigned to train and test sets, and the training with logistic regression classifier and testing with the trained classifier was performed. We computed AUC by combining the predicted probabilities of all repeats, and its significance was tested using two-side DeLong’s test, using the pROC R package (v 1.16.2) .
The classifier was compared with other variables: original expression of 1) three anti-apoptotic proteins BCL2, MCL1, and BFL1, 2) former genes plus BCLXL, and BCLW, and 3) top5, 10, 30, and 50 differential expression genes (DEGs), which estimated based on log(FC) between the sensitive and resistance groups. Additionally, other machine learning methods were compared: 1) Lasso logistic regression, 2) random forest, and 3) support vector machine, which were trained using the sklearn (v0.20.4) package in python 3.4.9.
Afterward, we performed an external validation using LeuceGene. The signatures were re-extracted from the merged data (BeatAML and LeuceGene) after batch effect correction and gene optimization. Using the resampled BeatAML datasets from the classifier development step, the classifier was trained again, and the performance was tested using LeuceGene.
To demonstrate the effect of the gene optimization algorithm, we compared the classification performance of signatures across three types of source genes (the optimized genes, pre-collected genes, and total genes rank-wisely). Additionally, we evaluated the increasing performance for each gene set on optimizing during backward steps.
Classifier for P redicting MCL1-Selective I nhibitors Response
To extend the application of the signatures to other inhibitors, we used 34 AML cell line RNA-seq data from CCLE and matched drug response (IC50) of BCL2 family-related inhibitors and MAPK pathway inhibitors from GDSC2 (Genomics of Drug Sensitivity in Cancer2). Because only 34 AML cell lines were available, it would be too small to extract meaningful signatures. Accordingly, we extracted the signatures for cell lines from the merged data (BeatAML and CCLE). After correcting the batch effect between two cohorts and optimizing genes, we extracted the signature. Spearman’s correlation analysis was conducted between the signatures and the inhibitory response. We measured prediction performance for the inhibitory response. Due to a small number of samples, we did not separate test sets and instead used LOOCV (Leave-One-Out Cross-Validation). It was ambiguous to convert IC50 to discrete values, so we used linear regression for modelling predicting ln(IC50). NRMSE (Normalized Root Mean Square Error) was calculated to measure the performance.
Statistical Analysis
Statistical analyses were performed using R (v3.6.0), and the statistical significance was evaluated differently by the tests we used, with maximum of p < 0.05.. In comparing two groups using Welch’s two-sample t-test, for RPKM, log2 transformation was conducted to construct non-normal data as normal. In GSEA, the false discovery
rate (FDR) was used to account for multiple testing. To compare the prediction performance of the classifier, we used the two-side DeLong’s test.
8. Figures and Tables
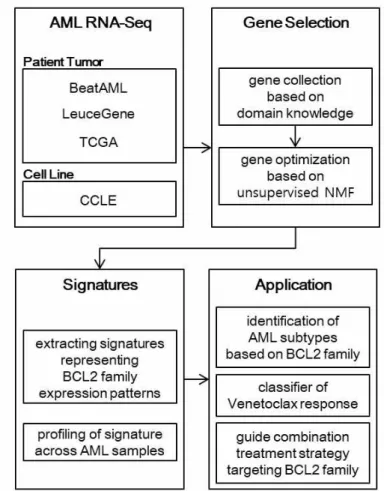
Fig. 1. Work Flow
From AML RNA-seq datasets, gene selection is conducted for capturing the expression pattern of the BCL2 family. First, the BCL2 family’s transcriptionally-, regulationally-, or functionally-related genes are collected using a gene set database and documentary survey. Second, backward selection is performed to find optimal genes based on the recovery of BCL2 family utilizing Non-Negative Matrix Factorization (NMF). Afterward, the “signatures”, consisting of the optimal genes, are calculated. These are used to identify subtypes of AML, to predict venetoclax response, and to guide treatment strategy targeting BCL2 family in individual samples.
Fig. 2. Association of Venetoclax Response
(A) Comparison of anti-apoptotic BCL2 family expression between vanetoclax sensitive and resistant group in BeatAML (81 sensitive and 72 resistant) and LeuceGene (20 sensitive and 3 resistant).
(B) Comparison of the signatures representing patterns of BCL2 family expression. Note that we only used a subset of LeuceGene in which response information is available publicly. Differently expressed BCL2 and BFL1 were already identified using whole LeuceGene in (12). p-values are calculated by t-test. *<0.05, **<0.01, ns>0.10
Fig. 3. Identification of BCL2 Family-Related AML Subtypes H matrix presenting BCL2 family expression signature profiles calculated using optimized genes. Four AML datasets show three distinct clusters. Rows were clustered using hierarchical clustering with average distance.
Fig. 4. Contribution of Optimized Genes to Signatures Weight of optimized gene in the W matrix. BCL2, MCL1, and BFL1 are marked in cyan, magenta, and yellow respectively. Some determinant components of the signatures are marked in black. Four AML datasets show concordance of the weight of optimized genes.
Each weight of genes is normalized to sum 1. Correlation coefficients were calculated using spearman’s rho.
Fig. 5. Functional Enrichment Analysis of BCL2 Family-Related AML Subtypes
Gene set enrichment analysis (GSEA) from the comparison between one subtype and the others, which identifies enriched gene sets in each subtype. Enrichment patterns are consistent across three AML datasets. NES indicates normalized enrichment score. Gene set of MAPK pathway and JAK/STAT pathway are from GO and KEGG databases respectively. The others are from the hallmark database.
Fig. 6. Prediction Performance of Signatures
Comparison of performance between classifiers. Used variables and models are described in the right table. BCL2 family(5) and BCL2 family(3) indicate (BCL2+MCL1+BFL1+BCLXL+BCLW) and (BCL2+MCL1+BFL1) respectively. Error bar indicates 95% confidence interval (CI). p values are calculated comparing with the signature model using the DeLong test.
Fig. S1. Histogram of IC50 values from BeatAML dataset
IC50 values were binarized to sensitive if IC50<=1 µm and resistant if IC50>=10 um. The 87, 72, and 27 samples were allocated to the sensitive, resistant, and intermediate groups, respectively.
Fig. S2. Gene Optimization
(A) Decrease of aMAPE (an average of mean absolute percentage errors) of anti-apoptotic BCL2 family genes during gene optimization.
Genes with minimal aMAPE were selected as optimized genes.
(B) Test AUC of classifier when using given genes during the optimization process.
(C) A Venn diagram illustrating the optimized genes of three AML datasets with rank3. 37 intersect genes are listed in the right of the figure.
Fig. S3. Optimal Rank Selection for NMF
Cophenetic correlation coefficients of at given optimized genes and rank. Rank3 is the first rank in which the cophenetic correlation coefficient begins to fall in the three AML cohorts.
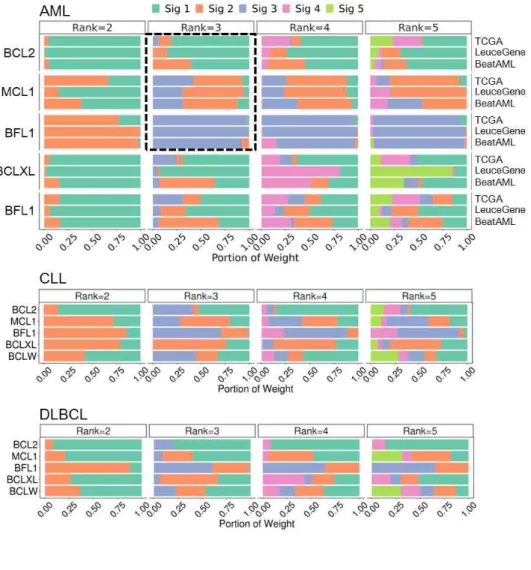
Fig. S4. Weight of BCL2 Family in Signatures
Correlation between signatures and inhibitor responses (ln(IC50)) in AML cell lines. RNA data and response data were from CCLE and GDSE2, respectively. Bold box emphasizes correlation between the signatures and drug responses.
Fig. S5. Original Gene Expression Profile of Optimized Genes Original expression (RPKM) profile after gene optimization in the three AML datasets. Row indicates the optimized genes with rank3 in the given dataset. The order of samples is the same as in Fig. 3.
Clustering is conducted after log2-transformation and row scaling.
Fig S6. Identification of BCL2 Family-Related Subtypes in Other Hematologic Malignancies
(A) Profile of signatures in other hematologic malignancies (CLL and DLBCL). Weights of the BCL2 family in signatures are described in Fig. S4B. Clustering is conducted after row scaling.
Cluster A, B, and C indicate signature 1, 2, and 3-enriched samples respectively.
(B) GSEA from the comparison between one cluster and the others identifies enriched gene sets in each cluster. NES indicates normalized enrichment score. Gene sets are the same as in Fig. 5.
Fig. S7. Batch Effect Correction
PCA from expression profiles before or after batch correction between (A) BeatAML and LeuceGene or (B) BeatAML and CCLE.
Fig. S8. External Validation of the Venetoclax Response Classifier
Comparison of prediction performance between classifiers in LeuceGene (external validation set). Bar graphs show an estimate of the probability (y hat) of individuals. Used variables and models are the same as in Fig. 6. Error bar indicates 95% confidence interval (CI).
Fig. S9. Prediction Performance of Signatures between Before and After Gene Optimization
Comparison of prediction performance between classifiers, which are trained using signatures calculated from total genes, domain knowledge-based collected genes, or optimized genes. Logistic regression is used. The number of signatures components are stated in the right table (#Gene). Error bar indicates 95% confidence interval (CI). P-values are calculated by comparison to the optimized gene model (rank3) using the DeLong test.
Fig. S10. Profile of Signatures in CCLE AML
H matrix presenting a signature profile of CCLE AML. Clustering is conducted after row scaling. Drug IC50 information is from GDSC2.
Fig. S11. Correlation between signatures and drug response in CCLE AML
Correlation between signatures and inhibitor responses (ln(IC50)) in AML cell lines. RNA data and response data were from CCLE and GDSE2, respectively. The bold box emphasizes the correlation between the signatures and drug responses.
Fig. S12. Prediction Performance in Cell Line
H matrix presenting a signature profile of CCLE AML. Clustering is conducted after row scaling. Drug IC50 information is from GDSC2.
Fig. S13. Scheme of Gene Optimization Algorithm
H matrix presenting a signature profile of CCLE AML. Clustering is conducted after row scaling. Drug IC50 information is from GDSC2.
Gene Beat
AML Leuce Gene TCGA
ABL1 o o o
AEN o x o
AIFM1 x x o
AKT1 x o x
APAF1 o o x
APOPT1 o x x
ARL6IP5 o o o
ATF4 o o x
ATM o x x
ATP2A1 o o o
BAD x x o
BAX o x o
BCL2 o o o
BCL2A1 o o o
BCL2L1 o o o
BCL2L10 o o o
BCL2L11 x o o
BCL2L2 o o o
BCL3 x o o
BIK x o x
BIRC2 o o x
BIRC3 o o o
BNIP3 o x x
BOK o o o
BRCA1 x x o
BRCA2 x x o
BRSK2 o o o
CASP2 o o o
CASP3 x o o
CASP4 o o o
CASP7 o x o
CASP8 x o o
CASP9 x x o
CD40 x x o
CD40LG x x o
CDKN1A x x o
CEBPB x o x
CFLAR o o o
CHAC1 x x o
CHEK2 o x o
CHUK x x o
CLU x o x
CNR1 o o o
CREB1 o x o
CRIP1 x x o
CUL1 x x o
CUL2 x x o
CUL4A o x o
CUL5 o x x
CYCS x x o
CYP1B1 o o x
DAB2IP o o o
DDIT3 o o x
DDIT4 x x o
DDX3X o o x
DDX5 o o x
DFFA x o o
DFFB o o o
DIABLO x o o
DNAJC10 x o o
DYNLL1 o o x
DYNLL2 x o o
DYRK2 o o o
E2F1 o o o
E2F2 x x o
리. a
ELK1 x x o
ENDOG x x o
EP300 x x o
EPHA2 o x x
ERCC6 x o x
ERO1L x x o
ETS1 x x o
FHIT o o x
FNIP2 x x o
GSK3B o o x
GZMB x x o
HIF1A o o x
HIPK1 o o o
HIPK2 x o o
HMOX1 o x o
HRAS o x o
HRK x o o
HSPB1 o x o
HTRA2 x x o
IFI16 o o o
IKBKB o o o
IKBKE x o o
IKBKG x x o
IRAK1 x x o
ITPR1 o o x
LGALS12 x x o
MAEL o o o
MARCH5 o o x
MAP3K14 x x o
MAP3K5 o o x
MAPK8 o o x
MAPT o x o
MAT2A o x x
MCL1 o o o
MELK x x o
MLLT11 x o o
MSH2 x o o
MSH6 x o o
MYBBP1A x o o
MYC x o o
NF1 o o o
NFATC4 o x x
NFKB2 x o o
NGFR o x x
NMT1 o x o
NOL3 x x o
NPRL2 x o o
NUPR1 o x o
PDCD10 x x o
PDK1 x x o
PDK2 x o o
PERP x x o
PGAP2 o o x
PHLDA3 o x o
PIK3R1 o o o
PMAIP1 x o o
PML o o o
POLB x o x
PPM1F x o o
PPP1R15A o o o
PPP3R1 o x x
PRKCD o o x
PRKCZ o o o
PRKDC x o x
PRODH o o x
PTBP1 o o o
PTGER2 o o o
PTHLH o o x
PYCARD o x x
RAB25 o x o
RAC2 o o x
RELA x x o
RIPK1 x x o
RPS6KB2 x x o
RRP8 o x o
SCN2A o o x
SELK x x o
SFN o x o
SGPP1 x x o
SHISA5 o x x
SIRT1 x o x
SIVA1 o o o
SNW1 o x x
SRF x x o
ST20 o o o
STAT3 o o o
STAT5A x x o
STAT5B o o o
STK11 x x o
STK24 x x o
SYNGAP1 x o x
TCF4 o o x
TMEM109 o x x
TNF x o x
TNFRSF10B x x o
TNFRSF12A x o x
TNFRSF1A x o o
TNFRSF4 x o x
TNFSF4 o o o
TOPORS x x o
TP53 x o x
TP53BP2 x o x
TP63 x o x
TRADD o o x
TRAF3 x x o
TRAF5 o o o
TRAF6 o o x
TRIB3 o x x
USP28 o x x
WWOX o o x
XBP1 x o x
XPA x o o
XRCC1 x o o
ZMAT1 x o x
ZMAT3 o o x
ZNF385B x x o
ZNF385C o o x
ZNF385D o x o
9. Reference
1. H. Döhner, D. J. Weisdorf, C. D. Bloomfield, Acute myeloid leukemia. New England Journal of Medicine 373, 1136-1152 (2015).
2. R. L. Siegel, K. D. Miller, A. Jemal, Cancer statistics, 2016. CA:
a cancer journal for clinicians 66, 7-30 (2016).
3. I. De Kouchkovsky, M. Abdul-Hay, Acute myeloid leukemia: a comprehensive review and 2016 update. Blood cancer journal 6, e441-e441 (2016).
4. C. C. Coombs, M. S. Tallman, R. L. Levine, Molecular therapy for acute myeloid leukaemia. Nature Reviews Clinical Oncology 13, 305 (2016).
5. H. Döhner, E. Estey, D. Grimwade, S. Amadori, F. R. Appelbaum, T. Büchner, H. Dombret, B. L. Ebert, P. Fenaux, R. A. Larson, Diagnosis and management of AML in adults: 2017 ELN recommendations from an international expert panel. Blood 129, 424-447 (2017).
6. D. Hanahan, R. A. Weinberg, Hallmarks of cancer: the next generation. cell 144, 646-674 (2011).
7. J. Montero, A. Letai, Why do BCL-2 inhibitors work and where should we use them in the clinic? Cell Death & Differentiation 25, 56-64 (2018).
8. D. A. Pollyea, M. Amaya, P. Strati, M. Y. Konopleva, Venetoclax for AML: changing the treatment paradigm. Blood Advances 3, 4326-4335 (2019).
9. L. Hogdal, D. J. DeAngelo, R. M. Stone, V. I. Gaidzik, D. Bucci, K. Döhner, G. Marcucci, J. Ryan, A. Letai. (American Society of Hematology Washington, DC, 2013).
10. L. Hogdal, B. Chyla, E. McKeegan, J. Leverson, J. Potluri, R.
Humerickhouse, M. Mack, D. DeAngelo, I. Galinsky, R. Stone.
(AACR, 2015).
11. C. D. DiNardo, B. A. Jonas, V. Pullarkat, M. J. Thirman, J. S.
Garcia, A. H. Wei, M. Konopleva, H. Döhner, A. Letai, P. Fenaux, Azacitidine and venetoclax in previously untreated acute myeloid leukemia. New England Journal of Medicine 383, 617-629 (2020).
12. R. Bisaillon, C. Moison, C. Thiollier, J. Krosl, M.-E. Bordeleau, B. Lehnertz, V.-P. Lavallée, T. MacRae, N. Mayotte, C. Labelle, Genetic characterization of ABT-199 sensitivity in human AML.
Leukemia 34, 63-74 (2020).
13. H. Zhang, B. Wilmot, D. Bottomly, S. E. Kurtz, C. A. Eide, A.
Damnernsawad, K. Romine, S. Patel, B. J. Druker, S. K.
Mcweeney, Biomarkers Predicting Venetoclax Sensitivity and Strategies for Venetoclax Combination Treatment. Blood 132, 175-175 (2018).
14. L. Portt, G. Norman, C. Clapp, M. Greenwood, M. T. Greenwood, Anti-apoptosis and cell survival: a review. Biochimica et Biophysica Acta (BBA)-Molecular Cell Research 1813, 238-259 (2011).
15. R. Pan, L. J. Hogdal, J. M. Benito, D. Bucci, L. Han, G.
Borthakur, J. Cortes, D. J. DeAngelo, L. Debose, H. Mu, Selective BCL-2 inhibition by ABT-199 causes on-target cell death in acute myeloid leukemia. Cancer discovery 4, 362-375 (2014).
16. M. Hemann, S. Lowe. (Nature Publishing Group, 2006).
17. K. Nakano, K. H. Vousden, PUMA, a novel proapoptotic gene, is induced by p53. Molecular cell 7, 683-694 (2001).
18. E. Oda, R. Ohki, H. Murasawa, J. Nemoto, T. Shibue, T.
Yamashita, T. Tokino, T. Taniguchi, N. Tanaka, Noxa, a BH3-only member of the Bcl-2 family and candidate mediator of p53-induced apoptosis. Science 288, 1053-1058 (2000).
19. M. Tamatani, Y. H. Che, H. Matsuzaki, S. Ogawa, H. Okado, S.-i.
Miyake, T. Mizuno, M. Tohyama, Tumor necrosis factor induces Bcl-2 and Bcl-x expression through NFκB activation in primary hippocampal neurons. Journal of Biological Chemistry 274, 8531-8538 (1999).
20. S. D. Catz, J. L. Johnson, Transcriptional regulation of bcl-2 by nuclear factor κB and its significance in prostate cancer.
Oncogene 20, 7342-7351 (2001).
21. C.-Y. Wang, D. C. Guttridge, M. W. Mayo, A. S. Baldwin, NF-κB induces expression of the Bcl-2 homologue A1/Bfl-1 to preferentially suppress chemotherapy-induced apoptosis.
Molecular and cellular biology 19, 5923-5929 (1999).
22. A. Ramjaun, S. Tomlinson, A. Eddaoudi, J. Downward, Upregulation of two BH3-only proteins, Bmf and Bim, during TGF β-induced apoptosis. Oncogene 26, 970-981 (2007).
23. T. Motyl, K. Grzelkowska, W. Zimowska, J. Skierski, P. Warȩski, T. Płoszaj, L. Trzeciak, Expression of bcl-2 and bax in TGF-β 1-induced apoptosis of L1210 leukemic cells. European journal of cell biology 75, 367-374 (1998).
24. J. M. Francis, C. M. Heyworth, E. Spooncer, A. Pierce, T. M.
Dexter, A. D. Whetton, Transforming growth factor-β1 induces apoptosis independently of p53 and selectively reduces expression of Bcl-2 in multipotent hematopoietic cells. Journal of Biological Chemistry 275, 39137-39145 (2000).
25. K. Devarajan, Nonnegative matrix factorization: an analytical and interpretive tool in computational biology. PLoS computational biology 4, (2008).
26. J.-P. Brunet, P. Tamayo, T. R. Golub, J. P. Mesirov, Metagenes and molecular pattern discovery using matrix factorization.
Proceedings of the national academy of sciences 101, 4164-4169 (2004).
27. A. Frigyesi, M. Höglund, Non-negative matrix factorization for the analysis of complex gene expression data: identification of clinically relevant tumor subtypes. Cancer informatics 6, CIN.
S606 (2008).
28. J. M. Eastel, K. W. Lam, N. L. Lee, W. Y. Lok, A. H. F. Tsang, X. M. Pei, A. K. C. Chan, W. C. S. Cho, S. C. C. Wong, Application of NanoString technologies in companion diagnostic development. Expert review of molecular diagnostics 19, 591-598 (2019).
29. B. Mizukawa, J. Wei, M. Shrestha, M. Wunderlich, F.-S. Chou, A.
Griesinger, C. E. Harris, A. R. Kumar, Y. Zheng, D. A. Williams, Inhibition of Rac GTPase signaling and downstream prosurvival Bcl-2 proteins as combination targeted therapy in MLL-AF9 leukemia. Blood, The Journal of the American Society of Hematology 118, 5235-5245 (2011).
30. N. Shirsat, R. Pignolo, B. Kreider, G. Rovera, A member of the ras gene superfamily is expressed specifically in T, B and myeloid hemopoietic cells. Oncogene 5, 769-772 (1990).
31. Y. Wu, M. Yang, J. Fan, Y. Peng, L. Deng, Y. Ding, R. Yang, J.
Zhou, D. Miao, Q. Fu, Deficiency of osteoblastic Arl6ip5 impaired osteoblast differentiation and enhanced osteoclastogenesis via disturbance of ER calcium homeostasis and induction of ER stress-mediated apoptosis. Cell death & disease 5, e1464-e1464 (2014).
32. P. Song, S. Yang, H. Hua, H. Zhang, Q. Kong, J. Wang, T. Luo, Y. Jiang, The regulatory protein GADD34 inhibits TRAIL-induced apoptosis via TRAF6/ERK-dependent stabilization of myeloid cell leukemia 1 in liver cancer cells. Journal of Biological Chemistry 294, 5945-5955 (2019).
33. J. L. Armstrong, R. Flockhart, G. J. Veal, P. E. Lovat, C. P.
Redfern, Regulation of endoplasmic reticulum stress-induced cell death by ATF4 in neuroectodermal tumor cells. Journal of Biological Chemistry 285, 6091-6100 (2010).
34. H. E. Ramsey, M. A. Fischer, T. Lee, A. E. Gorska, M. P.
Arrate, L. Fuller, K. L. Boyd, S. A. Strickland, J. Sensintaffar, L.
J. Hogdal, A novel MCL1 inhibitor combined with venetoclax rescues venetoclax-resistant acute myelogenous leukemia. Cancer discovery 8, 1566-1581 (2018).
35. A. D. de Araujo, J. Lim, K.-C. Wu, Y. Xiang, A. C. Good, R.
Skerlj, D. P. Fairlie, Bicyclic helical peptides as dual inhibitors selective for Bcl2A1 and Mcl-1 proteins. Journal o