저작자표시-비영리-변경금지 2.0 대한민국 이용자는 아래의 조건을 따르는 경우에 한하여 자유롭게
l 이 저작물을 복제, 배포, 전송, 전시, 공연 및 방송할 수 있습니다. 다음과 같은 조건을 따라야 합니다:
l 귀하는, 이 저작물의 재이용이나 배포의 경우, 이 저작물에 적용된 이용허락조건 을 명확하게 나타내어야 합니다.
l 저작권자로부터 별도의 허가를 받으면 이러한 조건들은 적용되지 않습니다.
저작권법에 따른 이용자의 권리는 위의 내용에 의하여 영향을 받지 않습니다. 이것은 이용허락규약(Legal Code)을 이해하기 쉽게 요약한 것입니다.
Disclaimer
저작자표시. 귀하는 원저작자를 표시하여야 합니다.
비영리. 귀하는 이 저작물을 영리 목적으로 이용할 수 없습니다.
변경금지. 귀하는 이 저작물을 개작, 변형 또는 가공할 수 없습니다.
공학석사 학위논문
Electrochemical reduction of liquid CO 2 in high pressure cell
고압반응용기를 이용한 액화 이산화탄소의 전기화학적 환원 반응
2019년 2월
서울대학교 대학원 재료공학부
하 탁 래
2
i
ABSTRACT
Electrochemical reduction of liquid CO
2in high pressure cell
Takrae Ha Department of Materials Sience and Engineering The Graduate School Seoul National University
Carbon dioxide(CO2) which is the representative greenhouse gas accelerates global warming. The amount of CO2 emission increased dramatically in the use of fossil fuels since the industrial revolution. In order to solve the carbon imbalance brought by mankind, research to make value-added compounds from CO2 through electrochemical reduction has been drawing attention. To electrochemically react CO2, the problem of low faradaic efficiency and low selectivity must be solved. In this study, we noticed that low solubility of CO2 in water can lead to a decrease in faradic efficiency. Electrochemical reduction reaction using liquefied carbon dioxide was studied to increase the low solubility of carbon dioxide.
To proceed electrochemical reaction using liquefied carbon dioxide, a new high pressure cell was designed and electrochemically reacted with liquid CO2 using the high pressure cell was conducted. Experiments were conducted under various
ii
conditions such as the amount of co-solvent, the amount of water, the counter electrode and the working electrode to obtain optimum electrochemical conditions using liquid CO2 with the high pressure cell. In addition, bulk electrolysis was carried out under various conditions such as pressure, potential, water amount, etc. with Ni and Cu electrode and C4 hydrocarbons were produced. Products were analyzed using GC and GC-MS and faradaic efficiency was calculated. We have also discovered the possibility of reaction of acetonitrile(ACN) used as co-solvent, using N,N- dimethylformamide(DMF) as a new solvent.
This study has significance in that the reaction proceeds by using liquid CO2 in the electrochemical reaction of CO2 which has focused on improving the catalyst.
Based on this research we expect to be able to develop new technology to make value-added hydrocarbon through electrochemical reaction using liquid CO2
Key words: Liquid CO2, CO2 reduction, High pressure cell, Electrochemical reaction
Student Number: 2017-24874
iii
Contents
____________________________________________________
Chapter 1. Introduction . . . .1
1.1 Carbon dioxide emission . . . .1
1.2 Carbon value-addition . . . .6
1.2.1 Electrochemical reduction of CO2 . . . .6
1.2.2 Problem of CO2 electrochemical reaction . . . 6
1.3 High pressure and liquid CO2 . . . .11
1.3.1 Solubility of CO2 . . . .11
1.3.2 High pressure CO2 . . . 11
1.4 Liquid CO2 . . . 14
1.4.1 Liquid CO2 . . . 14
1.4.2 Co-solvent . . . .. . . 16
1.4.3 Direct reduction of Liquid CO2 . . . 16
____________________________________________________ Chapter 2. Manufacture of High pressure cell and Experiment . . . 18
2.1 Manufacture of High pressure cell . . . 18
iv
2.1.1 Previous study of high pressure cell . . . 18
2.1.2 Previous cell in our lab . . . 21
2.1.3 New high pressure cell . . . 24
2.2 Experimental. . . 27
2.2.1 Materials . . . 27
2.2.2 Electrochemical analysis . . . 27
2.2.3 Analytic method . . . 28
____________________________________________________ Chapter 3. Results and Discussions . . . 29
3.1 Optimization. . . 29
3.1.1 Acetonitrile . . . 29
3.1.2 Proton source . . . 32
3.1.3 Counter electrode . . . 36
3.1.4 Working electrode . . . 45
3.2 Electrochemical characterization . . . 47
3.2.1 Effect of pressure . . . 47
3.2.2 Effect of potential . . . 51
3.2.3 Effect of pressure . . . 53
v
3.2.4 Effect of co-solvent . . . 55
____________________________________________________
Chapter 4. conclusion . . . 59 ____________________________________________________
Reference . . . .61 ____________________________________________________
국문 초록 . . . 66
vi
List of Tables
____________________________________________________
Table 1.1 Various metal electrodes and their CO2 reduction products. Faradaic efficiencies of each product are indicated. . . 10
____________________________________________________
Table 3.1 Faradaic efficiency(%) of products from electrochemical reduction of liquid CO2 with different counter electrode. Electrolysis was conducted with -2.5V, charge passed 200C. . . 44 Table 3.2 Faradaic efficiency(%) of products from electrochemical reduction of liquid CO2 with different working electrode. Electrolysis was conducted with -2.5V, charge passed 200C. . . 46 Table 3.3 Faradaic efficiency(%) of products from electrochemical reduction of liquid CO2 with different pressure. Electrolysis was conducted with -2.5V, charge passed 200C. . . 50 Table 3.4 Faradaic efficiency(%) of products from electrochemical reduction of liquid CO2 with different potential. Electrolysis was conducted with -2.5V, charge passed 200C. . . 52 Table 3.5 Faradaic efficiency(%) of products from electrochemical reduction of liquid CO2 with different amounts of water. Electrolysis was conducted with -2.5V, charge passed 200C. . . 54 Table 3.6 Faradaic efficiency(%) of products from electrochemical reduction of
vii
liquid CO2 with different co-solvent. Electrolysis was conducted with - 2.5V, charge passed 200C. . . .. 56 Table 3.7 Faradaic efficiency(%) of products from electrochemical reduction of liquid CO2 with different amounts of water using DMF co-solvent.
Electrolysis was conducted with -2.5V, charge passed 200C. . . 58
viii
List of Figures
____________________________________________________
Figure 1.1 The graph of Global Temperature and Carbon dioxide from 1880 to 2010. . . 3 Figure 1.2 The scheme of carbon cycle. . . .4 Figure 1.3 Monthly mean atmospheric carbon dioxide at Mauna Loa Observatory, Hawaii. The red curve represents the carbon dioxide data measured as the mole fraction in dry air, on Mauna Loa constitute. The black curve represents the seasonally corrected data. . . .5 Figure 1.4 Chemical scheme of carbon. . . .8 Figure 1.5 Thermodynamic potentials of various cathodic reactions possible in the system of CO2 reduction reaction. . . .9 Figure 1.6 Solubility of carbon dioxide in water. . . 12 Figure 1.7 Solubility of carbon dioxide in organic solvents such as CH3COOH, Pyridine, CH3OH, C2H5OH . . . 13 Figure 1.8 Phase diagram of CO2 . . . 15
____________________________________________________
Figure 2.1 Structure of high pressure cell of the Abbott group. . . 19 Figure 2.2 Structure of high pressure cell of Zhao and Guying group (1) gas inlet;
(2) gas outlet; (3) quasi-reference electrode(Pt wire); (4) cathode(Cu
ix
plank); (5) anode(Pt plank); (6) Teflon packing; (7) Teflon; (8) stirrer. . . 20 Figure 2.3 The draft of High pressure cell. It has gas outlet and inlet, pressure gauge,
and electrode connector The distance between the working electrode and counter electrode was 2.5cm and volume of the cell was 135ml. . . 22 Figure 2.4 Electrochemical properties of the high pressure cell. ACN 30ml+TBABF4 0.2M, 0.5M and 1M concentration was used as co- solvent. Working electrode is Cu electrode. Counter electrode and Reference electrode is Pt electrode (a) System resistance(ohm) by concentration of electrolyte (mol/L) (b) Current density(mAcm-2) by potential(V vs. Pt) . . . 23 Figure 2.5 Blueprint of new high pressure cell. The distance between working electrode and counter electrode is 5mm. The capacity of the cell was 60ml.
There are windows on both sides of the cell. . . 25 Figure 2.6 Actual appearance of high pressure cell. (a) Overall appearance of high pressure cell. (b) The lid of high pressure cell. . . 26
____________________________________________________
Figure 3.1 Cyclic voltammetry data of liquid CO2 with various concentrations of co- solvent(ACN+TBABF4 0.5M) at 100mVs-1. Working electrode was Cu, Counter and reference electrode were Pt electrode. . . 30 Figure 3.2 Resistance of liquid CO2 system with various concentration of co-
x
solvent(ACN+TBABF4). . . 31 Figure 3.3 Cyclic voltammetry of liquid CO2 with different amounts of water using
Cu electrode as working electrode at 100mVs-1. Co-solvent was used 20%
ACN and TBABF4(0.5M) electrolyte. . . 33 Figure 3.4 Cyclic voltammetry of liquid CO2 with different amounts of water using Ni electrode as working electrode at 100mVs-1. Co-solvent was used 20%
ACN and TBABF4(0.5M) electrolyte. . . 34 Figure 3.5 Resistance of liquid CO2 with different amounts of water using Ni and Cu electrode as working electrode. . . 35 Figure 3.6 Cyclic voltammetry of liquid CO2 with different amounts of water and different working electrode at 100mVs-1. Co-solvent was used 20% ACN and TBABF4(0.5M) electrolyte . . . 40 Figure 3.7 GC results from bulk electrolysis at -2.5V with charge passed 200C, using Ni electrode. . . 41 Figure 3.8 Gas chromatography-mass spectrometry(GC-MS) results from bulk electrolysis at -2.5V with charge passed 200C. Retention time was 2.5 to 4.8min (a) Ni electrode (b) Cu electrode. . . 42 Figure 3.9 Gas chromatography-mass spectrometry(GC-MS) results from bulk electrolysis at -2.5V with charge passed 200C. Retention time was 7.7 to 8.6min (a) Ni electrode (b) Cu electrode. . . 43 Figure 3.10 Faradaic efficiency(%) of products from electrochemical reduction of liquid CO2 with different counter electrode. Electrolysis was conducted
xi
with -2.5V, charge passed 200C. . . 44 Figure 3.11 Faradaic efficiency(%) of products from electrochemical reduction of liquid CO2 with different working electrode. Electrolysis was conducted with -2.5V, charge passed 200C. . . 46 Figure 3.12 Faradaic efficiency(%) of products from electrochemical reduction of liquid CO2 with different pressure using Cu electrode. Electrolysis was conducted with -2.5V, charge passed 200C. . . .48 Figure 3.13 Faradaic efficiency(%) of products from electrochemical reduction of liquid CO2 with different pressure using Ni electrode. Electrolysis was conducted with -2.5V, charge passed 200C. . . 49 Figure 3.14 Faradaic efficiency(%) of products from electrochemical reduction of liquid CO2 with different potential. Electrolysis was conducted with - 2.5V, charge passed 200C. . . 52 Figure 3.15 Faradaic efficiency(%) of products from electrochemical reduction of liquid CO2 with different amounts of water. Electrolysis was conducted with -2.5V, charge passed 200C. . . 54 Figure 3.16 Faradaic efficiency(%) of products from electrochemical reduction of liquid CO2 with different co-solvent. Electrolysis was conducted with - 2.5V, charge passed 200C. . . 56 Figure 3.17 Cyclic voltammetry of liquid CO2 with different co-solvent and different working electrode at 100mVs-1. Co-solvent was used 20% ACN and TBABF4(0.5M) electrolyte (a) Cu electrode (b) Ni electrode. . . 57
xii
Figure 3.18 Faradaic efficiency(%) of products from electrochemical reduction of liquid CO2 with different amounts of water using DMF co-solvent.
Electrolysis was conducted with -2.5V, charge passed 200C. . . 58
1
Chapter 1. Introduction
1.1 Carbon dioxide emission
Carbon dioxide(CO2) which is the representative greenhouse gas accelerates global warming. The amount of CO2 emission increased dramatically in the use of fossil fuels since the industrial revolution. Since 1750, CO2 has increased by 36% and these levels are much higher than the increased level during the past 800 thousand years.[1],[2] Looking at Figure 1.1[3], we can see that the increase in CO2 concentration is directly related to the temperature of the earth, while comparing the concentration of CO2 and the global temperature
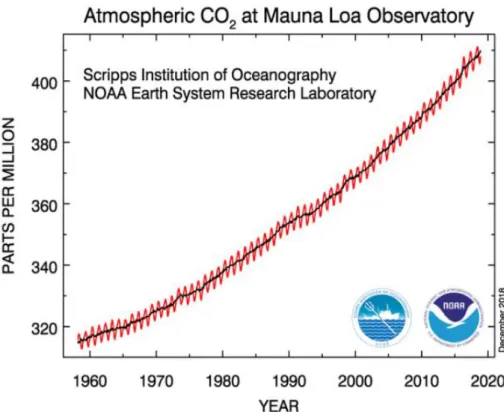
Figure 1.2 is a schematic representation of the carbon cycle on the earth. Carbon on the earth can exist as a gas phase, a solid state or an aqueous solution, which are circulated through various pathways and are balanced. On the basis of the use of fossil fuels the production of gas greatly increased, resulting in an imbalance in the carbon cycle. Most of the gas generated for the use of fossil fuels is carbon dioxide, which is pointed out as the main cause of global warming. Actually, looking at atmospheric CO2 in Figure 1.3, we can observe the dramatic rise of atmospheric CO2. It can be confirmed that the CO2
concentration which was 316.91ppm in 1960 increased to 410.67ppm in 2019.
2
Therefore, in order to solve the carbon imbalance brought by mankind, Paris Agreement was adopted at 2015 United nations Climate Change Conference. The content of Paris Agreement is and international commitment to maintain the increase in the average temperature of the earth below 2℃
compared to before the industrial revolution and to further limit the temperature rise to 1.5℃ of less. Each country has to decide on reduction targets for greenhouse gas by themselves and practice the target. The Republic of Korea also agrees with the goal of a 37% reduction compared with the predicted value by 2030.[4]
3
Figure 1.1 The graph of Global Temperature and Carbon dioxide from 1880 to 2010
4 Figure 1.2 The scheme of carbon cycle
5
Figure 1.3 Monthly mean atmospheric carbon dioxide at Mauna Loa Observatory, Hawaii. The red curve represents the carbon dioxide data measured as the mole fraction in dry air, on Mauna Loa constitute. The black curve represents the seasonally corrected data
6 1.2 Carbon value-adding
1.2.1 Electrochemical reduction of CO2
From these viewpoints, researches to reduce and utilize atmospheric CO2 have been drawing attention. Figure 1.4 shows chemical scheme of carbon.
Looking at Figure 1.2, CO2 is completely oxidized gaseous carbon. By reducing CO2, it is possible to synthesize more valuable compounds such as formic acid, methanol, methane. Because CO2 has a chemically stable structure, it is not easy for the reaction to proceed, because a strong reducing agent is required to proceed the reduction reaction.[5] Therefore, the reaction can proceed with the condition of high temperature or high pressure.
However, when using electrochemistry, the reaction proceeds by using electrons instead of oxidizing agent and reducing agent, and in the case of CO2, by adding proton source and voltage, it is relatively easy to convert CO2 to various valuable carbon compound.[6]
1.2.2 Problem of CO2 electrochemical reaction
When CO2 is reduced electrochemically, carbon monoxide(CO), formate(HCOOH), methane(CH4) and other hydrocarbons are generated.
Figure 1.5[7] summarizes these reactions. In order to electrochemically react carbon dioxide, we face various challenges. First a high overpotential is require, it shows low selectivity and faradaic efficiency(FE), and low current density by
7
low solubility of CO2.[8] There is also a problem in that it is a competitive reaction with aqueous evolution reaction form aqueous solution.[9] Many researchers are making efforts to solve this problem.
In previous studies, the tendency was investgated focusing on the catalytic ropertiesof the metal electrode. According to Table 1.1[10], it can be classified into 4 groups according to the products obtainable by reducing the catalytic activity and selectivity CO2 of polycrystalline metal electrodes.- CO group (Au, Ag, Zn, Pd, Ga), HCOOH group (Pb, Hg, Tl, In, Sn, Cd, Bi), H2
group (Ni, Fe, Pt, Ti) and Cu. Most of the metal produced C1 chemicals(CO, HCOOH), and the Cu electrode reduced CO2 to various hydrocarbons such as methane(CH4), ethylene(C2H4), ethane(C2H6) and propanol(C3H7OH), but Cu shows low selectivity.
Since then, in the case of catalysts based on copper, the studies have concentrated on using alloy electrodes[11] and using the structure of electrodes[12]
to increase the selectivity of valuable compounds and enhance the faradaic efficiency. Efforts have been made to selectively produce valuable hydrocarbons but research have not yet shown high figures in selectivity faradic efficiency.
8 Figure 1.4 Chemical scheme of carbon.
9
Figure 1.5 Thermodynamic potentials of various cathodic reactions possible in the system of CO2 reduction reaction
10
Table 1.1 Various metal electrodes and their CO2 reduction products. Faradaic efficiencies of each product are indicated
11 1.3. High pressure and liquid CO2
1.3.1 solubility of CO2
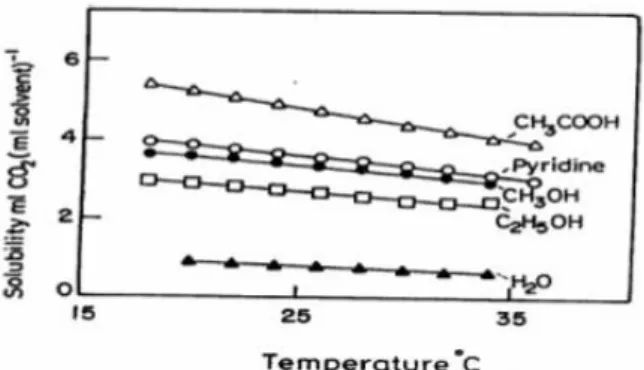
We tried concentrating on the solubility of CO2 as a cause of low faradaic efficiency and selectivity. Looking the Figure 1.6 which is the graph of solubility of carbon dioxide in water, it can be confirmed that a small amount of about 0.2g is dissolved in 100ml of water at room temperature.[13] In order to solve this problem, some studies dissolve carbon dioxide in an organic solvent such as acetonitrile(ACN), tetrahydrofuran(THF), N,N-dimethylformamide (DMF). These methods also have solubility of about 10 to 20 times higher than solubility in water, but it still have low solubility.(Figure 1.7) These low solubility can cause faradaic efficiency degradation by allowing water and organic solvent to react instead of CO2 from the electrode.[9]
1.3.2 High pressure CO2
There is a way to use high pressure CO2 to solve the problem of low FE and low selectivity[14] Using high pressure CO2, more CO2 becomes soluble in solvent, Larger concentrations of CO2 at the electrode result in higher current density and yields. There are studies using high pressure CO2. High CO2
pressure reduces the hydrogen evolution reaction and increases the selectivity of formic acid[15], methanol[16] and other hydrocarbons.[17] There are not many previous studies, but when using liquid CO2, it was expected to solve the problem of low solubility of CO2 and increase selectivity.
12 Figure 1.6 Solubility of carbon dioxide in water
13
Figure 1.7 Solubility of carbon dioxide in organic solvents such as CH3COOH, Pyridine, CH3OH, C2H5OH
14 1.4 Liquid CO2
.
1.4.1 Liquid CO2
Liquid CO2 has the characteristic of being non-toxic, inexpensive, non-flammable and relatively inert. Also, looking at the phase diagram of CO2(Figure 1.8), it is an attractive solvent in that it can be made easily with low pressure. Utilizing this properties, Abbott&Harper[18] investigated the electrochemical properties of liquid CO2. Experiment was carried out by solving hydrophobic electrolytes (tetrakis(decyl)ammonium tetraphenylborate) in liquid. They measured the conductivity and double-layer capacitance of liquid CO2, revealing that a high concentration of supporting electrolyte increases solvent conductivity. There is a problem of very low electric conductivity due to the characteristics of CO2 having a low dielectric contant(ε<2). Due to this problem, there was a difficulty of proceeding the electrochemical reaction
15 Figure 1.8 Phase diagram of CO2
16 1.4.2 Co-solvent
The low dielectric constant of dioxide and the low solubility of salt show low electric conductivity. In order to increase the electric conductivity, co-solvent has come to appear. Co-solvent means using both liquid CO2 and other solvents that can dissolve the salt. Goldfarb et al.[19] studied dielectric and voltammetric properties according to the proportion of methanol as co-solvent.
They observed that the dielectric constant increases as the mole fraction of methanol increases.
The most extensive study of the use of co-solvents on the phase behavior and conductivity of liquid CO2 was studied by Bartlett et al.[20] They use acetonitrile(ACN) and methanol as co-solvent for liquid CO2. Using tetrabutylammonium tetrafluoroborate(TBABF4) as a supporting electrolyte, ACN have the solubility of salt 5 times higher than methanol. The high solubility of supporting electrolyte means better electrical conductivity, and for later experiments ACN is used as the co- solvent.
1.4.3 Direct reduction of Liquid CO2
Experiments using liquid CO2 have largely progressed in two directions. It has been used to directly react CO2 used as a so liquid CO2 as a solvent for other reactions, such as replacing an alcohol with an aldehyde or converting a halogen element[21] into a carboxyl group.[22]
We decided concentrate on the fundamental reaction of direct
17
reduction of CO2 rather than application by solvent. In a previous study to direct react liquid CO2, C2 hydrocarbons were generated using Pt electrode[23], and Cu has been used to obtain interesting results such as showing faradaic efficiency different from atmospheric pressure conditions.[24] However, there are only three prior studies that are lack of reliability and research under various conditions.
Among many electrodes, The optimum condition is found in the liquid CO2 reaction by using Cu electrode which is the most commonly used for CO2
reduction reaction and H2 group(Ni, Pt, Ti, Fe). If the faradaic efficiency changes and the H2 group yields a product other than H2, it may be interesting.
In addition, if the experiment is carried out under various conditions such as potential, water content, co-solvent, etc., it will become the basic of the liquid CO2 reaction to be carried out later
18
Chapter 2. Manufacture of High pressure cell and Experiment
2.1 Manufacture of High pressure cell
2.1.1 Previous study of high pressure cell
The first task we need to perform to carry out liquid CO2 experiments was to study the researches about high pressure cell. Most of high pressure cell is sufficient to apply pressure to withstand, but in our experiment we need to proceed with the electrochemical reaction. So we need to create a new design of high pressure cell.
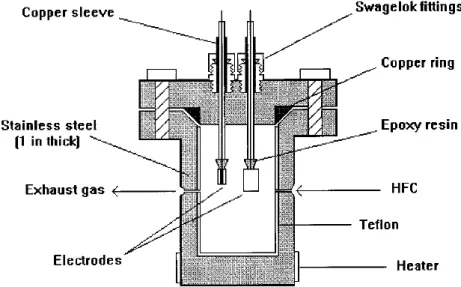
Figure 2.1 shows the high pressure cell that the Abbott group used for liquid CO2 reaction experiments.[23] The Abbott group used 15ml cell, the interval between the working electrode and counter electrode was 2mm and it was very narrow. There was a gas container for the gas analysis. Figure 2.2 show the high pressure cell that the Zhao and Guying et al.[25] 30ml cell was used and the distance between the electrodes was 3mm. In addition, they attached a gas bag for gas analysis.
As a result of observing these high pressure cell, the size of the container was small and there was a gas collecting container for gas analysis.
In particular, to solve the low electric conductivity of liquid CO2 the distance between the electrodes is very small.
19
Figure 2.1 Structure of high pressure cell of the Abbott group
20
Figure 2.2 Structure of high pressure cell of Zhao and Guying group (1) gas inlet; (2) gas outlet; (3) quasi-reference electrode(Pt wire); (4) cathode(Cu plank); (5) anode(Pt plank); (6) Teflon packing; (7) Teflon; (8) stirrer.
21 2.1.2 Previous cell in our lab
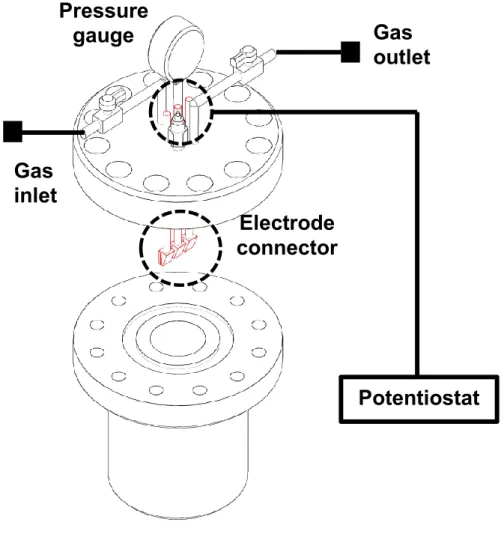
The design of the high pressure reactor which existed in our laboratory is the same as Figure 2.3. It was made of stainless steel to be able to withstand high pressure, was installed the electrodes for electrochemical reaction.
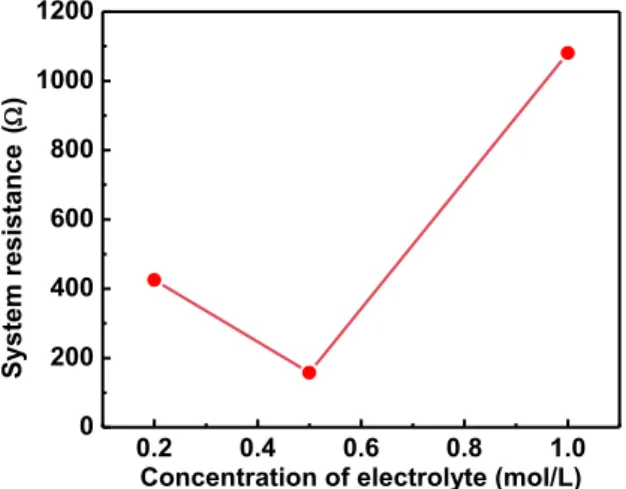
As a result of the reaction with existing cell, there were various problems existed in the high pressure cell. The biggest issue among them is that the distance between the working electrode and counter electrode is 2.5cm, which is much wider than the previous studies. Looking at system resistance in Figure 2.4(a), when using an electrolyte concentration of 0.5M, it showed the lowest resistance and its resistance was about 200ohm. 200ohm is so big that it is not suitable for electrochemical reaction. In addition, when we looked at the current density measured in Figure 2.4(b), it was observed that even with a high potential of -3.0V applied, it shows very low current density of 0.174mAcm-2.
Besides, it took a long time to react because of large volume of the cell(135ml). In order to observe the internal phase change, we make a window on the top of the cell, but it was difficult to observe the inside because it was difficult to enter the light into the cell. Also, there was a difficulty in gas analysis because there was no gas container for gas analysis.
22
Figure 2.3 The draft of High pressure cell. It has gas outlet and inlet, pressure gauge, and electrode connector The distance between the working electrode and counter electrode was 2.5cm and volume of the cell was 135ml
Electrode connector Pressure
gauge Gas
outlet
Potentiostat Gas
inlet
23
0.2 0.4 0.6 0.8 1.0
0 200 400 600 800 1000 1200
System resistance ()
Concentration of electrolyte (mol/L)
0.0 -0.5 -1.0 -1.5 -2.0 -2.5 -3.0 -0.05
0.00 0.05 0.10 0.15 0.20
Current density (mA cm-2 )
Potential (V vs. Pt) 0.2 M TBABF4
0.5 M TBABF4 1 M TBABF4
Figure 2.4 Electrochemical properties of the high pressure cell. ACN 30ml+TBABF4 0.2M, 0.5M and 1M concentration was used as co-solvent.
Working electrode is Cu electrode. Counter electrode and Reference electrode is Pt electrode (a) System resistance(ohm) by concentration of electrolyte(mol/L) (b) Current density(mAcm-2) by potential(V vs. Pt)
24 2.1.3 New high pressure cell
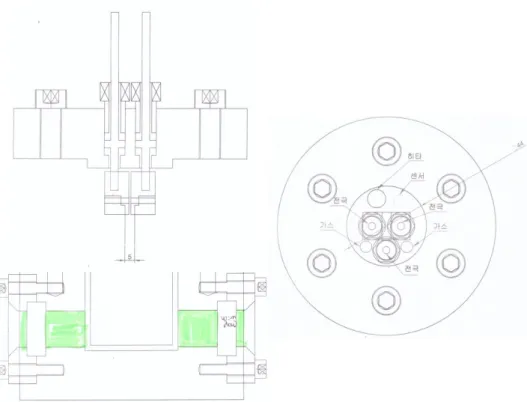
To solve these problem we design and manufacture a new high pressure cell for liquid CO2 electrochemical reaction. Figure 2.5 is a picture of a newly designed high pressure cell. The distance between the electrodes was 5mm and it was made very closely to solve the electric conductivity of CO2. The capacity of the cell was 60ml, reduced to half of the previous cell and made with quartz. We made windows on both sides of the cell so that we can observe changes inside the container. We also added a heating system so that the temperature can be changed and later make supercritical CO2 experiment possible. Finally we prepared a gas collecting container for analysis of gas.
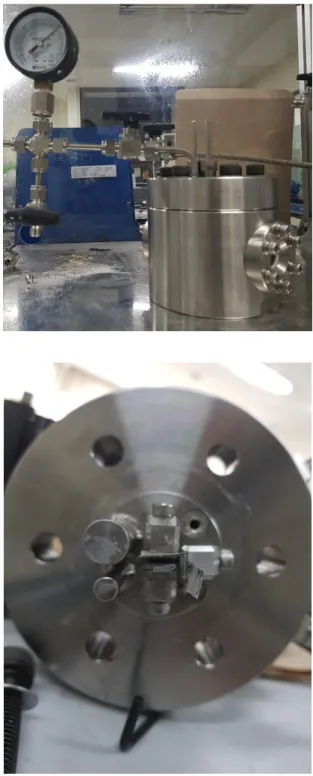
Figure 2.6 shows the actual high pressure cell. The barometer is attached to the cell and gas container. The atmospheric pressure can be measured. By reducing the distance between the electrodes to 5mm, the size of the resistance is reduced to 10 to 20 ohms enabling electrochemical experiments. Also we were able to observe liquid CO2 inside the high pressure cell through the window.
25
Figure 2.5 Blueprint of new high pressure cell. The distance between working electrode and counter electrode is 5mm. The capacity of the cell was 60ml.
There are windows on both sides of the cell
26
Figure 2.6 Actual appearance of high pressure cell. (a) Overall appearance of high pressure cell. (b) The lid of high pressure cell.
27 2.2 Experimental
2.2.1 Materials
Acetonitrile(ACN, 99.9%) were purchased from Daejung Chemicals.
tetrabutylammonium tetrafluoroborate (TBABF4, 98%) were purchased form Tokyo Chemical Industry. N,N-Dimethylformamide(DMF, 99.8%) were purchased from Sigma-Aldrich.Copper foil(Cu, 0.1mm thick), Platinum foil(Pt, 0.025mm thick), Magnesium foil(Mg, 0.25mm thick) and Nickel foil(Ni, 0.1mm thick) were purchased from Alfa Aesa. High purity deionized water(18.2 MWcm-1) was used in the procedures.
2.2.2 Electrochemical analysis
Prior to use, the metal foils were polished with sandpaper, cleaned with diluted HCl (aq.) and rinsed with distilled water. Reference electrode used Pt electrode as quasi-reference electrode. ACN used molecular sieves to remove water. Co-solvent was prepared by dissolving 0.5M TBABF4 in ACN. Co- solvent and water(protone source) were put in Quartz cell and the quartz cell was put in high pressure cell. Using a cooler, CO2 line was set to 0℃ and CO2
was injected using gas pump. Using the pump, the pressure was increased until the interior of the cell reaches 90bar. After electrolysis, liquid CO2 was vaporized by gas container and gas is collected using gas bag. 1 mL of headspace gas was transferred by syringe for gas chromatography (GC)
28
analysis. The liquid products remaining after vaporization was analyzed by gas chromatography-mass spectrometry(GC-MS) analysis
2.2.3. Analytic methods
A potentiostat (VSP-300, Bio-logic) was used for voltammeric measurements and bulk electrolysis. The quantitative measurement of the gas phase from the headspace of the electrochemical cell was performed by gas chromatography (GC, PerkinElmer, NARL8502 Model 4003). Liquid-and solid-phase products dissolved in the organic solvents were detected by gas chromatography-mass spectrometry (GC-MS, Agilent 5977) using an automatic liquid sampler.
29
Chapter 3. Results and Discussions
3.1 Optimization
3.1.1 Acetonitrile
In order to find optimal conditons for reaction experiment of liquid CO2, we conducted experiments under various conditions. The amount of ACN as co-solvent was adjusted at the very beginning. We prepared tetrabutylammonium tetrafluoroborate(TBABF4, 0.5M) electrolyte in ACN dissolved in co-solvent . Experiments were carried out using the Cu electrode as the working electrode most frequently used in the CO2 electrochemical reaction and using Pt electrode as the counter electrode and reference electrode.
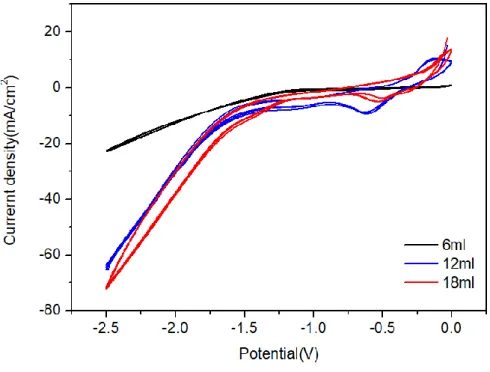
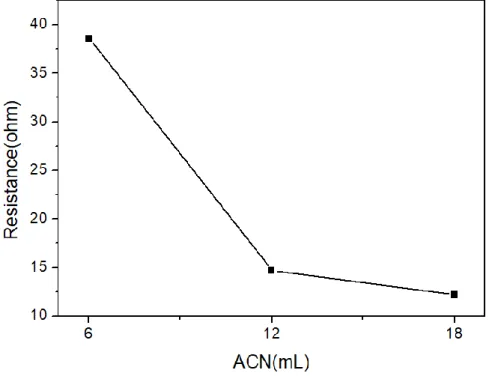
To investigate 10%, 20% and 30% of the total volume, we added 6, 12 and 18ml co-solvent, then liquefied CO2 to 90bar pressure and experimented. Cyclic voltammetry was done from 0V to -2.5V. Cyclic voltammetry scans was recorded at a 100mVs-1.
As the amount of ACN increased, we could observe that the current density increased and the resistance decreased(Figure 3.1). Also, when we measured the resistance, it showed 37.6ohm at 6ml, 15.2ohm at 12ml and 12.8ohm at 18ml(Figure 3.2). The characteristic of 18ml does not improve greatly and shows the same value as 12ml, so we are proceeding with experiments after considering it as the optimum condition of 12ml.
30
Figure 3.1 Cyclic voltammetry data of liquid CO2 with various concentrations of co-solvent(ACN+TBABF4 0.5M) at 100mVs-1. Working electrode was Cu, Counter and reference electrode were Pt electrode
31
Figure 3.2 Resistance of liquid CO2 system with various concentration of co- solvent(ACN+TBABF4).
32 3.1.2 Proton source
In order to react carbon dioxide to obtain hydrocarbons, proton source is necessary.[26] When CO2 reduction experiments proceed in aqueous solution, water will be used for proton source and participate in the reaction. However, to use ACN for co-solvent with liquid CO2, additional proton source must be included. Melchaeva et al. Conducted experiments on various proton sources of liquid CO2[24]
To increase the current density and promote CO2 electroreduction toward organic products, the amount of proton source also needs to be optimized. We used water which is the most basic proton source. Using Cu electrode as the working electrode to add 0, 0.2, 0.5 and 1ml of water, the experiment result is shown in Figure 3.3, and the Ni electrode was used as the working electrode to set the amount of water to 0, 0.5 and 1ml. The results of the experiment are shown in Figure 3.4. As a result of the experiment, we can observe that the current density increases when the amount of water is increased.
In Figure 3.5, resistance was measured for Cu and Ni electrodes. As a result, we could observe that the resistance decreases as the amount of water increases.
However, after 0.5 ml showed similar characteristics without a clear increase.
We guessed that the optimum conditions for the other catalytic properties of copper and nickel may be different, but it shows the same tendency. As the amount of water increases, it is expected that the hydrogen evolution reaction will increase. Therefore, the amount of water was fixed to 0.5 ml(0.83%).
33
Figure 3.3 Cyclic voltammetry of liquid CO2 with different amounts of water using Cu electrode as working electrode at 100mVs-1. Co-solvent was used 20%
ACN and TBABF4(0.5M) electrolyte
34
Figure 3.4 Cyclic voltammetry of liquid CO2 with different amounts of water using Ni electrode as working electrode at 100mVs-1. Co-solvent was used 20%
ACN and TBABF4(0.5M) electrolyte
35
Figure 3.5 Resistance of liquid CO2 with different amounts of water using Ni and Cu electrode as working electrode.
36 3.1.3 Counter electrode
We promoted the optimization of the counter electrode. The counter electrode mainly used platinum electrode and magnesium electrode which is a sacrificial electrode.[27] In the platinum electrode, water may react to generate oxygen generation reaction, which causes hydrogen ions to be generated. This results in a loss of Faraday efficiency and the generated hydrogen ions can proceed with other reactions.[28] On the other hand, magnesium electrode reacts with magnesium ions to form magnesium ions, so that other reactants do not react, minimizing energy loss. If carboxylation reaction occurs, carboxylic acid can be obtained via acid treatment. [29] Therefore, experiments were conducted on Pt electrode and Mg electrode.
We experimented using Cu electrode as working electrode and Pt electrode and Mg electrode respectively as counter electrode. Also, cyclic voltammetry graph was drawn by adding 0 ml and 0.5 ml of water to each counter electrode and comparing them. (Figure 3.6) As a result of performing cyclic voltammetry, we could not find a big difference between the two electrodes.
After that, bulk electrolysis was carried out along the counter electrode, and then faradaic efficiency was compared. Faradaic efficiency is a value that defines the reduction efficiency of a specific product from the viewpoint of electron transfer. Faradaic efficiency can be calculated by dividing the amount of electrons generated by the experiment by the amount of electrons that are theoretically generated. This can be calculated by dividing it into the number
37
of moles of the product and the amount of charge accumulated by the number of electrons faraday constant(F) required for production.[30]
𝐹𝑎𝑟𝑎𝑑𝑎𝑖𝑐 𝑒𝑓𝑓𝑖𝑐𝑖𝑒𝑛𝑐𝑦(%) = 𝐸𝑥𝑝𝑒𝑟𝑖𝑚𝑒𝑛𝑡𝑎𝑙 𝑒𝑣𝑜𝑙𝑢𝑡𝑖𝑜𝑛
𝑇ℎ𝑒𝑜𝑟𝑒𝑡𝑖𝑐𝑎𝑙 𝑒𝑣𝑜𝑙𝑢𝑡𝑖𝑜𝑛 × 100
= 𝑄𝑒𝑥𝑝
𝑄𝑡ℎ𝑒𝑜 × 100
= ∑(𝑚𝑜𝑙×𝑛𝑖)×𝐹
𝐼×𝑡 × 100
Since the number of electrons necessary for generation and the faraday constant(F) value are fixed and it is possible to know the amount of electric charge flowed using the potentiostat device. Therefore, it is most important to calculate the number of moles of the product precisely.
Analysis of gaseous products used GC(Figure 3.7). As a result of GC analysis, hydrogen(H2) was observed as the main product, the amount of methane(CH4) and carbon monoxide(CO) was very small amount, and it was considered as an error. In order to quantify the amount of gaseous product, the following method was used. First, after connecting with the liquid carbon dioxide gas storage container and vaporizing it, measure the pressure and obtain the volume of the gas storage container and multiply ①. After discharging the gas inside the gas container, vaporize the remaining liquefied CO2 again, measure the pressure, obtain the total volume of the high pressure container and the gas container and multiply ②. Add ① and ② to determine the total gas volume. Extract 1ml of gas using syringe and proceed with GC analysis. Faradaic efficiency was
38
calculated by quantifying the amount of gas produced using the volume per ml of GC.
GC-MS was then used to analyze the liquid product. As a result of GC- MS analysis, butanal, 2-butanone, methyl vinyl ketone(MVK), formic acid, butanoic acid were observed as main products.(Figure 3.8, Figure 3.9) In order to quantify the amount of analyzed liquid product, we used the following method. Taking formic acid as an example, GC-MS analysis was carried out according to the concentration of formic acid to obtain area value and a trend line between concentration and area was obtained. Using this, we were able to calculate the faradaic efficiency by calculating the concentration using the area of formic acid of analyzed GC-MS and quantifying the amount produced.
Faradaic efficiency could be similarly calculated for butanal, 2-butanone, methyl vinyl ketone.
Bulk electrolysis was performed at -2.5 V until the amount of electric charge was 200 C. When Mg electrode was used for the counter electrode, carboxylate was formed in the carboxylation reaction. Therefore, in the case of Mg electrode as counter electrode, after acid treatment, faradaic efficiency was calculated. The calculated faradaic efficiency is summarized in Figure 3.10 and Table 3.1. As a result of analysis, there was no difference between Mg electrode and Pt electrode in the product, but when using Pt electrode, it showed high faradaic efficiency. It turned out that loss of faradaic efficiency occurs in acid treatment process.
There was no significant difference between the Pt electrode and the Mg electrode from the CV results, and there was no big difference in the
39
comparison of the products after the Bulk electrolysis. However, when the Pt electrode was used, the sum total of faradaic efficiency appeared, which means that faradaic efficiency measurement was made more accurate using Pt electrode. Therefore, we used a platinum electrode as the counter electrode.
40
Figure 3.6 Cyclic voltammetry of liquid CO2 with different amounts of water and different working electrode at 100mVs-1. Co-solvent was used 20% ACN and TBABF4(0.5M) electrolyte
41
Figure 3.7 GC results from bulk electrolysis at -2.5V with charge passed 200C, using Ni electrode.
H2 CO
2 O
2 N
2 CH
4 CO
42
Figure 3.8 Gas chromatography-mass spectrometry(GC-MS) results from bulk electrolysis at -2.5V with charge passed 200C. Retention time was 2.5 to 4.8min (a) Ni electrode (b) Cu electrode
Butanal 2-butanone
Methyl vinyl ketone
43
Figure 3.9 Gas chromatography-mass spectrometry(GC-MS) results from bulk electrolysis at -2.5V with charge passed 200C. Retention time was 7.7 to 8.6min (a) Ni electrode (b) Cu electrode
Formic acid Butanoic acid
44
Figure 3.10 Faradaic efficiency(%) of products from electrochemical reduction of liquid CO2 with different counter electrode. Electrolysis was conducted with -2.5V, charge passed 200C.
H2 butanal MV K
2- butanon
e
Formic
acid Butanoic acid total
Cu_Pt 41.46 14.94 12.26 1.49 11.62 11.63 93.4
Cu_Mg 39.37 17.24 9.72 0.85 10.22 8.32 85.72
Ni_Pt 30.78 12.25 12.94 0.43 13.35 21.76 91.51
Ni_Mg 22.42 23.86 7.79 0.53 7.65 13.44 75.69
Table 3.1 Faradaic efficiency(%) of products from electrochemical reduction of liquid CO2 with different counter electrode. Electrolysis was conducted with -2.5V, charge passed 200C
45 3.1.4 working electrode
Finally, we conducted experiments on working electrodes. Depending on the product that can be obtained by reducing CO2, The metals were classified into four groups - CO group (Au, Ag, Zn, Pd, Ga), HCOOH group (Pb, Hg, Tl, In, Sn, Cd, Bi), H2 group (Ni, Fe, Pt, Ti) and Cu. Among these, Cu which produces the product of C2 and more, and H2 group (Ni, Fe, Pt, Ti) were experimented in order to reduce the occurrence of H2 and obtain a more valuable product.
Bulk electrolysis was performed at -2.5 V until it reached a electric charge amount of 200 C. The results of faradaic efficiency analysis are shown in Figure 3.11 and Table 3.2. When using Cu electrode, showed the highest faradaic efficiency, and in H2 group Ni electrode showed the highest faradaic efficiency. Therefore, more detailed experiments were conducted on Cu and Ni electrode.
.
Ultimately we used a high pressure reactor to react liquid CO2, we used ACN 20% dissolved TBABF4 at 0.5 M co-solvent in solution and 0.5 ml water(0.83%) for proton source. We used copper and nickel as the working electrode, and platinum electrode as the counter electrode.
46
Figure 3.11 Faradaic efficiency(%) of products from electrochemical reduction of liquid CO2 with different working electrode. Electrolysis was conducted with -2.5V, charge passed 200C
H2 Butanal MVK 2-
butanone Formic
acid Butanoic
acid total
Cu_Pt 41.46 14.94 12.26 1.49 11.62 11.63 93.4
Ni_Pt 30.78 12.25 12.94 0.43 13.35 21.76 91.51
Pt_Pt 11.29 8.74 12.10 0.80 4.17 13.89 50.99
Ti_Pt 10.51 4.90 13.97 1.37 0.90 34.79 66.44
Table 3.2 Faradaic efficiency(%) of products from electrochemical reduction of liquid CO2 with different working electrode. Electrolysis was conducted with -2.5V, charge passed 200C
47 3.2 Electrochemical characterization
3.2.1 Effect of pressure
To investigate the tendency of pressure increase, we conducted experiments at 1 bar, 30 bar, and 90 bar under the conditions of atmospheric pressure, high pressure, and liquid CO2 respectively and proceeded with bulk electrolysis at -2.5 V. The results of the faradaic efficiency analysis of Cu electrode and Ni electrode are shown in Figure 3.12, Figure 3.13 and Table 3.3. The change in faradaic efficiency and selectivity was found to be caused by the change in the pressure, and in the case of Cu electrode, as the pressure increased, H2 and C4 hydrocarbons. But it was difficult to find a clear trend in the case of Ni electrode.
48
Figure 3.12 Faradaic efficiency(%) of products from electrochemical reduction of liquid CO2 with different pressure using Cu electrode. Electrolysis was conducted with -2.5V, charge passed 200C.
49
Figure 3.13 Faradaic efficiency(%) of products from electrochemical reduction of liquid CO2 with different pressure using Ni electrode. Electrolysis was conducted with -2.5V, charge passed 200C.
50 H2 butanal MVK 2-
butanone Formic
acid Butanoic acid total
Cu_90bar 41.46 14.94 12.26 1.49 11.62 11.63 93.4
Cu_30bar 22.33 5.99 14.08 0.99 7.16 16.60 67.15
Cu_1bar 6.51 1.73 18.80 0.86 32.82 19.95 80.67
Ni_90bar 30.78 12.25 12.94 0.43 13.35 21.76 91.51
Ni_30bar 17.96 17.57 20.32 1.53 16.44 23.51 97.33
Ni_1bar 42.46 7.96 11.76 1.15 20.51 14.62 83.84
Table 3.3 Faradaic efficiency(%) of products from electrochemical reduction of liquid CO2 with different pressure. Electrolysis was conducted with -2.5V, charge passed 200C.
51 3.2.2 Effect of potential
We can observe that current density increases drastically from -1.5V in CV graph in Figure 3.2 and Figure 3.3. This makes it possible to know that CO2 reduction reaction occurs after -1.5 V. In order to investigate the effect by voltage, bulk electrolysis experiments were conducted for -2.5V, -2.25V and - 2.0V. As the voltage increased, the overall Faraday efficiency showed a tendency to increase, and the smaller the potential, the less hydrogen and formic acid production could be observed.(Figure 3.14)
When calculating the faradaic efficiency in previous studies, it showed about 20 to 30% comprehension and explained the remaining as loss. The faradaic efficiency of H2 was measured to be larger than that of previous papers, which means that less loss occurred in calculation of faradaic efficiency. It can be seen that our result was measured more accurately. Also, it detects the C4 product not reported in the existing paper, and its amount is 34.95% ~ 47.38%.
This discovered that the lost part could be C4 product.
52
Figure 3.14 Faradaic efficiency(%) of products from electrochemical reduction of liquid CO2 with different potential. Electrolysis was conducted with -2.5V, charge passed 200C.
potential H2 butanal MVK 2- butanone
Formic acid
Butanoic acid total
Cu_Pt
-2.5 41.46 14.94 12.26 1.49 11.62 11.63 93.4
-2.25 40.73 8.29 12.05 0.66 7.69 13.95 83.37
-2.0 29.46 13.96 14.72 0.78 3.72 10.26 72.9
Ni_Pt
-2.5 30.78 12.25 12.94 0.43 13.35 21.76 91.51
-2.25 28.16 12.20 18.60 0.66 10.68 14.12 84.42
-2.0 7.10 16.331 18.33 1.00 3.906 5.41 52.077
Table 3.4 Faradaic efficiency(%) of products from electrochemical reduction of liquid CO2 with different potential. Electrolysis was conducted with -2.5V, charge passed 200C.
53 3.2.3 Effect of water
An experiment was also conducted to investigate the effect according to the amount of water. Bulk electrolysis was carried out at -2.5 V by placing 0.5 ml and 2.5 ml of water of Cu electrode and Ni electrode, respectively.
Looking at Figure 3.15, we can observe that the amount of hydrogen generation increases as the amount of water increases, which means that the hydrogen evolution reaction has increased. This has the same meaning as the reason for not further increasing the amount of water from the optimization experiment. It is possible to reduce the hydrogen generation reaction competing with the carbon dioxide reduction reaction and to increase the efficiency of the reaction of carbon dioxide.
In the case of Cu electrode, C4 hydrocarbons tended to decrease as the amount of water increased, which indicates that water inhibited the CO2 reaction. Conversely, in the case of Ni electrode, C4 hydrocarbons tended to increase as the amount of water increased. In the case of Ni electrode, CO is adsorbed and interferes with the reaction of CO2, but it can be considered that H2O is adsorbed in that space, and the CO2 reduction reaction has progressed well.[31] Butanoic acid could not be observed as the amount of water increased.
It means that water interferes with the production of butanoic acid.
54
Figure 3.15 Faradaic efficiency(%) of products from electrochemical reduction of liquid CO2 with different amounts of water. Electrolysis was conducted with -2.5V, charge passed 200C.
H2 butanal MVK 2-
butanone Formic
acid Butanoic acid total
Cu_0.5ml 41.46 14.94 12.26 1.49 11.62 11.63 93.4
Cu_2.5ml 67.11 0 6.32 0.37 8.74 0 82.54
Ni_0.5ml 30.78 12.25 12.94 0.43 13.35 21.76 91.51
Ni_2.5ml 42.86 11.03 25.12 1.03 18.87 0 98.91
Table 3.5 Faradaic efficiency(%) of products from electrochemical reduction of liquid CO2 with different amounts of water. Electrolysis was conducted with -2.5V, charge passed 200C.
55 3.2.4 Effect of co-solvent
While observing the progress of the experiment, when we saw that the formation of C4 hydrocarbons was the main generation rather than the production of C2 and C3 product, we had to considered the reaction of ACN used for co-solvent. Therefore, in addition to ACN, we tried the experiment using N,N-dimethylformamide(DMF). As in the previous experiment, we used DMF as co-solvent, 20% in the cell, and advanced bulk electrolysis at -2.5 V.
Looking at Figure 3.16, in the experiment using DMF, no C4 product was observed, which tells us that ACN could react and produce C4 product.
Next, CV graph was drawn for ACN and DMF, respectively. (Figure 3.17) DMF shows a lower current density than ACN, but it is a current density that electrochemical reaction is possible. Considering the possibility of ACN reaction, DMF not reacting with CO2 It shows that a good co-solvent can be made.
Finally, when DMF was used, we conducted experiments according to the amount of water. Looking at Figure 3.18, the C4 product could not be observed regardless of the amount of water. Also, when the amount of water increases, the hydrogen production reaction increases, the production of hydrogen increases, and the amount of formic acid decreases. Thus, the hydrogen production reaction and the carbon dioxide reduction reaction are competitive.
56
Figure 3.16 Faradaic efficiency(%) of products from electrochemical reduction of liquid CO2 with different co-solvent. Electrolysis was conducted with -2.5V, charge passed 200C
H2 butanal MVK 2- butanone
Formic acid
Butanoic acid total
ACN_Cu 41.46 14.94 12.26 1.49 11.62 11.63 93.4
ACN_Ni 30.78 12.25 12.94 0.43 13.35 21.76 91.51
DMF_Cu 44.01 0 0 0 14.28 0 58.29
DMF_Ni 88.22 0 0 0 4.71 0 92.93
Table 3.6 Faradaic efficiency(%) of products from electrochemical reduction of liquid CO2 with different co-solvent. Electrolysis was conducted with -2.5V, charge passed 200C
57
Figure 3.17 Cyclic voltammetry of liquid CO2 with different co-solvent and different working electrode at 100mVs-1. Co-solvent was used 20% ACN and TBABF4(0.5M) electrolyte (a) Cu electrode (b) Ni electrode
58
Figure 3.18 Faradaic efficiency(%) of products from electrochemical reduction of liquid CO2 with different amounts of water using DMF co-solvent.
Electrolysis was conducted with -2.5V, charge passed 200C
H2 butanal MVK 2-
butanone Formic
acid Butanoic acid total
DMF_Cu_0.5ml 44.01 0 0 0 14.28 0 58.29
DMF_Cu_2.5ml 58.56 0 0 0 11.38 0 69.94
Table 3.7 Faradaic efficiency(%) of products from electrochemical reduction of liquid CO2 with different amounts of water using DMF co-solvent.
Electrolysis was conducted with -2.5V, charge passed 200C
59
Chapter 4. Conclusion
We produced a high pressure reaction vessel suitable for the experiment of liquid CO2. While decreasing the distance between the electrodes to 5 mm, the current density increased more than 10 times compared to the previous cell and the resistance decreased from 200 ohms to 15 ohms. Liquid CO2 observation is possible via window, and it is possible to analyze gas product using gas container.
The optimum conditions for the liquid CO2 experiment were obtained using the manufactured high pressure cell. It was optimized under various conditions such as amount of co-solvent, amount of water, counter electrode and working electrode. As a result, it was optimum when 20% of co-solvent and 0.83% of water were put, and Pt electrode was used for the counter electrode and Cu electrode and Ni electrode were used for the working electrode.
We conducted experiments under various conditions such as pressure, voltage, amount of water, co-solvent etc. In each case we could observe the C4
product, and we could observe that faradaic efficiency and selectivity change according to the conditions. In particular, C4 product which could not be found in the existing paper and higher H2 faradaic efficiency mean that accurate product measurement was done more than existing paper. Also, we discovered the possibility of ACN reaction by using DMF as a new co-solvent, and the
60
electric conductivity of DMF tends to be lower than that of ACN, but in the reaction of liquid CO2 in which the solvent does not react showed that DMF could be used with suitable co-solvent.
In this research, it is significant in terms of the research to react electrochemically by using high pressure and liquid CO2 in the electrochemical reaction of CO2, which has focused on improving the catalyst. Based on this research we expect to be able to develop new technology to make value-added hydrocarbon through electrochemical reaction using liquid CO2.