저작자표시-비영리-변경금지 2.0 대한민국 이용자는 아래의 조건을 따르는 경우에 한하여 자유롭게
l 이 저작물을 복제, 배포, 전송, 전시, 공연 및 방송할 수 있습니다. 다음과 같은 조건을 따라야 합니다:
l 귀하는, 이 저작물의 재이용이나 배포의 경우, 이 저작물에 적용된 이용허락조건 을 명확하게 나타내어야 합니다.
l 저작권자로부터 별도의 허가를 받으면 이러한 조건들은 적용되지 않습니다.
저작권법에 따른 이용자의 권리는 위의 내용에 의하여 영향을 받지 않습니다. 이것은 이용허락규약(Legal Code)을 이해하기 쉽게 요약한 것입니다.
Disclaimer
저작자표시. 귀하는 원저작자를 표시하여야 합니다.
비영리. 귀하는 이 저작물을 영리 목적으로 이용할 수 없습니다.
변경금지. 귀하는 이 저작물을 개작, 변형 또는 가공할 수 없습니다.
공학석사학위논문
3-D 미세격자 유동 패턴 도입에 따른 고분자전해질 연료전지 산소전달특성 분석
Effects of Using a 3-D Micro-lattice Flow Structure on Oxygen Transport Characteristics in the Cathode Medium of Polymer Electrolyte Membrane Fuel Cells
2017 년 8 월
서울대학교 대학원 기계항공공학부
이 규 상
3-D 미세격자 유동 패턴 도입에 따른 고분자전해질 연료전지 산소전달특성 분석
Effects of Using a 3-D Micro-lattice Flow Structure on Oxygen Transport Characteristics in the Cathode Medium of Polymer Electrolyte Membrane Fuel Cells
지도교수 민 경 덕
이 논문을 공학석사 학위논문으로 제출함
2017 년 7 월 서울대학교 대학원
기계항공공학부 이 규 상
이규상의 공학석사 학위논문을 인준함
2017 년 6 월
위 원 장 : (인)
부위원장 : (인)
위 원 : (인)
Abstract
Effects of Using a 3-D Micro-lattice Flow Structure on Oxygen Transport Characteristics in the Cathode Medium
of Polymer Electrolyte Membrane Fuel Cells
Guesang Lee Department of Mechanical and Aerospace Engineering The Graduate School Seoul National University
This work is primarily concerned with alleviating the concentration loss in Polymer Electrolyte Membrane fuel cells. One of the suggested solutions is utilizing a unique flow structure such as a 3-D micro-lattice flow pattern. A 3-D micro-lattice flow configuration is used to enhance the dynamic mechanisms of reactants and water removal capability, thus mitigating the overall transport resistance.
In this work, the measured oxygen transport resistances of two unit cells each assembled with a different flow pattern are quantitatively compared to understand the detailed transport mechanisms in the cathode diffusion media.
Conventionally, the oxygen transport resistance is obtained from analyzing the corresponding limiting current density. The calculated total resistance is segmented into different resistances induced by three transport mechanisms, which include molecular diffusion, Knudsen diffusion, and ionomer permeation.
By systematically varying the experimental conditions, the overall transport resistances of two different unit cells are measured and disintegrated. The resistance caused by the molecular diffusion is determined from varying pressure, while the ionomer permeation portion of the resistance is segmented by considering multiple relative humidity points, and the rest is considered to be induced by Knudsen diffusion.
When comparing the two sets of dissected measurements, the unit cell with the 3-D micro-lattice flow configuration showed a noticeably smaller resistance.
Additionally, the analyzed results showed that the molecular diffusion portion of the resistance is the most, if not only, responsible segment for the decrease in the overall resistance.
To understand the solitary change in the quantity, the flow rate was increased to identify the effect and presence of advection on the oxygen transport in the cathode medium. It is shown that the presence of advection is evident; as with the 3-D micro-lattice, the only change is shown in the molecular diffusion portion of the resistance, whereas the effect is absent with the parallel channel.
Keywords: Limiting Current Method, Advection, Oxygen Transport Resistance, 3-D Micro-lattice, Parallel channel.
Student Number: 2015-22718
Contents
Abstract ...v
List of Figures ... vi
List of Tables ... ix
Nomenclature ...x
Chapter 1. Introduction ...1
1.1 Background ... 1
1.2 Literature review ... 9
1.2.1 Oxygen transport mechanisms in the cathode medium of PEMFCs ... 8
1.2.1.1 Molecular diffusion……….….……….….11
1.2.1.2 Knudsen diffusion………...………..…….12
1.2.1.3 Ionomer permeation………..……….13
1.2.1.4 Advection………..……….………....14
1.2.2 Different types of flow structures... 15
1.2.2.1 Parallel channel……….……….17
1.2.2.2 Serpentine channel……….…………17
1.2.2.3 Interdigitated channel……….……18
1.2.2.4 Metal foam……….…………18
1.2.2.5 3-D micro-lattice flow structure……….………19
1.2.3 Measurement of oxygen transport resistance ... 19
1.3 Objective ... 21
Chapter 2. Utilizing advection: analyzing oxygen transport
resistance using limiting current method ... 23
2.1 Experiment setup ... 23
2.1.1 Modified experimental conditions ... 23
2.1.2 Fuel cell components ... 25
2.1.3 Fuel cell test station……….…….……...25
2.2 Limiting current method ... 33
2.2.1 Differentiating under/over-saturated region ... 34
2.2.2 Varying inert gas ... 35
2.2.3 Varying pressure ... 36
2.2.4 Varying relative humidity….. ... 37
2.2.4 Varying mass flow rate….. ... 38
2.3 Limiting current method results ... 46
2.3.1 Reduced oxygen transport resistance ... 46
2.3.2 Effects and presence of advection ... 47
Chapter 3. Conclusion ... 50
3.1 Summary ... 50
Bibliography ... 53
국 문 초 록 ... 57
List of Figures
Figure 1.1. Cross-section of a PEM fuel cell. Illustrating only the major
components [23]... 7 Figure 1.2. A schematic representation of advection in the diffusion media ... 8 Figure 1.3. (a) A schematic representation of diffusion mechanisms in the
cathode medium of PEM fuel cells, (b) Molecular diffusion occurring at components with relatively large pores, (c) Knudsen diffusion occurring at components with relatively small pores, (d) Ionomer permeation occurring at the ionomer film ... 10 Figure 1.4: Schematic representations of different flow field configurations. (a)
Parallel Channel (b) Serpentine Channel (c) Interdigitated Channel (d) Metal Foam ... 22 Figure 2.1 Modified bipolar plates to achieve uniform pressure and velocity
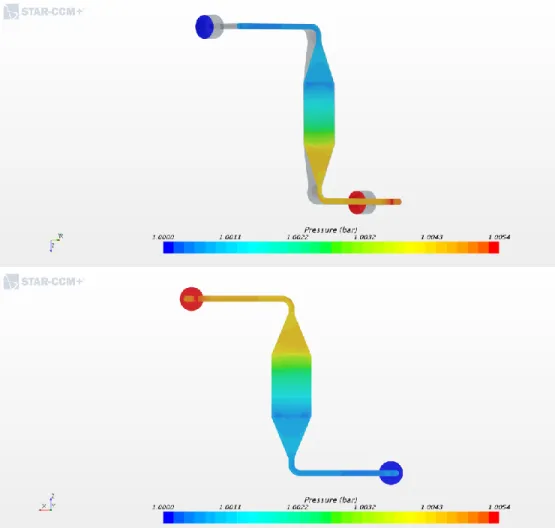
profiles at the reaction/active area. Manufactured after considering the computational fluid dynamic simulation results (a) Parallel channel. (b) 3-D Micro-lattice.. ... 29 Figure 2.2 Simulation results of the modified bipolar plates for pressure.
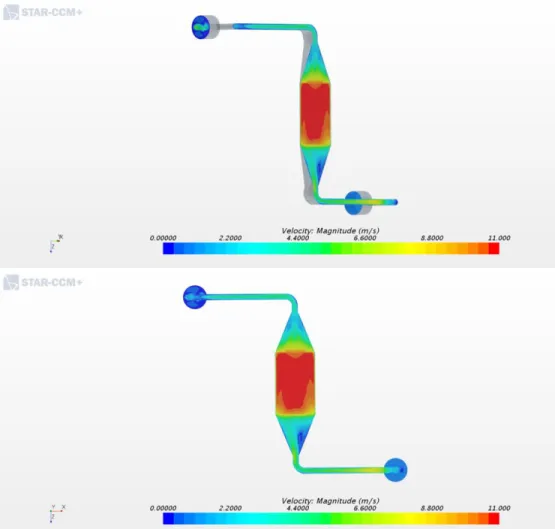
Showing just a slight pressure gradient in reaction area. ... 30 Figure 2.3. Simulation results of the modified bipolar plates for velocity.
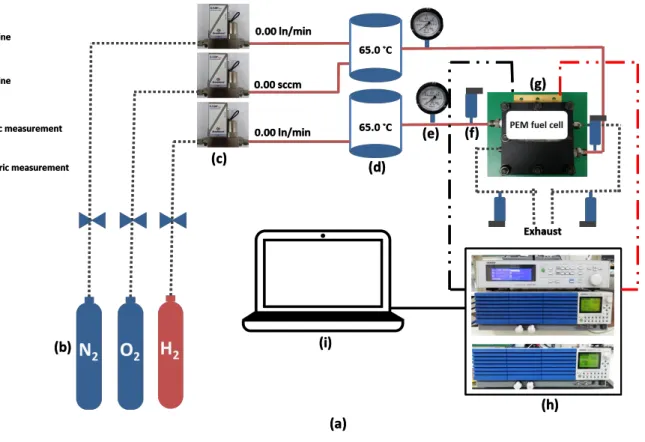
Showing a uniform velocity profile across the reaction area. ... 31 Figure 2.4. (a) A schematic of newly designed PEM fuel cell test station used to
conduct the experiments. (b) Dry reactant gases (c) Mass flow
controller (d) Membrane-type humidifiers (e) Pressure gauge (f) Pressure sensor (h) Electric Load and Impedance Spectroscopy... 32 Figure 2.5:A graphical representation of how to distinguish dry and wet regions
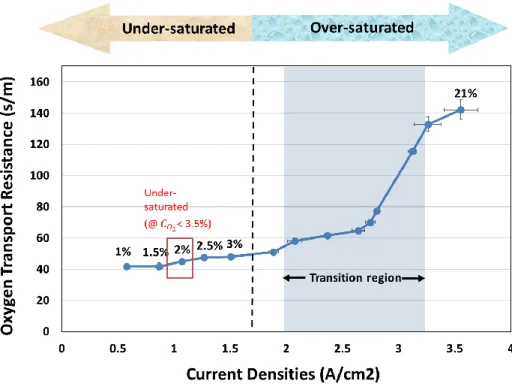
when operating PEM fuel cells. The limiting current densities each obtained with increasing oxygen concentration balanced with nitrogen gas plotted with respect to oxygen transport resistance values conducted at 2 bar, 100% relative humidity, reactants fed at 0.4 and 2.56 ln/min flow rate in the anode and cathode, respectively.
... 39 Figure 2.6: Experimental strategy used to distinguish the total resistance by
components ... 40 Figure 2.7: A schematic representation of no change in diffusion path when
switching the inert gas for the case with the parallel channel ... 41 Figure 2.8. A visual representation of the change in length of diffusion paths
dueto the different molecular weight and inertia ... 42 Figure 2.9. (a) Polarization curves of helium-oxygen mixture consistently
showing higher performance for all relative humidities with the parallel channel operated with 2% oxygen concentration fed at 2.59 ln/min flow rate at 1 bar. (b) Polarization curves of nitrogen-oxygen mixture showing slightly higher performance for 30% relative humidity when operated with the 3-D micro-lattice flow
configuration. ... 43 Figure 2.10. A graphical representation of the step where molecular diffusion
resistance is differentiated from the pressure independent terms. .... 44
Figure 2.11. A graphical representation of the step where the ionomer permeation portion of the resistance is differentiated from the
Knudsen diffusion resistance portion. ... 45 Figure 2.12. Segmented oxygen transport resistance, with the resistances
measured at 2 bar, 0.4 and 2.56 ln/min flow rate (a) 30% relative humidity, (b) 50% relative humidity, (c) 70% relative humidity, (d) 90% relative humidity. ... 48 Figure 2.13. Oxygen transport resistance measured with operating conditions of
2 bar, 70% RH, 1.28, 1.92, 2.56 ln/min flow rate. The decrease in the molecular diffusion portion of the resistance with respect to the increase in flow rate indicates the presence of advection in the substrate. ... 49
List of Tables
Table 2.1 Operating conditions for limiting current method ... 27 Table 2.2 Components used for the experiment ... 28
Nomenclature
Ai
surface area [m
2]
Ci
molar concentration [mol m
-3]
dpdiameter of pore [m]
Di
diffusion coefficient [m
2s
-1]
Dij
binary molecular diffusion coefficient [m
2s
-1]
FFaraday’s constant [96,485 C mol
-1]
i
current density [A m
-2]
K
permeability [m
2]
nd
K
Knudsen number [-]
Mi
molecular weight [g mol
-1]
ni
the number of molecules per unit volume [m
-3]
N i
molar flux rate per unit area [mol m
-2s
-1]
v
pw
saturated water vapor pressure [kPa]
P
pressure [kPa]
rh
relative humidity [-]
ri
molecular collision diameter [
Å]
R
universal gas constant [8.134 J mol
-1K
-1]
Sisolubility [mol cm
-3]
t
time [s]
T
temperature [K]
vi
diffusion volume [-]
Greek letters
transfer coefficient [-]
i
permeability [mol cm
-1s
-1]
i
overvoltage [V]
viscosity [m
2s
-1]
density [kg m
-3]
permeation coefficient [mol s
-1m
-1Pa
-1]
Subscripts and superscripts
PEM
polymer electrolyte membrane
Chchannel
ion
ionomer film
Knud
Knudsen diffusion
limvalue at limiting current
mtmass transport
MD
molecular diffusion
ORRoxygen reduction reaction
HORhydrogen oxidation reaction
Ptplatinum surface
Chapter 1. Introduction
1.1 Background
Now the global concern for the rapid change in climate is more eminent, numerous organizations and governments around the world are unified to mitigate the greenhouse gas emissions. Such unification has lead world leaders to form the world’s first comprehensive climate agreement such as the Paris climate accord [32-34]. According to the implementation, the accord [34] states that the participating countries will,
(a) Lower the average global temperature to below 2°C above pre-industrial levels, then once the initial target is met, it is promised to put extra effort on maintaining the global temperature below 1.5 °C above pre-industrial levels.
(b) Adapt to the adverse effects of climate change and participate in fostering climate resilience while promoting low greenhouse gas emissions development.
(c) Endorse fluidic financial support for low greenhouse gas emissions and climate-resilient development.
To meet the mentioned specifics, a demand for sustainable energy technologies is becoming more ubiquitous. Out of many sustainable energy technologies, fuel cells have gained a significant amount of attention as a new power source for automotive
vehicles and stationary/portable power supplies due to the characteristics of zero- emission and higher efficiency [1, 2]. In particular, the proton exchange membrane (PEM) fuel cell is known to be best suited for low operating temperatures (less than 80°C) and fast response to various load changes compared to other types of fuel cells.
As noticed by the recent release of fuel cell vehicles such as Honda Clarity and Toyota Mirai, the current trend of technological growth in fuel cells is optimistic, especially in the automotive industry. Nevertheless, it is still necessary to academically investigate and analyze the detailed engineering behind the technology for further improvement.
For a brief overview, a fuel cell is an electrochemical energy generator that converts the chemical energy of a fuel into electricity. In essence, by spatially separating the hydrogen and oxygen reactants, and transferring the reactants through the diffusion media, a fuel cell enables two electrochemical half reactions [23]:
H e
H2
2 2
(HOR) (1.1) OH e
H
O2 2 2 2
2
1 (ORR) (1.2)
Namely the hydrogen oxidation reaction (HOR) and oxygen reduction reaction (ORR). The hydrogen oxidation reaction is a phenomenon of a hydrogen molecule reacting at the catalyst to become two hydrogen ions and two electrons. The reactant is losing electrons thus the name oxidation reaction. After the oxidizing
agent is separated into two ions and electrons, while the electrons are forced to flow through an external circuit therefore constituting an electric current, the conducting ions transport through the electrolyte toward the catalyst located at the other side of the electrolyte. After arriving at the catalyst, the two hydrogen ions chemically combine with the previously separated products (hydrogen ions and electrons) to complete the reaction and become a water molecule.
As shown in figure 1.1, a typical PEM fuel cell is comprised of multiple components, where each element has a specific purpose for consistently facilitating electrochemical reactions. A thin sheet of Nafion® (thin polymeric)-electrolyte- based membrane is located at the very center of the cell, preventing the cell from short circuiting while successfully conducting ions. At the electrolyte, the electrodes are layered on top. For simplicity, the combination of the electrolyte and two electrodes or the membrane electrode assembly will be titled MEA throughout this paper. Gas diffusion layers (GDL) with Microporous layers (MPL) are placed on top of the electrodes with MPLs facing the electrodes. Key requirements for the GDL include, high electrical conductivity, high gas permeability, high stability/
corrosion resistance, enhanced water removal capability, and good durability. The MPL is placed in between the GDL and catalyst layer to improve the interaction between the GDL and the catalyst layer. Since a typical GDL has a large-scale porosity (10-30 μm) while the catalyst layer has a fine-scale porosity (10-100 nm), applying a compatible transition between the two components helps with inducing a smooth operation by refining the wicking of inauspicious liquid water and
decreasing the electrical contact resistance [3-5]. Lastly, the bipolar/graphite plates are placed at the outermost layer of the cell where the reactants and products enter and exit, respectively, to continue the transport process of reactants destined to electrochemically react at the catalyst layer and leave the system as water molecules.
In a conventional fuel cell, there are typically three types of losses. The first loss is called activation loss. The activation loss is most prominently controlled by the catalyst behaviors in the electrodes. The second loss is called Ohmic loss. As described earlier, because fuel cells involve the movement of ions and electrons, both electrical and ionic conductivities become imperative aspects when alleviating the overall performance loss. The last and third type of loss is called concentration loss. The concentration loss is the type of loss that can be controlled by changing the transport components of a fuel cell. Since, a fuel cell is an energy generating system where reactants have to be continually supplied, all the while removing produced liquid water, the transport process of the reactants become vital for the enhancement of power generation [23].
ion Concentrat Ohmc
Activation
fuelcell
(1.3)The most effective way of decreasing the concentration loss portion of the energy loss is resolved either by inducing smooth reactant transport from the gas distributor to the catalyst layer or by avoiding flooding. Konno et al. suggested using the 3-D micro-lattice flow field designed by Toyota, which minimizes the
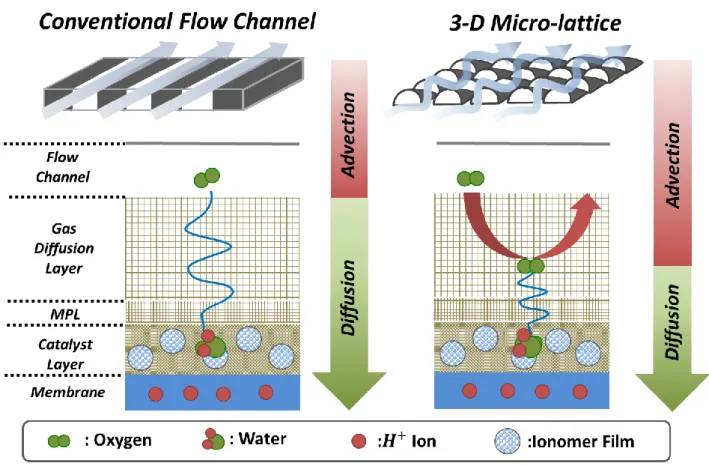
concentration loss by simultaneously enhancing oxygen transport in the diffusion media and improving water removal capability [6, 36]. Enhanced oxygen transport can be achieved by decreasing the concentration gradient induced by multiple transport resistances. As shown in figure 1.1, in the case of adopting a 3-D Micro- lattice flow field, the oxygen transport resistance is reduced by directly guiding air toward the catalyst layer and promoting oxygen diffusion in the diffusion media by using forced convection. Also, a combination of optimized geometry and surface wettability is adopted to draw produced water at the membrane to the back surface of the 3-D micro-lattice flow field [6, 36].
While there are several publications claiming the clear benefits of using a 3-D micro-lattice flow field, no specific results have been empirically shown to provide evidence toward the claims maintained by Konno et al. [6, 36]. Therefore, this paper puts particular emphasis on providing accurate information proving the existence and effects of forced convection in the substrate.
There are a couple of ways to empirically analyze the performance change in the concentration loss region. The easiest and one of the most conventional method is by obtaining a steady-state polarization curve. The other method, which is a bit more rigorous and requires a higher understanding of experimental procedures is called the limiting current method. While the former method is generally sufficient enough to only compare the performance of different cells, the latter method is far more favorable towards understanding the detailed oxygen transport phenomenon.
Therefore, numerous authors have chosen the latter method to qualitatively and
quantitatively understand the oxygen transport behaviors in the cathode diffusion media [7, 19-22, 25]. The measured limiting current values are used to separate the oxygen transport resistance into individual components. Data of separated resistances are useful for either figuring out the incompatible component/material in an assembled fuel cell or comparing fuel cells made out of different components.
The main body of this paper starts with an explanation of oxygen transport mechanisms in the cathode of PEM fuel cells. The strategy of using limiting current method for this research is shown and the method is thoroughly described with the explanation of theory supporting each step. The experimental section describes the experimental materials, equipment, and the conditions used to conduct this research.
The differences in oxygen transport mechanisms occurring with the 3-D micro- lattice is briefly explained to emphasize the reasons behind the change in resistance.
The measured and segmented resistances will be shown to show the existence of advection as well as the quantitative effect of advection on the total resistance to prove the benefits of utilizing a 3-D micro-lattice flow structure in PEM fuel cells.
Figure 1.1 Cross-section of a PEM fuel cell. Illustrating only the major components [23]
Figure 1.2 A schematic representation of advection in the diffusion media
1.2 Literature review
1.2.1 Oxygen transport mechanisms in the cathode medium of PEMFCs
As illustrated in figure 1.3. When the oxygen gas travels across the bipolar plate or flow distributor, the gas chronologically diffuses through the substrate, microporous layer, and catalyst layer, then when it arrives at the ionomer film, the oxygen gas has to permeate to reach the reaction zone. With a conventional flow structure, the transition of oxygen transport to the catalyst typically involves three different types of transport mechanisms: molecular diffusion, Knudsen diffusion, and ionomer permeation. While the three aforementioned transport mechanisms are permanent with certain shapes of flow distributors; seldom, a bulk of oxygen molecules can be forced into the diffusion media with the motion appearing as advection with unique flow structures. It is known that the forced convection helps with the transport rate of oxidants by possibly reducing the diffusion length [6, 13, 14, 26]. By understanding these transport mechanisms in the cathode medium of PEM fuel cells, many combinations of different components can be optimally designed and arranged to enhance the fuel cell performance. Therefore, it is imperative to have thorough comprehension of the behaviors of oxygen molecules in different flow structures to minimize the energy loss caused in the diffusion medium.
Figure 1.3 (a) A schematic representation of diffusion mechanisms in the cathode medium of PEM fuel cells, (b) Molecular diffusion occurring at components with relatively large pores, (c) Knudsen diffusion occurring at components with relatively small pores, (d) Ionomer permeation occurring at the ionomer film.
1.2.1.1 Molecular diffusion
Diffusion is a transport process where molecules travel from a region of higher concentration to that of a lower region. The movement ceases, once the concentrations of two regions are equal, but in the case of PEM fuel cells, the oxidants are continuously reacted which makes the concentration at the catalyst lower than that at the flow channel. This change in concentration is what drives the transport phenomena in the diffusion media. Having said that, molecular diffusion is one of the transport mechanisms caused by the change in concentration. In gas diffusion layers, the pore size is large enough for the molecules to collide allowing the interaction between the molecules to become dominant. Therefore, as shown in equation (1.4), when oxygen molecules diffuse through the components with large pores such as the gas diffusion layer, the intermolecular interaction causes the diffusion to be influenced by the molar weight of the inert gas and pressure [24].
1.75
1/3 1/3 2
0.001 1 1
( )
ij
i j
i j
D T
M M
P v v (1.4)
Where Dij is the binary diffusion coefficient, (v1i/3 v1j/3)1/2 is the collision diameter, Mi and Mj are molecular weight of the two molecules. P for pressure and T for temperature. From following equation (1.4), the portion of the total oxygen transport resistance attributable to the molecular diffusion can be determined in two idiosyncratic ways. First, by comparing the measured oxygen transport resistance
of nitrogen-oxygen and helium-oxygen mixtures. Second, by varying the total pressure. The formal method is taking advantage of the fourfold difference between the binary diffusion coefficients, and the latter is exploiting the inverse-linear dependence of the binary diffusion coefficients on pressure.
1.2.1.2 Knudsen diffusion
When oxygen molecules diffuse through the components with relatively small pores, the molecules are likely to interact with the pore wall unlike molecular diffusion. Therefore, when the pore size is relatively small, one of the transport mechanisms called Knudsen diffusion predominates. With Knudsen diffusion, the transport of the molecules is independent of pressure and the type of inert gas [27].
8 3
pi
i
d RT
D M
(1.5)2 d
O n
d
pK
(1.6)To figure out which component corresponds to which transport mechanism, Knudsen number can be calculated. Knudsen number is the ratio of the oxygen gas mean free path to the pore diameter of each component as shown in equation (1.6).
For instance, molecular diffusion corresponds to Knudsen number smaller than 0.1.
While, Knudsen diffusion corresponds to Knudsen number higher than 10. When
Knudsen number is in between 0.1 and 10, it is presumed to be a combination of both molecular and Knudsen diffusions [28, 29]. By using these relations, Oh et al.
identified that the gas diffusion backing layer or the substrate is mostly dominated by molecular diffusion, while the microporous layer is a combination of both molecular and Knudsen diffusion with 8 to 2 ratio, and the catalyst layer by Knudsen diffusion. [22]
1.2.1.3 Ionomer permeation
The final step before the oxygen gas to reach the catalyst is the permeation segment. The catalyst layer is comprised of platinum agglomerates covered with ionomer film made out of polymer chains. The polymer chains are designed to support the platinum/carbon mixtures to stay in position while attracting hydrated protons coming from the anode side of the fuel cell. However, before entering the ionomer film, oxygen molecules must overcome the potential barrier formed by van der waals force, which is generated by the close range of intertwined polymer chains [9]. Once oxygen enters the skin of the ionomer film, it dissolves then diffuses through the film toward the catalyst. Therefore, the complete permeation process involves both diffusion and dissolution.
i
D S
i i
(1.7)As shown in equation (1.7), since permeability is product of diffusion coefficient and solubility, when the cell’s relative humidity increases, the diffusion
coefficient increases because the increase in water content improves the flexibility of the film and causes the Nafion® to swell [8-11]. The swelling increases the distance between the polymer chains, thus decreasing the van der waals force and increasing the diffusion coefficient. In essence, increasing the cell’s relative humidity helps the oxygen molecules to permeate through the ionomer film without affecting the other mechanisms.
Considering the sensitivity of relative humidity on ionomer permeation, the described relation in the previous paragraph can be expressed as the following equation [7, 35],
1)]
15 . 323 ( 1 200 , exp[17 )]
( 28 . 1 exp[
10 27 .
3 15
, , , 2
T RH R
H D
A ion
A ion O
ion
(1.8)
As illustrated in equation (1.8), the permeation coefficient which is depicted as
,O2
ion
is a function of relative humidity and temperature. Furthermore, the relative humidity term is in an exponential form, meaning the permeability of the ionomer film can be controlled by varying relative humidity.
1.2.1.4 Advection
Advection is the transport of a substance by bulk motion. Since advection requires currents in the fluid, in PEM fuel cells, advection will most likely happen
in the flow channel and at regions where the pore size is large enough for gas molecules to transport in bulk. Advection is typically described using the partial differential equation [30].
0 )
(
t u (1.9)
Where the divergence operator, and u is the velocity vector field. Following equation (1.9), and assuming the flow is incompressible, since the only variable that advection is contingent upon is the velocity term, the concentration gradient in the bulk motion is nearly negligible which makes it accurate to postulate that concentration is uniform within the bulk motion.
1.1.1 Different types of flow structures
Seeing how evident the use of different flow structures can decide the improvement or drawback in a PEM fuel cell, one of the most important aspects to be considered when assembling an efficient fuel cell is choosing the most compatible flow structure. In general, flow structures serve two primary purposes.
First, to efficiently supply reactant gases and remove products. Second, to collect the electricity generated by the fuel cell. While the electrical resistance is a liability with the overall fuel cell performance, because the focus of this paper is on the characteristics of oxygen transport characteristics, the discussion of improved electrical conductivity will not be covered in this paper.
There are numerous geometrical variables to control when designing the most compatible flow structure. For instance, the shape, size, and pattern of flow structures are a few variables that can significantly affect the performance of the fuel cell. Thus, choosing the right geometry for the optimal flow pattern is critical for properly operating PEM fuel cells. Because PEM fuel cells generate liquid water, poorly designed flow plates can leave certain areas flooded to the point of obstruction for the reactant gases to reach the catalyst layer. When severely clogged, not only does the fuel cell lose efficiency, but also becomes prone to irreversible voltage damage because of cell polarity locally reversing in gas-starved regions, causing corrosion and degradation [12]. Therefore, the most ideal flow structure has the ability to efficiently transport reactant gases while withdrawing adverse liquid water out of the system.
To meet those standards, numerous authors have investigated the effects of utilizing different flow field configurations. Empirically speaking, one of the most efficient way of improving the overall performance is by prolonging the tail of the I-V Curve. Thus the elongation of the tail or the concentration loss dominant portion of the I-V curve is the primary objective for many PEM fuel cell developers.
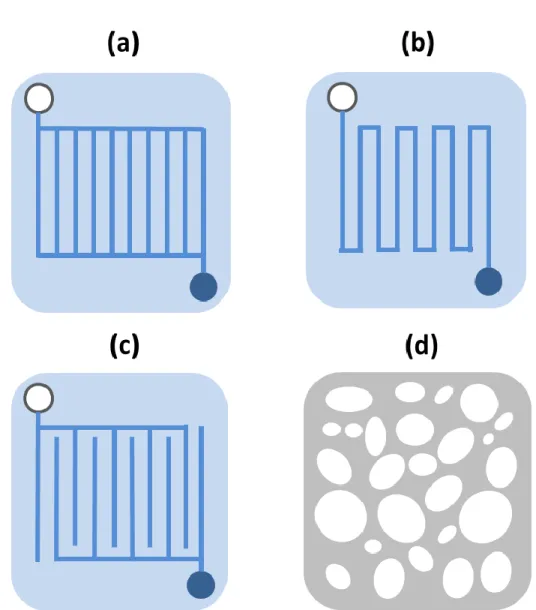
Although a wide variety of flow structures are used for research, the most ubiquitous flow channel geometries include: parallel, serpentine, interdigitated, and metal foam, where each has its own advantages and disadvantages.
1.2.2.1 Parallel channel
With a parallel channel, reactants evenly enter and exit the flow channel because of its simple configuration as shown in figure 4 (a). Due to the uniform flow of the reactants in the parallel channel, there is a significant advantage of having a low pressure drop across the inlet and outlet. However, there is a noticeable drawback when the width of the flow channel is relatively wide. The wide width of the channel causes the water to buildup, increasing the likelihood of the flooding inside the diffusion media.
1.2.2.2 Serpentine channel
A Serpentine channel is one of the most widely used flow configurations that are utilized in portable fuel cells. Unlike that of the parallel channel, the biggest advantage of the serpentine channel lies in the water removal capability. As viewed in figure 4 (b), because the reactants travel across a few number of designated paths along the bipolar plate, the produced water is easily removed from the channel. On the other hand, a small number of channels lead to a large pressure drop across the flow channel. Meanwhile the pressure drop does lead to an extra energy loss, it is not always unfavorable as the induced pressure gradient causes forced convection through the gas diffusion layer, reducing the length of the diffusion layer.
1.2.2.3 Interdigitated channel
As shown in figure 4 (c), the interdigitated design has a very unique configuration. Analogous to the serpentine channel creating forced convection through the diffusion layer, by purposely disconnecting the channel running through the inlet from that of the outlet, the interdigitated channels create a flow field that penetrates through the diffusion media. Such design improves the mass transport, and has been researched and utilized by numerous researchers to understand the trade-offs between the performance increase resulting from the forced convection versus the energy loss caused by the significant pressure drop [13-14].
1.2.2.4 Metal foam
While the previously explained bipolar plates all had channels as the component to initiate the reactant distribution, a metal foam is a design that is used to utilize high porosity. Moreover, whereas the channels use graphite as the main material, the metal foams are a result of liquids solidifying with the dispersed gas bubbles during the manufacturing process to maintain the morphology with the objective of creating naturally shaped flow paths [15-18]. According to Kumar et al, having high porosity is also known to help with creating a more uniform current density distribution compared to that of the channel designs [17, 18].
1.2.2.5 3-D Micro-lattice flow structure
Exploiting the benefits of the previously mentioned flow structures, Toyota designed an idiosyncratic flow distributor that uses a three dimensional micro- lattice configuration. As mentioned earlier in section 1.1, Konno et al. described the 3-D micro-lattice structure as a quintessential design that promotes enhanced oxygen transport with forced convection by directing reactants straight into the diffusion media, all the while drawing adverse liquid water to the back surface of the 3-D Micro-lattice flow field with induced capillary pressure by having relatively low porosity [6, 36].
1.1.2 Measurement of oxygen transport resistance
When a fuel cell can no longer sustain higher current density due to the reactant concentration falling to zero at the catalyst, the obtainable current density during this operating condition is called the limiting current density [23]. The limiting current density is obtained when the provided oxygen is depleted at the catalyst.
Therefore, the measured limiting current densities are accurate indication of how efficiently oxygen molecules transport through the diffusion media to the catalyst.
With this postulate, numerous authors have explored the use of limiting current measurements to analyze gas transport resistance at the cathode in PEM fuel cells under various experimental conditions [7, 19-22, 25, 31]. For instance, Baker et al.
used limiting current values to separate the oxygen transport resistance into
individual components by varying pressure [25]. Greszler et al. measured limiting current to analyze the effect of cathode platinum loading on oxygen transport resistance [31]. Nonoyama et al. obtained liming current measurements to distinguish the contributions of each resistance responsible for different transport mechanisms [7]. Oh et al. separated the total oxygen transport resistance into different components in detail by measuring limiting current densities of oxygen molecules balanced with either nitrogen or helium gas.
When converting obtained limiting current density to oxygen transport resistance, equations (1.10) and (1.11), as well as two underlying assumptions are used to derive the conversion equation (1.12). Before deriving the conversion equation, it is necessary to preview two underlying assumptions. The first assumption postulates that the oxygen transport rate is equal to the oxygen consumption rate at the steady- state condition. As shown in equation (1.10), the oxygen transport rate is equal to the concentration difference of oxygen in the gas distributor,COGD
2 , and the oxygen concentration at the platinum where the reaction occurs, COPt
2 , over the total transport resistance. By using faraday’s law, the consumption rate is described as equation (1.11). The second assumption states that the oxygen concentration at the platinum is completely depleted, equating to zero at limiting current density. Under the first postulate, the oxygen transport rate and the oxygen consumption rate can be equated then with the second postulate, equation (1.12) can be derived.
) 1 (
2 2 2
2, .
Pt O GD total O
O trans
O C C
N R (1.10)
F N i
react
O 4
lim . ,
2 (1.11)
lim
) (
4
22 R T i
p r P x
R F
v w h dry
FD total O
O
(1.12)
Eventually, by using equation (1.12), the measured limiting current densities can be converted into oxygen transport resistance.
1.2 Objective
As mentioned in section 1.2.2.5, if 3-D Micro-lattice configuration does produce all the benefits that Konno et al. claimed in the papers [6,7], the discoveries will most certainly bring about a paradigm shift in our understanding of how PEM fuel cells work. However, the earlier publications on the usage of 3-D micro-lattice lack the evidence that supports the reasoning of the increase in performance. Therefore, the objective of this research was to empirically prove the aforementioned advantages by using limiting current method for decomposing the overall oxygen transport resistance into the associated transport mechanisms.
Figure 1.4 Schematic representations of different flow field configurations. (a) Parallel Channel (b) Serpentine Channel (c) Interdigitated Channel (d) Metal Foam
Chapter 2. Utilizing advection: analyzing oxygen
transport resistance using limiting current method
2.1 Experiment Setup
2.1.1 Modified experimental conditions
Unlike other fuel cell experiments, limiting current method requires a high stoichiometry along with uniform pressure and velocity profiles to simplify interpretation of the experimental data. For simplification, there are primarily three requirements for limiting current method:
1. Stoichiometric Ratios (SR) are required to be kept high to minimize reactant depletion along the channels
2. The active area of the cell needs to be kept small to reduce down-channel pressure losses.
3. Uniform pressure and velocity profiles are needed to maintain identical experiment conditions.
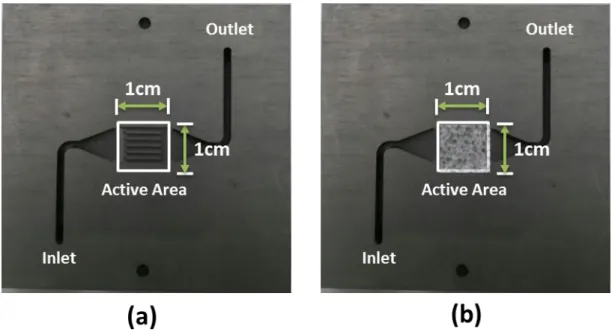
To satisfy the above requirements and to successfully identify the effect of using the 3-D micro-lattice on oxygen transport mechanisms, a 1 cm2 parallel channel and an identical bipolar plate with an empty 1cm2 slot for the installation of 3-D micro-
lattice flow distributor were designed and manufactured. The minimized active area, mechanically satisfied the first and second requirement. Moreover, with the help from a colleague, Junghyun Kim, a computational fluid dynamics simulation was conducted using Star CCM+. The results, as shown in figures 2.2 and 2.3, showed a uniform pressure and velocity profile across the flow field. The uniformity across the reaction area guaranteed the second and third requirement of using the limiting current method.
Oxygen concentration was balanced at 2% with nitrogen gas to assure any undesired product (liquid water) from impeding the oxygen gas from reaching the catalyst. It was shown that keeping oxygen concentration at 2% prevents the produced water from condensation or ensuring the water molecules to leave the cell in vapor form even at limiting current [19-22].
The inlet gas relative humidity was varied from 30% to 90% with a 20%
increment to analyze the effect of relative humidity on the oxygen transport resistance. Temperature was kept at 65℃. The mass flow rate and pressure were proportionally varied for each experiment. Installing the 3-D micro-lattice showed a change in pressure between the inlet and outlet caused by its low porosity; thus to accurately establish a consistent experimental condition, the initiating pressure for the case of 3-D micro-lattice was kept at 1.25 bar.
PLZ 664WA electric load was used to ramp down the voltage from 1.0V to 0.05V with a 19 mV/s rate. The I-V measurement was conducted after keeping the
open circuit voltage for 1 minute. After the measurement, a 3 minute dry nitrogen purge at a rate of 2.00 ln/min was engaged to clean out the remaining reactants and ensure the repeatability of the experiment.
2.1.1 Fuel Cell components
As depicted in Table (2.2), the gas diffusion layers were manufactured and provided by JNTG. A commercialized product called JNT30-A3 was used. JNT30 indicates the type of substrate and the thickness, while the second part after the dash represents the name of the microporous layer. For the MEAs (Membrane Electrode Assembly) GORE™ PRIMEA® M735 was used. Teflon gaskets were used to prevent the fuel and oxidants from crossing to the unwanted regions. Two cells were assembled with varying flow structures while the other components were kept unchanged.
2.1.2 Fuel Cell test station
As shown in figure 8, a new fuel cell test station was built to obtain flexible control over the operating conditions. The red gas supply lines indicate that the gas supply lines are equipped with heaters. Three mass flow controllers were installed to accurately control the flow rate of three different reactants, two pressure gauges to control the pressure inside the fuel cell, and seven temperature sensors were installed to accurately control the temperatures of reactants before entering the fuel cell. The seven temperature sensors include: one sensor for the cathode side of the fuel cell, two sensors for the pre-heating gas supply line located behind the
humidifiers, two sensors for the humidifiers, two sensors located at the front of the humidifiers, and two sensors for reactant gases right before entering the fuel cell.
Two pressure sensors located at the inlets and the other two sensors located at the outlets of the fuel cell. Two membrane-type humidifiers were used over the bubbler-type humidifiers for higher accuracy in controlling the humidity level inside the fuel cell. Since this specific experiment is temperature and humidity sensitive, the following conditions were meticulously carried out to maintain the most accurate outcome.
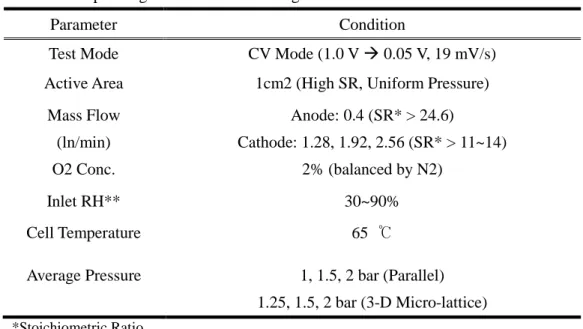
Table 2.1. Operating conditions for limiting current method
Parameter Condition
Test Mode CV Mode (1.0 V 0.05 V, 19 mV/s)
Active Area 1cm2 (High SR, Uniform Pressure) Mass Flow
(ln/min)
Anode: 0.4 (SR* > 24.6)
Cathode: 1.28, 1.92, 2.56 (SR* > 11~14)
O2 Conc. 2% (balanced by N2)
Inlet RH** 30~90%
Cell Temperature 65 ℃
Average Pressure 1, 1.5, 2 bar (Parallel) 1.25, 1.5, 2 bar (3-D Micro-lattice)
*Stoichiometric Ratio
**Relative Humidity
Table 2.2 Components used for the experiment
Component Condition
Flow Distributor Parallel/ Parallel or 3-D Micro-lattice (Anode/ Cathode)
GDL- MPL JNT30-A3 (Thickness 320 ±5 μm)
MEA† GORETM PRIMEA® M735‡
†Membrane Electrode Assembly
‡Catalyst Coated Membrane
Figure 2.1 Modified bipolar plates to achieve uniform pressure and velocity profiles at the reaction/active area. Manufactured after considering the computational fluid dynamic simulation results (a) Parallel channel. (b) 3-D Micro-lattice
Figure 2.2 Simulation results of the modified bipolar plates for pressure. Showing just a slight pressure gradient in reaction area.
Figure 2.3 Simulation results of the modified bipolar plates for velocity. Showing a uniform velocity profile across the reaction area.
Figure 2.4 (a) A schematic of newly designed PEM fuel cell test station used to conduct the experiments. (b) Dry reactant gases (c) Mass flow controller (d) Membrane-type humidifiers (e) Pressure gauge (f) Pressure sensor (h) Electric Load and Impedance Spectroscopy.
2.2 Limiting current method
The limiting current method is a potentiostatic technique that obtains the indicated current densities at the end of the polarization curves. In other words, it is an empirical way of creating a condition where the reactant concentration in the catalyst layer is completely depleted. Theoretically, when no remaining reactants exist at the catalyst layer, the fuel cell is no longer able to produce a higher current density thus the name limiting current density. With the right types of experimental conditions, the limiting current method is a powerful experimental technique that is typically used to understand the transport phenomenon inside the cathode medium.
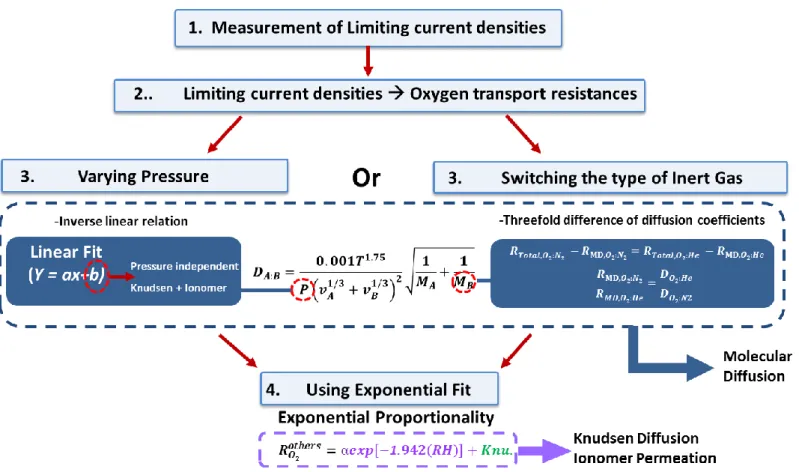
As listed in figure 5, first the limiting current densities were measured using an electric load; then the measured limiting current densities are converted into oxygen transport resistance values using equation (1.12). Following the theorems and formulas explained earlier in section 1.2.1 on oxygen transport mechanisms, the total resistance caused by the transport of oxygen molecules in the cathode medium can be distinguished individually. For instance, for a conventional flow structure such as a parallel channel, the overall transport resistance can be dissected into molecular and Knudsen diffusion induced resistance and ionomer permeation portion of the resistance [7, 19-22, 25]. Following the binary diffusion coefficient formula or equation (1.4), the molecular diffusion portion of the resistance can be quantitatively determined either by using a linear fit or by equating the ratio of the molecular diffusion part of the resistance and the ratio of the diffusion coefficients of both nitrogen-oxygen and helium-oxygen mixtures. Eventually, with an
exponential fit, the remaining resistance values can be quantitatively distinguished into the Knudsen diffusion and ionomer permeation portion of the resistance. The objective of this experiment was to analyze the differences in oxygen transport resistance and mechanisms; therefore, the strategy listed in figure 2.6 was repeated for two types of unit cells, assembled with different flow structures.
2.2.1 Differentiating under/over-saturated regions
As mentioned earlier, in PEM fuel cells, liquid water can either be advantageous or disadvantageous. Beneficial since the electrolyte or membrane does require water to improve the ionomer permeation portion of oxygen transport. Additionally, the water molecules located at the anode side of the fuel cell become hydroniums (H3O+) once combined with the hydrogen ions to act as an extra transport mechanism within the membrane. However, in this case, the water molecules are helping by enhancing the ionic conductivity, which has no significant relation to the oxygen transport*. On the contrary, detrimental when condensed water blocks the passage of the reactants to the catalyst. Such effects caused by the water molecules make this method a capricious experiment. Therefore, it is imperative to distinguish the dry and wet operating regions before conducting a condition sensitive experiment such as the limiting current method. As illustrated in figure 9, when the oxygen concentration is increased, the electrochemical reaction increases, which in other words means the current density increases. As the current density increases, at a certain point, the steady increase in the oxygen transport resistance becomes capricious as seen in the transition region. It is also noticeable that both the current
density and oxygen transport resistance become unsteady in the transition region because when enough water molecules are produced to accumulate, the effect of condensation is unpredictable or something that cannot be easily controlled. In essence, the under/over-saturated regions were accurately separated by observing the behaviors of oxygen transport resistance with respect to the increase in oxygen concentration and the decision to use two percent oxygen concentration was cleared for the dry operation.
2.1.2 Varying inert gas
As shown in equation (1.4), by taking advantage of the fourfold difference in binary diffusion coefficients of nitrogen-oxygen and helium-oxygen mixtures, several authors measured and segmented the molecular diffusion induced resistance by noticing the difference in calculated resistance when balancing oxygen with nitrogen and helium gas [7,22]. This method is perfectly applicable for conventional flow structures such as serpentine and parallel channels since the length of the diffusion path is independent from the type of inert gas as indicated in figure 2.7. However, when utilizing a 3-D micro-lattice flow structure, since the molecular weight and radius of a nitrogen gas are noticeably larger than those of a helium gas, the inertia picked up by the nitrogen-oxygen mixture from the forced convection is considerably bigger, making the diffusion path of the nitrogen–
oxygen gas is shorter than that of the helium-oxygen mixture. In other words, as shown in figure 2.9 (a), while with the parallel channel, the performance of a fuel cell with the helium-oxygen mixture is better than that with the nitrogen-oxygen
mixture for all relative humidities, because of the inertia created by advection, the diffusion path of different molecules is contingent upon the molecular weight with the 3-D micro-lattice flow configuration. Figure 2.9 (b) confirms that at 30%
relative humidity, the polarization curve of the nitrogen-oxygen mixture shows better performance than that with the helium-oxygen mixture. Meanwhile, when relative humidity is increased, the glacial decrease in the length of the gap between the nitrogen-oxygen and helium-oxygen mixture is submerged, where the helium- oxygen mixture eventually shows slightly better performance at 60% relative humidity. In essence, the difference in length of the diffusion path makes the method of varying inert gas inapplicable because with the 3-D micro-lattice flow structure, the fourfold difference in binary diffusion coefficients is no longer admissible with the different diffusion lengths. Refer to figure 2.8 for a visual explanation.
2.1.3 Varying pressure
Considering that the method of varying inert gas is no longer applicable for the cell assembled with the 3-D micro-lattice flow structure, the alternative method of using the change in pressure is the most accurate way of decomposing the molecular diffusion portion of the resistance. As described earlier in section 1.2.1.1, the pressure term is in the denominator of the binary diffusion coefficient equation, making the pressure term inverse-linearly proportional. Following this co- dependence, the molecular diffusion portion of the resistance can be segmented by varying pressure with respect to a proportionate increase in mass flow rate to
compensate for the increase in density when increasing pressure. The linearly increasing resistance with respect to increasing pressure is shown in figure 8.
The resistance caused by the pressure independent transport mechanisms such as the Knudsen diffusion and ionomer permeation can be determined from the y- intercept value obtained from the linear fit as shown in figure 8. Furthermore, since the y-intercept represents the resistance induced by Knudsen diffusion and ionomer permeation, the molecular diffusion portion of the resistance is the value calculated from the total resistance minus the value of the y-intercept.
2.1.4 Varying relative humidity
After the pressure independent transport portion of the resistance is distinguished from that of the molecular diffusion segment, the Knudsen diffusion and ionomer permeation part of the resistance can be dissected by varying the relative humidity. As mentioned in section 1.2.1.3, the ionomer permeation is the only transport mechanism that is influenced by the change in relative humidity;
thus by using the exponential relation shown in equation (1.8), the Knudsen diffusion and ionomer permeation related resistances are separated using the exponential fit. The constant -1.942 was empirically determined from the cells with various gas diffusion layers and under different operating pressures. The first exponential term in the equation in figure 2.11 indicates the ionomer permeation resistance, and the second constant corresponds to the Knudsen diffusion resistance.
2.1.5
Varying mass flow rateAccording to Konno et al, as a result of forced convection, the oxidants are directed toward the catalyst layer presumably decreasing the diffusion path and promoting the oxygen transport [6, 36]. To confirm this hypothesis, the mass flow rate was varied from 1.28 to 2.56 ln/min. Due to the intrinsic behavior of advection explained in section 2.1.4, the only condition the change in mass flow rate will effect is the velocity of the bulk motion in the flow structure as well as the substrate part of the gas diffusion layer where the average pore size is relatively larger.
The higher flow rate will allow the reactants to penetrate deeper due to higher inertia and the molecular diffusion portion of the total resistance will be decreased with the increase in mass flow rate.
Figure 2.5 A graphical representation of how to distinguish dry and wet regions when operating PEM fuel cells. The limiting current densities each obtained with increasing oxygen concentration balanced with nitrogen gas plotted with respect to oxygen transport resistance values conducted at 2 bar, 100% relative humidity, reactants fed at 0.4 and 2.56 ln/min flow rate in the anode and cathode, respectively.
Figure 2.6 Experimental strategy used to distinguish the total resistance by components
Figure 2.7 A schematic representation of no change in diffusion path when switching the inert gas for the case with a
Figure 2.8 A visual representation of the change in length of diffusion paths due to the different molecular weight and
Figure 2.9 (a) Polarization curves of helium-oxygen mixture consistently showing higher performance for all relative humidities with the parallel channel operated with 2% oxygen concentration fed at 2.59 ln/min flow rate at 1 bar. (b) Polarization curves of nitrogen-oxygen mixture showing slightly higher performance for 30% relative humidity when operated with the 3-D micro-lattice flow configuration.
Figure 2.10 A graphical representation of the step where molecular diffusion resistance is differentiated from the pressure independent terms.
Figure 2.11 A graphical representation of the step where the ionomer permeation portion of the resistance is differentiated from the Knudsen diffusion resistance portion.
2.3 Limiting Current Method Results
2.3.1
Reduced oxygen transport resistanceBy using the strategy listed in figure 2.6, the oxygen transport resistances of both the parallel channel and 3-D Micro-lattice flow structure were measured and distinguished. As shown in figure 2.12, for all relative humidities which were 30, 50, 70, and 90%, the molecular diffusion portion of the transport resistance decreased by approximately 53~57% when replacing the parallel channel with the 3-D micro-lattice flow configuration; whereas, the other two associated resistances remained about the same. This was predicted as the 3-D micro-lattice uses advection to improve the transport of oxygen molecules, and advection, as mentioned in section 1.2.1.4, makes the molecules to move in bulk.
The bulk motion is evidently only permissible in the components with a relatively large pore size; therefore, as proven by numerous authors through using the limiting current method, the molecular diffusion is mostly present in the substrate part of the GDL [7, 19-22, 25], which in case with the results shown in figure 2.12, the 3-D micro-lattice is mostly if not only effective at helping the reactants to transport in advection, or shortening the length of the diffusion path.
As both Oh et al. and Nonoyama et al. stated in their papers, increasing the relative humidity decreases the ionomer permeation portion of the resistance [7, 22].
Again, this is due to the increase in the diffusion coefficient with respect to the
increase in relative humidity. While the ionomer permeation associated resistance decreased almost by 70% when the inlet relative humidity was changed from 30%
to 90%, the decrease in molecular diffusion induced resistance is presumed to be the result of forced convection helping the oxygen molecules to penetrate through the substrate.
2.3.2
Effects and presence of advectionThe oxygen transport resistances were measured additionally at three different mass flow rates to identify the presence of advection. While the total resistance and the proportions of the resistances associated with different transport mechanisms when using the parallel channel remained approximately the same; when the 3-D micro-lattice flow structure was utilized, the total oxygen transport resistance decreased by about 8 percent per 0.64 ln/min increase in flow rate. The results shown in figure 17 clearly indicates the presence of advection, since the only associated portion that decreased was the molecular diffusion induced resistance;
whereas, the change in resistance was not present for the case with the parallel channel. This result also indicates that forced convection or advection is only present in the molecular diffusion related components, which will most likely be the substrate part of GDL.
Figure 2.12 Segmented oxygen transport resistance, with the resistances measured at 2 bar, 0.4 and 2.56 ln/min flow rate (a) 30% relative humidity, (b) 50% relative humidity, (c) 70% relative humidity, (d) 90% relative humidity
Figure 2.13 Oxygen transport resistance measured with operating conditions of 2 bar, 70% RH, 1.28, 1.92, 2.56 ln/min flow rate. The decrease in the molecular diffusion portion of the resistance with respect to the increase in flow rate indicates the presence of advection in the substrate.
Chapter 3. Conclusion
3.1 Summary
The objective of this research was to provide scholastic information on the benefits of using a 3-D micro-lattice in PEM fuel cells. It was claimed that the use of a 3-D micro-lattice increases the overall performance of a PEM fuel cell by alleviating the concentration loss. To identify the reasons behind the decrease in the concentration loss, an experimental technique typically used to measure the oxygen transport resistance called the limiting current method was conducted.
To satisfy the experimental conditions described in section 2.1.1, several unique bi-polar plates were simulated and designed. With the help from a colleague, whose specialty is in the computational fluid dynamics, uniform velocity and pressure profiles at the one by one active area was guaranteed before the manufacturing process. It was the modified design that satisfied all of the three preliminary requirements. Again, the three requirements emphasize the importance of keeping high Stoichiometric Ratios, while creating a uniform pressure and velocity profiles for creating the steadiest experimental condition.
Before initiating the experiment, it was imperative to understand the oxygen transport mechanisms as the overall resistance can be segmented into corresponding mechanisms by controlling the experimental conditions. As utilized by numerous authors, one of the most common ways to segment the molecular
diffusion portion of the resistance is by varying two types of inert gas [7, 19, 22];
however, when operating a PEM fuel cell with a 3-D micro-lattice configuration, because of the dependence of diffusion path on the molecular weight, it is more reliable and accurate to use the inverse linear relation of the pressure term in the binary diffusion coefficient equation. As an addition to supporting the advice to use the change in pressure instead of the type of inert gas, a graph showing a higher value of limiting current density at 30% relative humidity when using the nitrogen- oxygen mixture versus the helium-oxygen mixture was shown in figure 2.9 (b). It was also illustrated that the increase in relative humidity does affect advection, as it was depicted from figure 2.9 (b) that the limiting current density value for the helium-oxygen mixture eventually was higher than that with the nitrogen-oxygen mixture.
After conducting the limiting current method, it was shown that the only portion responsible for the decrease in oxygen transport resistance was the molecular diffusion segment of t
![Figure 1.1 Cross-section of a PEM fuel cell. Illustrating only the major components [23]](https://thumb-ap.123doks.com/thumbv2/123dokinfo/11517502.0/22.774.131.641.145.688/figure-cross-section-pem-fuel-illustrating-major-components.webp)
