저작자표시-비영리-변경금지 2.0 대한민국 이용자는 아래의 조건을 따르는 경우에 한하여 자유롭게
l 이 저작물을 복제, 배포, 전송, 전시, 공연 및 방송할 수 있습니다. 다음과 같은 조건을 따라야 합니다:
l 귀하는, 이 저작물의 재이용이나 배포의 경우, 이 저작물에 적용된 이용허락조건 을 명확하게 나타내어야 합니다.
l 저작권자로부터 별도의 허가를 받으면 이러한 조건들은 적용되지 않습니다.
저작권법에 따른 이용자의 권리는 위의 내용에 의하여 영향을 받지 않습니다. 이것은 이용허락규약(Legal Code)을 이해하기 쉽게 요약한 것입니다.
Disclaimer
저작자표시. 귀하는 원저작자를 표시하여야 합니다.
비영리. 귀하는 이 저작물을 영리 목적으로 이용할 수 없습니다.
변경금지. 귀하는 이 저작물을 개작, 변형 또는 가공할 수 없습니다.
공학석사학위논문
특이 스펙트럼 템플릿 비교를 통한 전류 잔차를 이용한
산업용 로봇 기어박스 고장감지
Fault Detection of Gearbox in Industrial Robot using Current Residual
from Singular Spectrum Template Matching
2022년 2월
서울대학교 대학원
기계공학부 김 도 완
특이 스펙트럼 템플릿 비교를 통한 전류 잔차를 이용한
산업용 로봇 기어박스 고장감지
Fault Detection of Gearbox in Industrial Robot using Current Residual
from Singular Spectrum Template Matching
지도교수 윤 병 동
이 논문을 공학석사 학위논문으로 제출함
2021년 10월
서울대학교 대학원
기계공학부
김 도 완
김도완의 공학석사 학위논문을 인준함
2021년 12월
위 원 장 : 김 윤 영 (인) 부위원장 : 윤 병 동 (인) 위 원 : 김 도 년 (인)
Abstract
Fault Detection of Gearbox in Industrial Robot using Current Residual
from Singular Spectrum Template Matching
Dowan Kim Department of Mechanical Engineering The Graduate School Seoul National University
Industrial robots are essential equipment for process automation in a wide range of industrial fields. In manufacturing fields, unexpected faults of robots can severely damage the economy of a company. Fault can occur in various components of the robot and a faulty gearbox can have a significant effect on the robot's driving performance and manufactured product. Therefore, in this paper, gearbox fault detection of an industrial robot is performed using current signals applied to the actuating motor.
The proposed method synchronizes normal current signal data to reference phase by resampling through Hilbert Transform. The synchronized signals are then split by singular value decomposition, and the principal components are extracted and averaged to establish normal template. Residual signal is then extracted by subtracting normal template from synchronized unknown signal. Finally, health management feature is calculated from the residual signal to perform fault detection. To quantify the performance of the proposed method, an evaluation metric ‘detection error’ is derived. The results of detection error show that the uncertainty of fault detection is declined through the proposed method.
The distribution of health feature using proposed method is more concentrated than that of health feature using time synchronous averaging without the normal template.
Keywords: Industrial robot Gearbox fault detection Current signal
Normal Template
Singular spectrum analysis Student Number: 2020-25803
Table of Contents
Abstract……….i
Chapter 1 Introduction………1
1.1 Motivation……….………1
1.2 Dissertation Layout………...………3
Chapter 2 Theoretical Backgrounds………4
2.1 Characteristic of Current Signal in Fault Diagnosis of Industrial Robot………4
2.2 Hilbert Transform………..…..5
2.3 Singular Spectrum Analysis………6
Chapter 3 Proposed Method………..11
3.1 Signal Synchronizing………12
3.2 Establishing Normal Template & Fault Detection using Residual Signal………13
Chapter 4 Experimental Validation………...15
4.1 Data Description………...15
4.1.1 Testbed Setup……….…15
4.1.2 Acquired Data………17
4.2 Result & Discussion………..18
Chapter 5 Conclusion & Future Work……….22
References………23
국문 초록……….25
Chapter 1
Introduction
1.1 Motivation
Recently around the world, factors like risk of manufacturing, work complexity, and labor costs are increasing steeply. Thus, it is becoming more important to replace human resources by industrial robots in the actual manufacturing site [1]. These industrial robots are used in various fields, such as automobiles, aerospace and semiconductor manufacturing, which are becoming increasingly significant as the size of related industry grows and precision requirement rises [2],[3]. If failure or fault of industrial robots occur during the manufacturing process, product quality will be reduced, and downtime of the manufacturing line will be increased and result in large economic loss. To avoid this circumstance, minimizing the downtime loss is essential, and many studies and investigations about fault detection methods of industrial robots have been carried out recently.
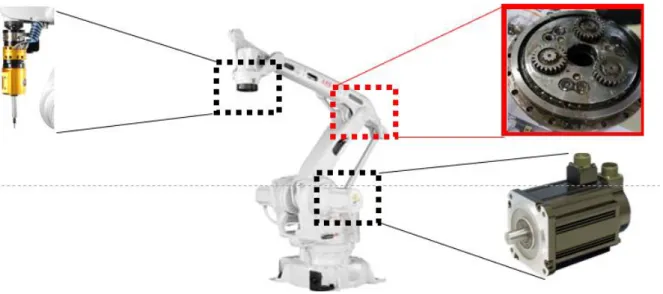
As in Figure 1, industrial robots consist of various elements, including reducers, motors, sensors, end-effectors, links, and transmissions. The mechanical failure of the robot occurs frequently in the reducer, which is a key to the transmission of the power of the actuator
Figure 1 Various components of industrial robot
[4]. Thus, the fault of the reducer can have a significant impact on the performance of the industrial robot. Existing fault detection studies of industrial robot reducers can be divided into two main types by applied signal: methods using vibration signals and methods using current signals. In the first type, vibration signal, Y.Kim detected fault of gearbox using Phase-based time-domain averaging (PTDA) for fault detection of a gearbox [5]. Jaber proposed a fault diagnosis algorithm through vibration signal decomposition using discrete wavelet transform (DWT) for gearbox backlash diagnosis [6]. Pan et al. detected joint backlash fault of an industrial robot, and the Wigner-Vile distribution (WVD) and artificial neural network (ANN) algorithm is used for health feature extraction and fault detection [7]. In the second type, current signal, Algburi et al. performed fault detection using rotary encoder signal [8]. Zhang et al.
proposed method of failure diagnosis of the reducer using the Hidden Markow Model.
Additionally, Li et al. performed robot reducer fault diagnosis by combining Motor Current Signal Analysis (MCSA) and deep learning.
According to the investigations mentioned above, vibration signals are suitable for detecting mechanical failures, for example, checking sideband of gear mass frequency.
However, acquiring suitable vibration signal data is difficult because the attenuation of mechanical vibration can be occurred according to the attached points of vibration sensors.
Additionally, acquired vibration signals are likely to be contaminated by noise occurred from the operation of industrial robot or outer factors. In contrast, current sensors can be installed easily in the control box of the robot, and robust to the outer noise.
One of the main fault modes of the gearbox is deterioration, which increases rest of the frequency components except for the operating frequency of the motor. Therefore, extracting principal component of the signal is important. Additionally, industrial robots operate under various operating motion profiles, so frequency elements depending on operating profiles should be normalized. The method presented in this paper is establishing normal template by extracting principal components along various motion profile and condition. Then health management feature is calculated from extracted residual signal. Residual signal is calculated by subtracting acquired current signal from normal template signal. Also, the proposed method reduces the variance of the robot's operating status in a current signal by normalizing the extracted feature according to the motion profile.
1.2 Dissertation Layout
Including this section, this paper is organized with 5 sections. Section 2 provides background theoretical knowledge for the proposed method. Then section 3 of this paper describes the proposed method. Section 4 shows experimental validation and according discussion. Section 5 summarizes the whole work of this paper and shows future works.
Chapter 2
Theoretical Backgrounds
2.1 Characteristic of Current Signal in Fault Diagnosis of Industrial Robot [9]
In industrial robot, most faults result from deterioration of the mechanical components due to usage over time because industrial robots are controlled in factory environments and operated by trained technicians. The mechanical components of industrial robot are electromechanically connected within the overall system, so deterioration of those components generates frequency and amplitude modulation. The according torque signal transmitted to the motor can be expressed as:
𝑇(𝑡) = 𝑇0(𝑡) + ∑ 𝑇𝑛(𝑡) cos [∫ 2𝜋𝑓𝑛(𝑡)𝑑𝑡 + 𝛷𝑛(𝑡)]
𝑁
𝑛=1
𝑇𝑛, 𝑓𝑛, 𝛷𝑛, and 𝑇0 denote the amplitude, frequency, phase of torque signal induced by the
oscillatory vibrations, and the average torque. In the industrial robot motion control, the modulated frequency and torque information can be used to transmit control signals to the actuator. Therefore, the acquired current signal will be affected by this modulation of the sending signal. The single-phase modulated current signal can be denoted as:
𝐼(𝑡) = 𝐼𝑐(𝑡) sin [∫ 2𝜋𝑓𝐶(𝑡)𝑑𝑡]
𝑓𝑐(t), and 𝐼𝑐(t) denotes the fundamental frequency of the current signal, and the amplitude of 𝑓𝑐(t).
Two main points to consider during fault detection of industrial robot using current signal are as follow. First point is the fault-related frequency components of 𝑓𝑛. The second one is the oscillatory terms of the current amplitude 𝐼𝑐(t).
2.2 Hilbert Transform [10]
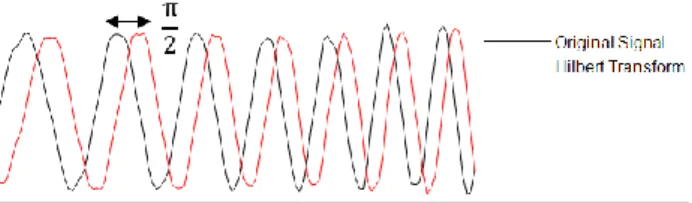
The Hilbert Transform was first introduced by David Hilbert in order to manage a special case of the Riemann–Hilbert problem for analytic functions. The Hilbert transform is a specific linear operator in the field of mathematics and signal processing. In the frequency domain, the Hilbert Transform can be particularly representated into simple form. As in the Figure 2 below, the HT shifts every frequency component as 𝜋
2 radians. This signal processing technique is significant because the result of transformation is a component of the analytic
representation of a real-valued signal.
Figure 2 Phase shifting of the Hilbert Transform
The mathematical definition of explicit form of Hilbert Transform 𝐻(𝑢) is denoted as follows:
𝐻(𝑢) = 1
𝜋∫ 𝑢(𝜏) 𝑡 − 𝜏𝑑𝜏
+∞
−∞
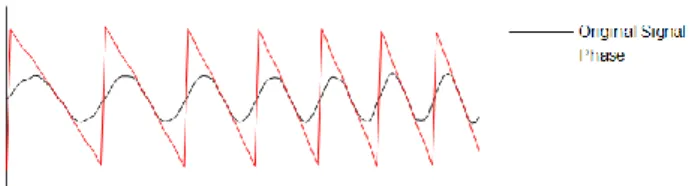
Figure 3 below shows the original signal and the according phase calculated by the Hilbert Transform. In chapter 3, this technique is used for signal synchronizing to match the phases of the current signals.
Figure 3 Phase of original signal calculated by the Hilbert Transform
2.3 Singular Spectrum Analysis
Singular spectrum analysis is a robust method for the investigation of non-fixed and
nonlinear signal, and applied to cyclic movement identification in numerous fields such as death series analysis, climatic time series examination, and geophysical trend extraction [8].
This technique decomposes a complex signal into trend, noise and oscillations. Considering that industrial robots are operated in various motion profiles and conditions, SSA is suitable to extract faulty components from intricated signal by diminishing the effect of principal component related to the fundamental frequency of moving robot.
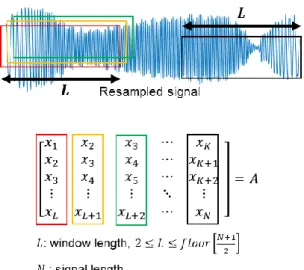
SSA consists of two main processes, decomposition and reconstruction. First, in the decomposition progress, the trajectory embedded matrix is constructed from the single-phase motor current signal. As in the Figure 4 below, N-length current signal is divided by L-length window. The window strides through the signal point by point, and finally the size of 𝐿 ∗ (𝑁 − 𝐿 + 1) trajectory matrix A is constructed.
Figure 4 Construction of trajectory embedded matrix
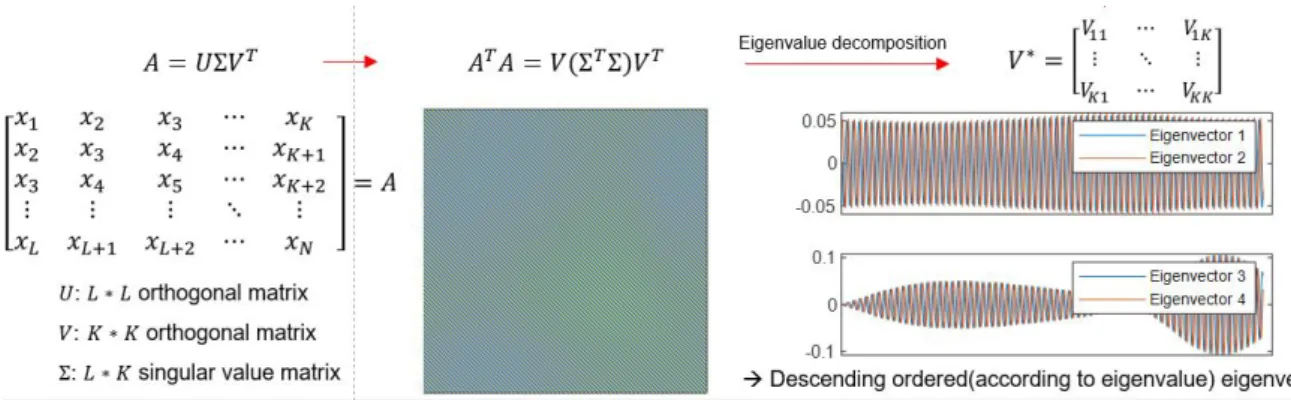
Subsequently, Singular Value Decomposition is implemented to the trajectory
embedded matrix to obtain eigenvectors. Figure 5 shows the process of singular value decomposition. First, square orthogonal matrix is calculated by multiplying transposed trajectory embedded matrix 𝐴𝑇 to the trajectory embedded matrix 𝐴 itself. Then eigenvalue decomposition can be performed to get singular value matrix 𝛴, and eigenvector matrix 𝑉∗. Eigenvector matrix consists of descending ordered eigenvectors according to the magnitude of corresponding singular value.
Figure 5 Process of singular value decomposition
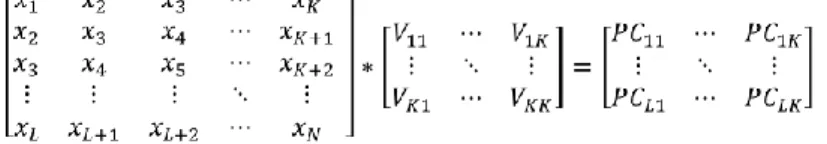
Next process is the final step of decomposition process. Principal component matrix is derived by multiplying trajectory embedded matrix and eigenvector matrix, and corresponding calculation is as follows:
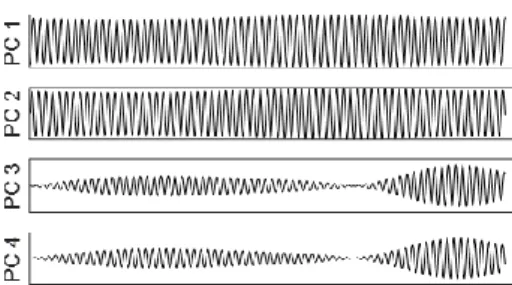
Figure 6 below is the visualization of each principal component vector of 1st to 4th largest singular value. However, length of these principal vectors is not identical to the original signal
length N. Therefore, restoration of L-length principal components into N-length vectors, the second main process of SSA must be undergone.
Figure 6 Visualization of each principal component vector of 1st to 4th largest singular value
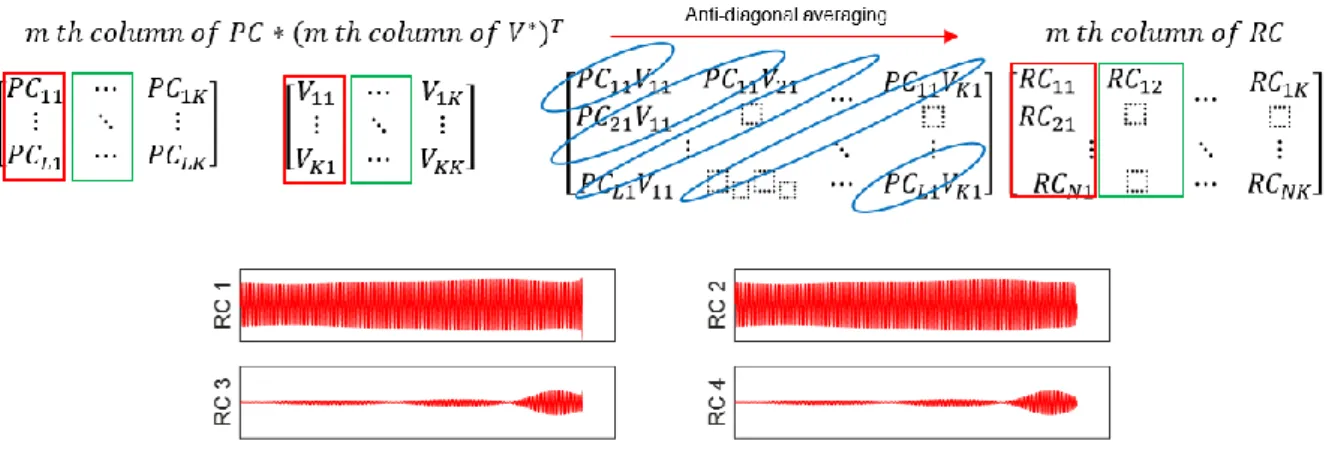
In order to recreate the identical items, anti-diagonal averaging of corresponding vectors of principal component matrix and eigenvector matrix is performed. As in Figure 7, 𝑚𝑡ℎ column of principal component matrix and 𝑚𝑡ℎ column of eigenvector matrix is multiplied first. Then anti-diagonal averaging is done with the resultant matrix, then the 𝑚𝑡ℎ column of N-length reconstructed principal component matrix is finally driven.
Figure 7 Reconstruction progress and reconstructed principal components
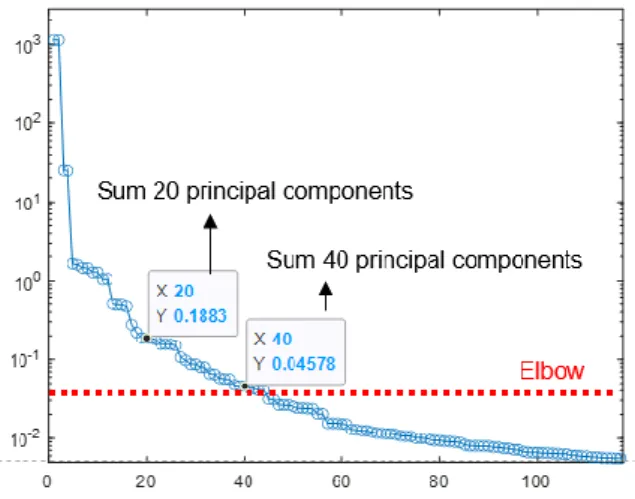
These reconstructed principal components are selected through the singular value setting threshold ‘elbow’ in Figure 8. The chosen reconstructed vectors have eigenvector magnitude above the elbow, and considered as significant component related to the driving frequency of industrial robot. These vectors above the elbow are added up to establish normal template.
Figure 8 Singular value setting threshold: elbow
Furthermore examination about essential SSA can be found in [11].
Chapter 3
Proposed Method
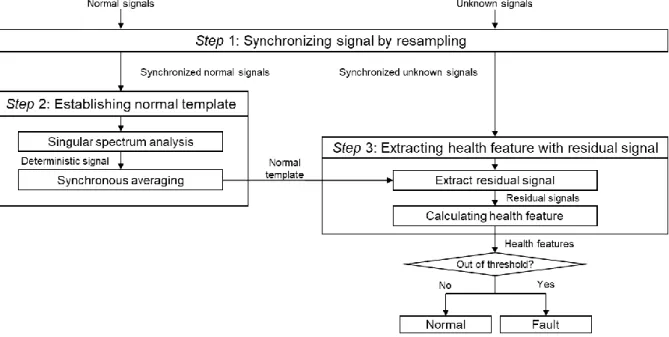
Figure 9 Overall flowchart of the proposed method
Figure 9 above is the overall flowchart of the proposed method, consists of 3 steps.
First step is synchronizing signal by resampling. This process is necessary to correctly extract residual signal by phase matching. Next is the key part of the proposed method, establishing normal template. Singular spectrum analysis is mainly performed to extract deterministic signal
from current signals of various motion profile and condition. The last step is extracting health feature with residual signal and detecting fault with the result. Unknown signal is synchronized through step 1, and residual signal is extracted with this synchronized unknown signal and normal template. Then health feature is calculated from extracted residual signal and fault detection is finally performed. The below subsections describe process of each step thoroughly.
3.1 Signal Synchronizing
To extract residual signal correctly, signal synchronizing must be performed to match the phases of reference signal of normal template and unknown signal. Due to the monotonous characteristic of current signal, Hilbert Transform can be applied to extract the phase of the particular signal.
Figure 10 Signal synchronizing through Hilbert Transform
Figure 10 shows the conceptual plot of signal synchronizing through Hilbert Transform. First, the reference phase is set to match all the signal data in the same phase. Blue signal is original signal, and it is linearly interpolated according to the reference phase. The number of points of the reference phase is determined by the average number of points in single sinusoidal cycle. This average number of points is calculated by dividing the number of all the
points in the data with the number of sinusoidal cycles in the data.
The Figure 11 below shows normal current signals before and after of the signal synchronizing. Before resampling, the signals are roughly synchronized through autocorrelation. However, the phase is not completely matched and this will cause the extraction of unsuitable residual signal in the subsequential processes. Resampling through Hilbert transform matches phases among signals finely, and the result is shown in Figure 11.
Figure 11 Normal current signal before resampling & after resampling
3.2 Establishing Normal Template & Fault Detection using Residual Signal
Through the singular spectrum analysis, the principal component is extracted and the normal template is established through the corresponding motion and speed level.
Figure 12 Conceptual view of normal template and the process of fault detection
Figure 12 is the conceptual view of normal template and the process of fault detection. An input signal of unknown health status, known working condition (motion, speed level) is acquired.
The signal is resampled following the reference phase of corresponding working condition.
Then, the normal template of the same condition is selected, then the residual signal is calculated by subtracting the normal template from the resampled input signal. Subsequently, root-mean-squared value of the residual signal is derived. RMS is a health feature widely used in indicating fault severity. As the overall degradation is frequently occurred fault mode of gearbox in industrial robot, RMS is suitable health feature to check fault severity of the gearbox due to the ascent of required torque.
Chapter 4
Experimental Validation
4.1 Data Description
The following subsections describe about settings and speculation of industrial robot testbed and the acquired data.
4.1.1 Testbed Setup
Figure 13 (a) Industrial robot testbed of Hyundai Robotics (YS 080) (b) Fault RV gear specimen acquired from actual manufacturing line (c) Fault RV gear specimen acquired from
accelerated life test
Figure 13 (a) is the six-axis industrial robot testbed of Hyundai Robotics used for data acquisition. To imitate the end-effector, a payload of 80kgf is attached to the end of the testbed.
As shown in Figure 13 (b) and (c), we used a total of two faulty RV gear specimen. The former one is acquired from actual manufacturing line, denoted as Fault 1 (or Small), and the latter one is obtained from accelerated life test, denoted as Fault 2 (or Aged). Additionally, the fault severity of Fault 2 is higher than that of Fault 1.
Data used in this paper is the input current signal to the 4th axis actuator. The current signal data is obtained with a sampling frequency of 2048Hz by attaching hall sensors (Figure 14 (a)) to each of the electrical wires (Figure 14 (b)) linked to the 4th axis actuator.
Figure 14 (a) Hall-sensor (b) Electric wires of actuating motors
Figure 15 below is the overall schematic view of data acquisition system. Hall sensor is attached to the electric wires between the industrial robot testbed and controller box. Then the acquired signal is collected by DAQ and finally saved into PC.
Figure 15 Schematic view of data acquisition system
4.1.2 Acquired Data
Status Motion Speed
Normal Fault1 (Small)
Fault2 (Aged)
Axis 4 20%, 60%, 100%
Axis 4 & 5 20%, 60%, 100%
Spotwelding 20%, 60%, 100%
Table 1 Categories of acquired data
The categories of the acquired data are shown in Table 1 above. Motion ‘Axis 4’ means single-axis motion operating only the 4th axis, while motion ‘Axis 4 & 5’ means operating the 4th axis and the 5th axis simultaneously. Motion ‘Spotwelding’ is implementation of the robot through the welding motion profile which is used in the actual manufacturing line. All the data is acquired in 3 different speed levels. The speed level 100% denotes the maximum speed of the testbed can perform under corresponding motion profile.
4.2 Results & Discussion
Figure 16 Overall fault detection process: Time synchronous averaging without normal template (yellow shaded part) vs. Propose method (grey shaded part)
The Figure 16 above is the overall process of the fault detection of 2 methods. The yellow shaded part is time synchronous averaging without using normal template, and the grey shaded part is the proposed method of this paper. In both methods, 20% of normal signal data is selected randomly through 100 iterations to set reference signal in each motion and speed condition. In each iteration, RMS values of residual signals are derived from the rest 80% of Normal data, 100% of Fault 1 data, and 100% of Fault 2 data. Then the RMS values are
averaged within each health index (Normal, Fault 1, Fault 2). Finally, the 100 averaged RMS values in each health index are fit into the gaussian distribution. This fitting processes are performed for 3 motion profiles and 3 speed levels.
Figure 17 4 randomly calculated RMS values of single iteration in 4&5 motion case
Figure 17 shows 4 randomly calculated RMS values of single iteration in 4&5 motion case, and this process is repetitively performed along 100 iterations.
Figure 18 Visualization of the evaluation metric
Figure 18 above is visualization of the evaluation metric, detection error. This metric is defined in this paper to show the performance of the proposed method. The definition of detection error is the probability of overlapped area of gaussian distributions of different health index.
Figure 19 Distribution of RMS values of speed level 100%, Axis 4 motion using (a) time synchronous averaging (b) proposed method
Figure 19 is the result of RMS value distribution in speed level 100%, Axis 4 motion. Result of this operating condition is particularly selected to check the obvious performance improvement of the proposed method, where the overall results of whole operating condition can be confirmed in Table 2. As in Figure M, the detection error is declined when applying the proposed method. The detection error is declined due to the diminish of uncertainty by using normal template to extract residual signal.
Figure 20 Distribution of RMS values of speed level 60%, Axis 4 & 5 motion using time synchronous averaging & proposed method
In Table 2, result of the proposed method in case of speed level 60%, Axis 4&5 motion is inferior to other speed level. However, concerning Figure 20, it can be confirmed that the distance of the distribution among health indices is already far enough, and detection error of both methods is small. Therefore, the change of detection error is not obviously observed after using the proposed method.
Axis 4 Axis 4&5 Spotwelding
Speed 20% 6.7 1.8 7.13
Speed 60% -0.14 0.11 0.43
Speed 100% 6.3 2.83 2.5
Table 2 Average magnitude of detection error decrease of all case
Chapter 5
Conclusion & Future Work
In this paper, the fault detection method of industrial robot gearbox is proposed. Signal synchronizing through resampling and singular spectrum analysis are applied to establish normal template. Additionally, an evaluation metric, detection error is introduced to confirm the performance of the proposed method.
The contribution of this study can be summarized in following ways. First, this paper introduces overall framework of fault detection in industrial robot gearbox. Next, the uncertainty problem of fault detection in industrial robot gearbox is enhanced through extracting fundamental frequency components related to each operating condition of robot.
Finally, by applying preset normal template, users of industrial robots can simply detect fault of gearbox in industrial robot just by synchronizing the acquired signal, extracting residual signal, and calculating RMS value.
In the future work, this study will be performed the comparison study of different eigenvalue threshold in singular spectrum analysis.
References
[1] A. Grau, M. Indri, L. Bello and T. Sauter, "Industrial robotics in factory Automation: From the early stage to the Internet of things", Proc. 43rd Annu. Conf. Ind. Electron. Soc. IECON, pp. 6159-6164, 2017.
[2] K. Eguchi, Q. Wu, Y. Liu, C. Wu, T. Chen, An overview of current situations of robot industry development, ITM Web Conf., 17 (2018)
[3] C. Park, K. Park and D. Gweon, "Development of industrial dual arm robot for precision assembly of mechanical parts for automobiles", 2006 SICE-ICASE International Joint Conf, pp. 3059-3062, Oct. 2006.
[4] Zhang, J., & Song, W. (2020, October). Physics-of-Failure based Model for Industrial Robot Reliability Prediction. In 2020 IEEE International Conference on Mechatronics and Automation (ICMA) (pp. 729-734). IEEE.
[5] Kim, Y., Park, J., Na, K., Yuan, H., Youn, B. D., & Kang, C. S. (2020). Phase-based time domain averaging (PTDA) for fault detection of a gearbox in an industrial robot using vibration signals. Mechanical Systems and Signal Processing, 138, 106544.
[6] A.A. Jaber, R. Bicker Industrial robot backlash fault diagnosis based on discrete wavelet transform and artificial neural network Am. J. Mech. Eng., 4 (1) (2016), pp. 21-31
[7] M.-C. Pan, H. Van Brussel, P. Sas Intelligent joint fault diagnosis of industrial robots Mech.
Syst. Sig. Process., 12 (4) (1998), pp. 571-588
[8] Algburi, R. N. A., & Gao, H. (2019). Health assessment and fault detection system for an industrial robot using the rotary encoder signal. Energies, 12(14), 2816.
[9] Cheng, Fangzhou, et al. "High-accuracy unsupervised fault detection of industrial robots using current signal analysis." 2019 IEEE International Conference on Prognostics and Health Management (ICPHM). IEEE, 2019.
[10] https://en.wikipedia.org/wiki/Hilbert_transform
[11] Golyandina, N.E.; Zhigljavsky, A. Singular Spectrum Analysis for Time Series; Plenum Publishing Corporation: New York, NY, USA, 2011; pp. 3187–3190.
국문 초록
특이 스펙트럼 템플릿 비교를 통한 전류 잔차를 이용한
산업용 로봇 기어박스 고장감지
산업용 로봇은 넓은 범위의 산업 분야에서 필수적인 장비이다. 제조산업 분야에서, 예상못한 로봇의 고장은 회사에 심각한 경제적 타격을 초래할 수 있다. 고장은 로봇의 다양한 요소에서 일어날 수 있고, 고장난 기어박스는 로봇의 운행 성능과 제조된 물품의 품질에 중대한 영향을 미칠 수 있다. 그러므로 본 논문은 모터에 인가되는 전류 신호를 이용한 산업용 로봇의 기어박스 고장감지를 수행했 다. 제안된 방법은 정상 전류 신호 데이터를 힐버트 변환을 통한 리샘플링을 통 해 참조 위상에 동기화한다. 동기화된 신호들은 특이 스펙트럼 분석을 통해 분해 되고, 주요 성분들이 추출되어 그 평균값이 정상 템플릿을 구축한다. 이후 잔차 신호가 고장 상태를 모르는 동기화된 신호에서 정상 템플릿을 뺌으로써 추출된다.
마지막으로 고장 감지를 위해 잔차 신호에서 건전성 인자가 계산된다. 제안된 방 법의 성능을 정량화하기 위해 ‘감지 오차’라는 평가 지표를 도입했다. 이 지표를 통해 제안된 방법을 사용하였을 때 정상 템플릿을 사용하지 않은 시간 동기화 평 균을 통해 구한 건전성 인자의 분포보다 밀집된 분포를 보였다. 즉, 감지 오차가 감소하여 고장 감지에서의 불확실성이 감소했다는 것을 확인할 수 있었다.
주요어: 산업용 로봇
기어박스 고장감지 전류 신호
정상 템플릿
특이 스펙트럼 분석
학 번: 2020-25803