저작자표시-비영리-변경금지 2.0 대한민국 이용자는 아래의 조건을 따르는 경우에 한하여 자유롭게
l 이 저작물을 복제, 배포, 전송, 전시, 공연 및 방송할 수 있습니다. 다음과 같은 조건을 따라야 합니다:
l 귀하는, 이 저작물의 재이용이나 배포의 경우, 이 저작물에 적용된 이용허락조건 을 명확하게 나타내어야 합니다.
l 저작권자로부터 별도의 허가를 받으면 이러한 조건들은 적용되지 않습니다.
저작권법에 따른 이용자의 권리는 위의 내용에 의하여 영향을 받지 않습니다. 이것은 이용허락규약(Legal Code)을 이해하기 쉽게 요약한 것입니다.
Disclaimer
저작자표시. 귀하는 원저작자를 표시하여야 합니다.
비영리. 귀하는 이 저작물을 영리 목적으로 이용할 수 없습니다.
변경금지. 귀하는 이 저작물을 개작, 변형 또는 가공할 수 없습니다.
의학박사 학위논문
The study on functions of Pellino-1 in macrophage
polarization
대식 세포 분화에서 펠리노-1의 역할 연구
2020 년 2 월
서울대학교 대학원
의과학과
김 동 현
Abstract
Pellino-1 is a member of the E3 ubiquitin ligase family Pellino.
E3 ubiquitin ligases play important roles in several biological pathways either through regulation of protein activity or degradation of their target proteins. Macrophages detect and engulf microbial components and are known as key immune modulators in several organs including the gastrointestinal tract, lung, brain, fat and liver. Typically, macrophages play a pro-inflammatory role and produce inflammatory cytokines such as TNF-a, IL-1b and IL-12 in response to bacterial infection, known as M1 polarization.
Recently, M2-polarized anti-inflammatory macrophages have been regarded as modulators of tissue homeostasis and inflammation.
Thus, macrophage polarization is pivotal to inflammation and outcome of inflammation-related diseases including infection, diabetes, cancer and autoimmune diseases. Although several reports have demonstrated that Pellino-1 plays major roles in immune responses and diseases, the role of Pellino-1 in macrophage polarization is currently unclear.
In this study, the functions of Pellino-1 in macrophage polarization were investigated using Pellino-1 knockout mice or myeloid-lineage specific Pellino-1 knockout mice, and it was demonstrated that Pellino-1 induces M1 polarization upon LPS and IFN-g stimulation but reduces M2c polarization upon IL-10 stimulation. Energy utilization in macrophages was also affected by
Pellino-1, which regulates ubiquitination and activation of their targets, IRF5 and IRAK1 in M1 and M2c polarization, respectively.
Furthermore, Pellino-1 knockout mice exhibited reduced body weight and glucose intolerance in high fat diet-induced obesity models and aggravated tumor growth in mouse melanoma models.
Finally, a study using human clinical samples clearly demonstrated that expression of Pellino-1 is correlated with M1 polarization and insulin resistance index. Thus, these studies proved the role of Pellino-1 as a pivotal immune modulator regulating macrophage polarization via ubiquitination of their target proteins.
Keyword : Macrophage polarization, Ubiquitin ligase, Pellino-1, Diabetes, Cancer, Inflammation
Student Number : 2011 - 31150
Table of Contents
I. Introduction ...1
II. Material & Method ...4
III. Results...14
IV. Discussion...50
V. References ...59
Abstract in Korean...69
Table of Figures
Figure 1. ...15
Figure 2. ...16
Figure 3. ...18
Figure 4. ...20
Figure 5. ...22
Figure 6. ...23
Figure 7. ...25
Figure 8. ...27
Figure 9. ...28
Figure 10. ...30
Figure 11. ...32
Figure 12. ...34
Figure 13. ...36
Figure 14. ...37
Figure 15. ...39
Figure 16. ...41
Figure 17. ...43
Figure 18. ...45
Figure 19. ...47
Figure 20. ...49
Figure 21. ...58
I. Introduction
1.1. Study Background
Macrophages are subpopulation of white blood cells in the immune system, which engulf and digest infected microbes, nonself components and debris, through a process called phagocytosis.
Tissue-specific macrophages are found in nearly all tissues and can detect and clear materials driving immune responses and regulate tissue homeostasis (1). Thus, macrophages are quite heterogeneous and their phenotypes and functions are regulated by the surrounding tissue micro-environment (2). Several in vitro studies have mimicked the heterogeneity of macrophages by using a combination of stimuli (3-5). For example, pro-inflammatory M1- polarized macrophages, or simply M1 macrophages, are induced by Toll-like receptor (TLR) ligands with IFN-g and produce pro- inflammatory cytokines such as TNF-a, IL-12, IL-1b and IL-6.
One the other hand, alternatively activated macrophages, or simply M2 macrophages, are polarized by cytokines including IL-4, IL-13 or IL-10 and produce anti-inflammatory cytokines such as IL-10 or TGF-b. M2 macrophages can be subdivided into M2a, M2b, M2c macrophages on the basis of their polarizing conditions such as IL- 4 or IL-13, LPS with immune complex, and IL-10 or TGF-b (6).
Therefore, differential polarization of macrophages can determine the outcome of immune responses and subsequent prognosis of
diseases affected by macrophage polarization such as infection, autoimmune diseases, diabetes, cancer, fibrosis and allergy (7).
The Pellino protein was initially reported as interacting with the kinase domain of Pelle, the orthologue of the IL-1R-associated kinase in the Toll signaling pathway in Drosophila melanogaster (8).
Pellino-1 is a member of the E3 ubiquitin ligase family Pellino which is composed of Pellino-1, -2 and -3. Several studies have reported that Pellino-1 plays important roles in various innate and adaptive immune cells (9-11). It inhibits T cell receptor signaling via K48-linked ubiquitination and subsequent degradation of its target, c-Rel (9). On the other hand, Pellino-1 promotes Toll-like receptor signaling through interaction and K63-linked ubiquitination of RIP1 (10). Other studies have also suggested the role of Pellino-1 in central nervous system immunity (11) and RIP3 activation mediated necroptosis (12). Although it has been known that Pellino-1 is involved in several biological processes and molecular pathways associated with diseases, how Pellino-1 regulates macrophage polarization and outcome of related diseases is poorly studied and understood.
1.2. Research objective
To clarify the role of Pellino-1 in macrophage polarization and related diseases, in vitro and in vivo experiments were performed using Pellino-1 knockout and LysM-Cre-mediated myeloid-
specific Pellino-1 knockout mice. Here, I show that Pellino-1 induces M1 polarization via K63-linked ubiquitination of M1- related transcription factor, IRF5. On the other hand, Pellino-1 inhibits IL-10-induced M2c polarization via K63-linked ubiquitination of IRAK1 and subsequent regulation of STAT1- STAT3 balance. Furthermore, Pellino-1-deficient mice showed reduced body weight and diabetes-associated phenotypes in diet- induced obesity (DIO) model and aggravated tumor growth in melanoma tumor model. Thus, these studies suggest that Pellino-1 is a pivotal modulator of M1 and M2c macrophage polarizations and is a drug target for diseases modulated by macrophage polarization status.
II. Material & Method
2.1. Mice experiments
Pellino-1 knockout mice (or simply Peli1-KO mice) were generated as previously reported (13) in C57BL/6 x 129/Sv background and backcrossed with C57BL/6 female mice for at least 7 generations. Peli1tm1a(EUCOMM)Wtsi mice were obtained from the International Knockout Mouse Consortium (University of California, Davis, Knockout Mouse Project [KOMP] Respository). Flp- recombinase transgenic mice and LysM-Cre mice were purchased from the Jackson Laboratory (Bar Harbor, ME, USA). To obtain myeloid-specific Peli1 knockout mice, Peli1tm1a(EUCOMM)Wtsi mice were mated with Flp transgenic mice to make Peli1-floxed mice, then sequentially mated with LysM-Cre mice. The mice were bred and maintained under specific pathogen-free conditions at the Biomedical Research Institute (Seoul National University Hospital, Seoul, Korea). 8 to 12 weeks-old mice were used for all experiments. Littermate Peli1+/+, Peli1+/-, Peli1fl/fl or Peli1fl/+
LysM-Cre mice were used as control. All experiments were approved by the Institutional Animal Care and Use Committee in Seoul National University Hospital (SNUH-IACUC, Approval Number; 16-0231) and animals were maintained in the facility accredited AAALAC International (#001169).
Control and Peli1–/– mice were fed with a HFD (D12492,
Research Diets Inc., New Brunswick, NJ) for the indicated time courses to induce the diet-induced obesity (DIO) model. For the Glucose Tolerance Test (GTT), the mice were fasted overnight prior to an injection with 1.5 g/kg of glucose and the glucose levels were measured at indicated time points. For the Insulin Tolerance Test (ITT), the mice were fasted for 4 h prior to injections with 0.75 U /kg of insulin. The plasma insulin levels were measured with enzyme-linked immunosorbent assay (ELISA) kits (ALPCO) after overnight fasting, and the HOMA-IR values were calculated using the following formula; fasting blood glucose × fasting insulin / 405.
To deplete macrophages in vivo in DIO model, mice were intraperitoneally injected with cloronate liposomes according to the manufacturer’s instructions (www.ClodronateLiposomes.org, 50 mg/kg of mouse weight).
For subcutaneous tumor model, B16F10 cells (3.0 x 10⁵) were subcutaneously injected into the flank and tumor sizes were measured with a digital caliper three times a week. Tumor volumes were calculated as length × width × [(length + width) / 2]. For macrophage depletion in tumor model, 0.5 mg of anti-mouse CSF1 antibody (BioXcell, 5A1) was injected intraperitoneally a day before tumor injection. Antibody was further injected weekly in same dose during tumor model experiments, and isotype antibody (BioXcell, HRPN) was injected into control groups.
2.2. Human Specimen
Individuals scheduled to undergo laparoscopic gastrectomy for early gastric cancer at Seoul National University Hospital, Seoul, Korea from December 2015 through December 2016 were included in this study. Individuals who had a pathologic tumor stage that was greater than T2, had lymph node metastasis, were undergoing neoadjuvant chemotherapy, or had missing clinical data, including serum glucose or cholesterol levels were excluded. Visceral adipose tissues were obtained from these patients during laparoscopic surgery. The heights, weights and abdominal circumferences of the participants were measured at hospital admission, and the history of type II diabetes and diabetes medications was obtained from the electronic medical record system. The participants were classified as obese (BMI 25, n= 21) or non-obese (BMI < 25, n= 34). This study followed the recommendations of the World Medical Association and the Declaration of Helsinki. Thus, each participant signed written informed consent and this study was approved by the Institutional Review Board of Seoul National University Hospital (H-1510- 036-710).
2.3. Preparation and polarization of macrophages
For preparation of murine bone marrow-derived macrophage (BMDMs), mice were sacrificed and the femurs and tibias were flushed with sterile 1× PBS and red blood cells were lysed with an RBC lysis solution (Qiagen). The collected bone marrow cells were cultured on sterile, non-coated Petri dishes in DMEM supplemented with 10% fetal bovine serum, Penicillin-Streptomycin (Gibco), and 20 ng/ml of mouse recombinant M-CSF. 3 ml of growth media with M-CSF were added every 2-3 days. After 7 days of incubation, the attached BMDMs were detached by incubation with accutase (Merck) at 37°C for 10 min and re-plated in appropriated well plates overnight for further analysis. For preparation of peritoneal macrophages, mice were injected intraperitoneally with 3%
thioglycollate medium and peritoneal exudates were harvested 3 days after thioglycollate injection. The collected peritoneal cells were incubated with DMEM supplemented with 10% fetal bovine serum and Penicillin-Streptomycin overnight, and adherent cells were used for further analysis. For preparation of human monocyte-derived macrophages, peripheral blood samples were collected from healthy volunteers after obtaining informed consents at Seoul National University College of Medicine (IRB No.1306- 002-491). Monocytes were isolated from PBMCs prepared by density gradient centrifugation (Bicoll separating solution;
BIOCHROM) using anti-human CD14 microbeads (Miltenyi Biotec).
The cells were cultured in RPMI 1640 medium supplemented with 10% fetal bovine serum, 1% penicillin/streptomycin, 1% L- glutamine and recombinant human M-CSF (50 ng/ml; Peprotech) for 6 days and then used for M1 or M2 polarization.
For polarization of macrophages, following materials were used for treatment : LPS (100 ng/ml) and IFN-g (20 ng/ml) for M1, IL- 4 (20 ng/ml) and IL-13 (20 ng/ml) for M2a, LPS (10 ng/ml) and Immune complex (100 mg/ml of anti-chicken egg albumin [OVA]
antibody and 10 mg/ml of OVA) for M2b, and IL-10 (20 ng/ml) for M2c. Immune complex was prepared freshly before treatment as described (14). Briefly, OVA and anti-OVA antibody were mixed in PBS and incubated at 37°C for 30 min and treated as indicated concentration.
2.4. Metabolic Assay
Approximately 1.5 × 10⁵ BMDMs were plated in XF24 cell culture microplates (Seahorse Bioscience) and treated with macrophage polarizing stimuli for 6 h to analyze the extracellular acidification rate (ECAR) and oxygen consumption rate (OCR).
After stimulation, the media were changed to XF assay media, according to the manufacturer’s instructions. For ECAR, glucose (10 mM), oligomycin (1 mM) and 2-DG (50 mM) were sequentially treated. For OCR, Oligomycin (1 mM), FCCP (1 mM) and Antimycin A (1 mM) were treated for experiment. The ECAR and OCR were
assessed using XF24 analyzer (Seahorse Bioscience). Glucose uptake was assessed using 2-NBDG as following method. Before 2-NBDG treatment, BMDMs were pre-incubated with media containing no glucose and serum at 37°C for 30 min. After that, 2- NBDG (100 mM) was treated for 20 min and BMDMs were detached as described above for flow cytometry.
2.5. Immunoprecipitation and Immunoblotting
For immunoprecipitations in 293T cells, cells were transiently transfected with expression vectors using the conventional calcium-mediated transfection method. The cells were washed twice with PBS 48 h after transfection, and lysed with lysis buffer containing Tris-Cl (pH 7.9, 20 mM), NaCl (120 mM), Triton X- 100 (0.5%), EDTA (2.5 mM), and DTT (2 mM) in the presence of protease and phosphatase inhibitor cocktails. The cell lysates were incubated with primary antibody overnight at 4°C and subsequently treated with Protein A/G PLUS-agarose beads (Santa Cruz Biotechnology) for 4 h at 4°C. Anti-c-Myc agarose (Thermo Fisher) was used to isolate the Myc-tagged protein complexes.
BMDMs were lysed with lysis buffer containing 20 mM Tris-Cl (pH 7.9), NaCl (100 mM), Glycerol (10%), Triton X-100 (0.5%), EDTA (2 mM), and DTT (2 mM) with protease and phosphatase inhibitor cocktails, incubated with appropriate primary antibody overnight, and subsequently incubated with Protein A/G agarose beads for 8 h
at 4°C. The immunoprecipitates were eluted from the beads by boiling for 10 min in 2 × Laemmli Sample buffer after washing the beads with lysis buffer 4 -5 times. The eluted samples were loaded on 8% SDS-PAGE gels and transferred onto a polyvinylidene fluoride membrane (Millipore) for Western Blotting.
2.6. Chromatin Immunoprecipitation
The Pierce Agarose ChIP Kit (Thermo Fisher) was used according to the manufacturer’s protocols. Briefly, BMDMs were stimulated with LPS with IFN-g or IL-10 for the indicated time period and fixed with 1% formaldehyde. Nuclear fractions were used for immunoprecipitation with the IRF5, anti-RNA polymerase II, or isotype control antibody for M1 macrophages, and STAT1 and STAT3 antibodies for M2c macrophages at recommended dilution ratio, and the precipitated DNAs were further assessed by qPCR using primers detecting the promoter regions specific for Nos2, Il12a and Arg1 for M1 macrophages, and Il10, Socs3, or Bcl3 for M2c macrophages. The data were normalized to the IgG control at time zero.
2.7. Flow Cytometry
Human and mouse stroma-vascular fraction (SVF) cells were isolated as previously described (15). Briefly, human or murine visceral fat were chopped and incubated in collagenase buffer for 30 min at 37°C with shaking. After incubation, the digested tissue was filtered through a 100-mm nylon mesh and centrifuged to separate the adipocytes and SVF cells. The pelleted SVF cells were used for flow cytometry or RNA extraction.
For preparation of mononuclear cells from tumor, tissues were chopped and incubated in buffer containing collagenase type I (1 g/L), dispase II (1 g/L) and DNase I (20 mg/L) for 30 min at 37°C with shaking. After incubation, the digested tissue was filtered through a 100-mm nylon mesh and centrifuged. The pelleted cells were used for further experiments after RBC lysis.
For cultured BMDMs, cells were washed with 1x PBS twice and incubated for 10 min at 37°C with accutase (Biowest), then harvested suspended cells were washed once with 1x PBS and used for flow cytometry. Single-cell suspensions were pre-incubated with mouse anti-Fc receptor antibodies (BD Biosciences) for 15 min at 4°C, followed by surface protein staining or intracellular cytokine staining. Samples were analyzed with an LSRFortessa or LSRII cell analyzer (BD Biosciences).
2.8. qRT-PCR
Total RNA, which was isolated from cells using TRIzol (Life Technologies), was reverse transcribed to cDNA using M-MLV reverse transcriptase (Promega) according to the manufacturer’s protocol. Quantitative real-time polymerase chain reaction (qRT- PCR) reactions were performed using SensiFASTTM SYBR Master Mix (Bioline). Gene-specific PCR products were measured using an Applied Biosystems 7500 Sequence Detection System (Perkin- Elmer Biosystems, Foster City, CA). The relative quantification of gene expressions was assessed using 2-DDCTmethod.
2.9. Histological examination
Visceral fat from human and Epididymal fat from mouse were obtained, fixed in 4% formalin, and embedded in paraffin. 4 mm sections of paraffin-embedded tissue blocks were stained with hematoxylin and eosin (H&E) for histological examination. For immunohistochemistry, 4 mm-thick frozen sections of human visceral fat tissues were stained with anti-human CD68 (PG-M1;
Dako), anti-mouse/human IRF5 (ab33478; Abcam) and anti- mouse/human Pellino-1 (F7; Santa Cruz Biotechnology) antibodies using the Benchmark XT autostainer (Ventana Medical Systems).
Quantification of CD68, IRF5 and Pellino-1 expression were analyzed using immunohistochemistry slides. Briefly, the
expression of these proteins was measured in 5 independent high power fields (HPFs) in each case, and averaged across the case to get the mean number of immunoreactive cells / HPF.
2.10. Statistical Analysis
The data were presented as the means ± SEMs. Student’s t- tests (two groups) and one-way analysis of variance (ANOVA) (more than two groups) with Tukey’s post hoc test were performed to compare the groups. All data were statistically analyzed using GraphPad Prism 5 software. P values < 0.05 were considered significant and presented as following nomenclature; * p< 0.05, ** p
< 0.01, *** p< 0.001.
III. Results
3.1. Pellino-1 regulates macrophage polarization in vitro.
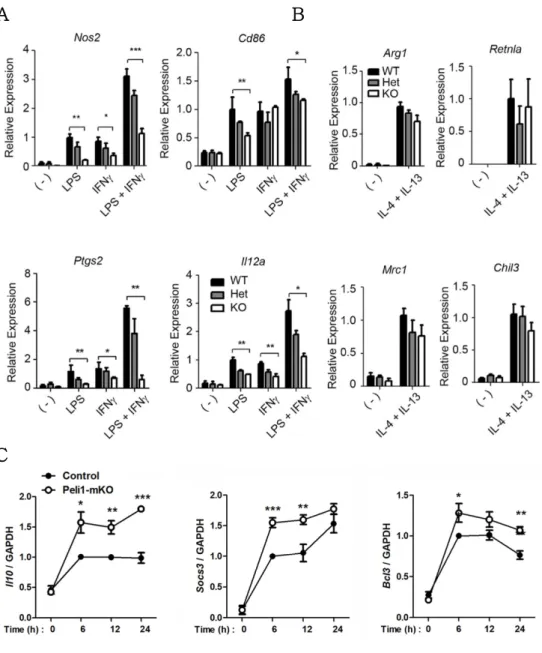
To explore the regulation of macrophage polarization by Pellino-1, qRT-PCR was performed under several polarization conditions. BMDMs were treated with LPS, IFN-g, or both for M1 polarization, and IL-4 and IL-13 for M2a polarization. Pellino1- deficient macrophages exhibited reduction in M1 polarization markers including Nos2, Ptgs2, Cd86 and Il12a (Fig. 1A). M1 markers were expressed similarly in Peli1+/+ (WT) and Peli1+/- (Het) BMDMs polarized into M1, indicating no haplo-insufficiency of Pellino-1 in M1 polarization. However, when polarized into M2a, Pellino-1 might have no profound effects (Fig. 1B). Furthermore, when treated with IL-10, Pellino-1-deficient macrophages showed induced M2c polarization compared with the control (Fig. 1C). Thus, it was proposed that Pellino-1 regulates macrophage polarization in the direction of M1 induction and M2c reduction, but has minimal roles in M2a polarization.
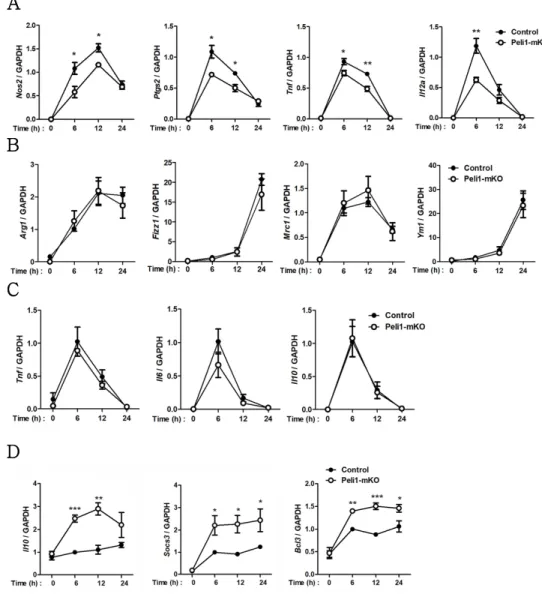
To prove this hypothesis in macrophages other than BMDM, expression of polarization markers was assessed using peritoneal exudate cells (PECs) after thioglycollate injection. Reduced M1 polarization, comparable M2a polarization and induced M2c polarization in Pellino-1-deficient PEC was consistently observed (Fig. 2). Furthermore, it was found that Pellino-1 had no
A B
C
Figure 1. Pellino-1 regulates macrophage polarization in BMDM.
A-B)Peli1+/+(WT), Peli1+/-(Het), Peli1-/-(KO) BMDMs were treated with LPS, IFNg, or both to induce M1 polarization (A) and IL-4 with IL-13 to induce M2a polarization (B), and expression of polarization markers was assessed via qRT- PCR.
C) Control and Peli1fl/fl LysM-Cre (Peli1-mKO) BMDMs were polarized into M2c polarization via IL-10, and M2c markers were assessed. All data were representative of 3 independent experiments.
A
B
C
D
Figure 2. Pellino-1 regulates macrophage polarization in PEC.
PECs obtained from control and Peli1-mKO mice were treated with LPS with IFNg (A), IL-4 with IL-13 (B), LPS with immune complex (C), and IL-10 (D) to polarized into M1, M2a, M2b and M2c, respectively. Expression of polarization markers was assessed via qRT-PCR. All data were representative of 3 independent experiments.
role in immune complex mediated M2b polarization (Fig. 2C), which exhibits anti-inflammatory phenotype when treated with LPS (16, 17). Collectively, these data suggest that Pellino-1 controls M1 and M2c macrophage polarization in vitro, but not M2a or M2b.
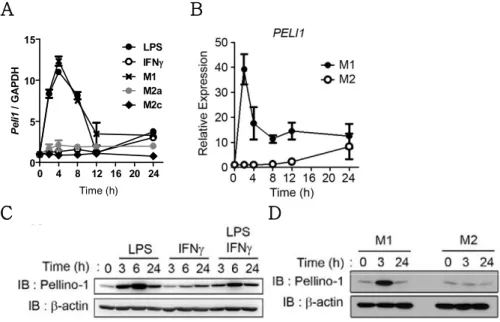
3.2. M1 polarization induces Pellino-1 expression.
It was assumed that expression of Pellino-1 is altered upon diverse macrophage polarization. To prove this hypothesis, mouse BMDMs and human monocyte-derived macrophages (MoDMs) were treated with various M1 and M2 stimuli. mRNA expression of mouse Pellino-1 was significantly induced upon LPS-mediated M1 stimulation at early phase (0 – 4 h), but not upon M2a or M2c stimulation (Fig. 3A). Human Pellino-1 mRNA was induced at very early phases (0 – 2 h) and rapidly reduced while being sustained at high levels compared with the non-stimulated group even after 24 h (Fig. 3B). Pellino-1 protein expression was also upregulated in M1-polarized mouse BMDMs (Fig. 3C) and human MoDMs (Fig.
3D). Collectively, it is proposed that mRNA and protein levels of Pellino-1 were induced upon M1 polarization in both mouse and human macrophages.
A
B
0 4 8 12 16 20 24 0
5 10
15 LPS
IFNg M1 M2a M2c
Time(hr)
Peli1 / GAPDH
C D
Figure 3. Expression of Pellino-1 is induced upon M1 stimulations.
(A) BMDMs were treated with LPS, IFNg, M1 (LPS+IFNg), M2a (IL-4+IL- 13), M2c (IL-10) for indicated time periods, and expression of Pellino-1 was assessed via qRT-PCR
(B) Human monocyte-derived macrophage (MoDM) was treated with M1 and M2 (IL-4+IL-13) for indicated time periods, and expression of Pellino-1 was assessed.
C-D) Protein expression of Pellino-1 was assessed via western blot using mouse BMDMs (C) and human MoDM (D). All data were representative of 3 independent experiments.
Time (h)
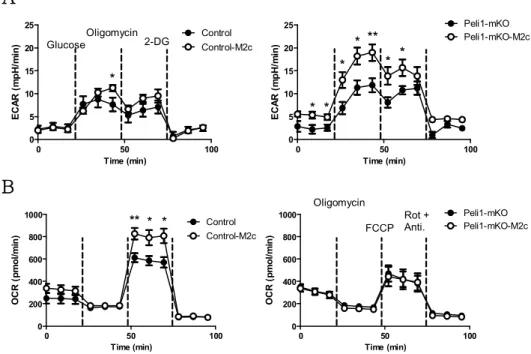
3.3. Pellino-1 regulates metabolic processes upon macrophage polarization.
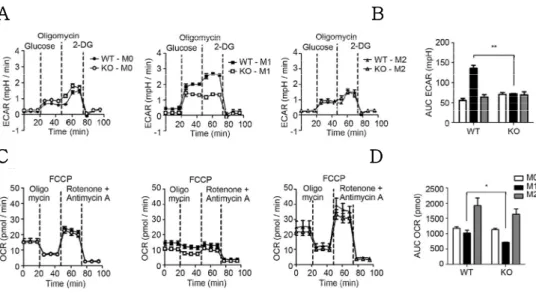
It has recently been demonstrated that metabolism and immune function are tightly correlated (18). M1-polarized macrophages utilize glycolysis to meet their energetic demand. In contrast, M2a- polarized macrophages utilize oxidative mitochondrial metabolic pathways to play long-term and persistent functions on tissue repair and resolution of inflammation (19, 20). Upon IL-10- mediated M2c polarization, it was previously reported that IL-10 plays an anti-inflammatory role via metabolic reprogramming of macrophages in combination with inflammatory TLR ligand stimulation (21). However, whether IL-10 solely plays the role of a metabolic regulator is not sufficiently understood. To prove this hypothesis that Pellino-1 also regulates metabolic processes upon macrophage polarization, metabolic parameters were assessed using mouse BMDMs.
Unstimulated BMDMs exhibited comparable ECAR and OCR profiles between wild-type (WT) and knockout (KO). As reported by several studies (22, 23), M1-polarized macrophages utilized glycolysis for energy expenditure in WT BMDMs, but this process was ablated in Pellino-1 KO BMDMs (Fig. 4A, B). TH2 cytokine- mediated M2a polarization induced usage of oxidative phosphorylation (OXPHOS) pathway, and Pellino-1 deficiency did not affect OXPHOS utilization (Fig. 4C, D). Thus, these data indicate
A
B
C D
Figure 4. Pellino-1 regulates glycolysis during M1 polarization.
WT or Pellino-1 KO mouse BMDMs were unstimulated (M0) or polarized into M1 or M2 (IL-4 + IL-13) for 6 h. (A) Extracellular acidification rate (ECAR) was assessed for evaluating glycolysis. Dashed lines indicated treatment of glucose (left), oligomycin (middle), and 2-deoxy-glucose (2-DG, right). (B) Area under the curve (AUC) of ECAR graphs were measured and analyzed statistically.
(C) Oxygen Consumption Rate (OCR) was assessed to evaluate oxidative phosphorylation (OXPHOS). Dashed lines indicated treatment of oligomycin (left), carbonyl cyanide 4-(trifluoromethoxy) phenylhydrazone (FCCP, middle), and Antimycin A (right). (D) AUC of OCR graphs were measured and analyzed statistically. ( n= 6 )
that Pellino-1 also regulates M1-driven glycolysis but not M2a- mediated OXPHOS pathway.
Little is known about how IL-10-mediated M2c polarization regulates metabolic processes. It was proposed that M2c macrophages utilize OXPHOS rather than glycolysis in control wild- type macrophages (Fig. 5A, B). Surprisingly, it was found that Pellino-1-deficient macrophages induced glycolysis upon M2c polarization. Since Pellino-1-deficient macrophages did not induce OXPHOS pathway (Fig. 5B), it was proposed that Pellino-1- deficient M2c macrophages have a defect in utilizing OXPHOS pathway and use glycolysis as a compensatory mechanism for energy production, as previously reported in OXPHOS-inactive macrophages (24).
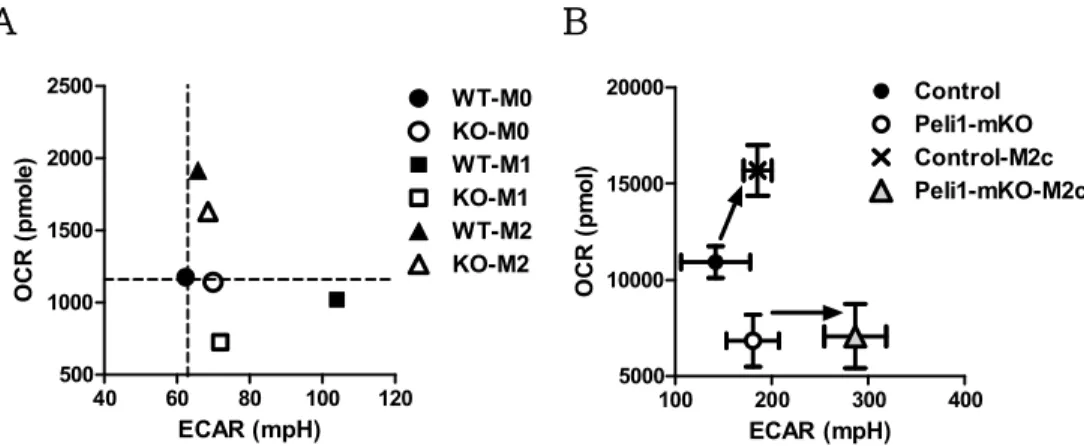
Collectively, these data clarify the role of Pellino-1 in macrophage polarization-mediated metabolic shift (Fig. 6A, B).
When polarized into M1, Pellino-1 induces M1 polarization and glycolysis, but is not equally effective upon M2a polarization (Fig.
6A). Wild-type macrophages utilize OXPHOS when polarized into M2c, but Pellino-1-deficient macrophages fail to induce OXPHOS.
Alternatively, glycolysis is upregulated in Pellino-1-deficient macrophages for energy usage and M2c polarization (Fig. 6B).
A
0 50 100
0 5 10 15 20
25 Peli1-mKO
Peli1-mKO-M2c
* *
*
* ** *
*
Time (min)
ECAR (mpH/min)
0 50 100
0 5 10 15 20
25 Control
Control-M2c
*
Time (min)
ECAR (mpH/min)
B
0 50 100
0 200 400 600 800
1000 Control
Control-M2c
** * *
Time (min)
OCR (pmol/min)
0 50 100
0 200 400 600 800
1000 Peli1-mKO
Peli1-mKO-M2c
Time (min)
OCR (pmol/min)
Figure 5. Pellino-1-deficient macrophages utilize OXPHOS in M2c polarization.
Control or Peli1fl/fl LysM-Cre BMDMs were unstimulated or polarized into M2c with IL-10 for 6 h. (A) Extracellular acidification rate (ECAR) was assessed for evaluating glycolysis. Dashed lines indicated treatment of glucose (left), oligomycin (middle), and 2-deoxy-glucose (2-DG, right).
(B) Oxygen Consumption Rate (OCR) was assessed to evaluate oxidative phosphorylation (OXPHOS). Dashed lines indicated treatment of oligomycin (left), carbonyl cyanide 4-(trifluoromethoxy) phenylhydrazone (FCCP, middle), and Antimycin A (right). ( n= 6 )
Glucose
Oligomycin 2-DG
Rot + Anti.
FCCP Oligomycin
A
B
100 200 300 400
5000 10000 15000
20000 Control
Peli1-mKO Control-M2c Peli1-mKO-M2c
ECAR (mpH)
OCR (pmol)
40 60 80 100 120
500 1000 1500 2000
2500 WT-M0
KO-M0 WT-M1 KO-M1 WT-M2 KO-M2
ECAR (mpH)
OCR (pmole)
Figure 6. Summary of Pellino-1-mediated regulation of metabolism
(A) xy plot of ECAR and OCR for description of metabolic shift in M1 and M2a polarization. (B)xyplot of ECAR and OCR for description of metabolic shift in M2c polarization. Arrows indicated metabolic changes from unstimulated BMDM to M2c-polarized BMDM. ( n= 6 )
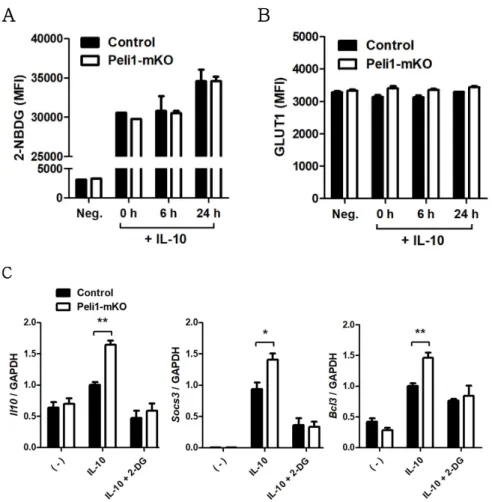
3.4. Glycolysis is necessary for M2c polarization in Pellino-1- deficient macrophages.
To further investigate the role of glycolysis in Pellino-1- deficient macrophages, it was hypothesized that upregulation of glycolysis was caused by glucose uptake in Pellino-1-deficient macrophages. However, glucose uptake measured by 2-NBDG staining did not show significant differences between control and Pellino-1-deficient (Myeloid-specific Peli1 knockout, or simply Peli1-mKO) macrophages (Fig. 7A). Furthermore, glucose transporter 1 (GLUT1), which plays a major role in glucose uptake in macrophages (25), was expressed at a similar level in the control and Peli1-mKO BMDMs (Fig. 7B). Several genes associated with the glycolysis pathway were also expressed at similar levels (Data not shown). Thus, there were no significant differences in glucose uptake and expression of enzymes involved in glycolysis.
Nevertheless, induction of M2c-related genes was controlled by glycolysis in Peli1-mKO BMDMs, as supported by the observation of glycolysis inhibition via 2-DG treatment dramatically suppressing induction of M2c markers in the control and Peli1- mKO BMDMs and showing no significant difference between groups (Fig. 7C). Collectively, these data suggest that glycolysis activates Pellino-1-deficient macrophages to play a pivotal role in the expression of M2c markers via post-transcriptional mechanisms rather than glucose uptake or glycolytic enzyme expression.
A
B
C
Figure 7. Role of glycolysis in M2c-polarized Peli1-mKO BMDM (A) Glucose uptake was measured by 2-NBDG staining in control or Peli1- mKO BMDMs after M2c polarization for 6 h. (B) Surface expression of GLUT1 was measured via Flow cytometry. (C) Glycolysis pathway was blocked via 2-DG treatment for 1 h and control or Peli1-mKO BMDMs were polarized into M2c for 6 h. Expression of M2c markers was assessed via qRT-PCR. (n= 5 )
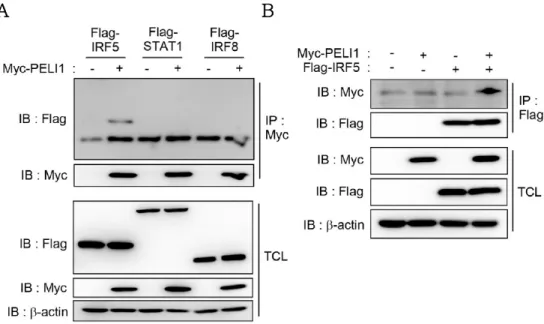
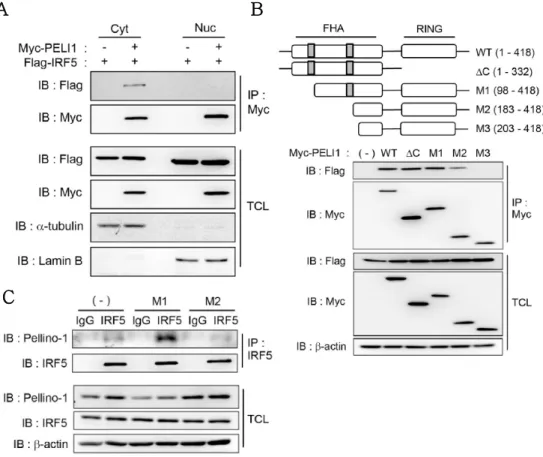
3.5. Pellino-1 binds and ubiquitinates IRF5 in M1 polarization.
Mechanisms how Pellino-1 regulates macrophage polarization were further investigated. It was hypothesized that Pellino-1 regulates M1 polarization through binding and ubiquitination of M1- related transcription factors directly. Thus, overexpression in HEK293T cells was used to explore the binding partner of Pellino- 1 among known M1 transcription factors including IRF5, STAT1 and IRF8 (5, 26, 27). Apparently, interaction of Pellino-1 and IRF5 was detected in the precipitate purified with anti-Myc antibody, but other factors such as STAT1 or IRF8 did not interact with Pellino- 1 (Fig. 8A). Furthermore, interaction between Pellino-1 and IRF5 was confirmed when precipitated with anti-FLAG antibody (Fig.
8B).
It has been known that Pellino-1 is expressed in both cytoplasm and nucleus (28). To clarify where Pellino-1 interacts with IRF5, total cell lysate was divided into nuclear and cytoplasmic fractions and immunoprecipitation was performed separately. It was found that Pellino-1 interacts mainly with IRF5 in cytoplasm (Fig.
9A). Members of the Pellino family contain a forkhead associated (FHA) domain that mediates interaction with the binding partner (29) and RING finger domain harboring E3 ubiquitin ligase function (30). Thus, which part of Pellino-1 is required for binding with IRF5 was investigated. Immunoprecipitation data indicated that 183 to 202 amino acids in FHA domain are required for Pellino-1:IRF5 interaction (Fig. 9B).
A
B
Figure 8. Pellino-1 binds to IRF5 in overexpression system.
(A) Myc-PELI1 and M1 transcription factors tagged with FLAG were co- transfected into HEK293T cells and immunoprecipitation was performed using anti-Myc antibody. Binding with Pellino-1 was assessed via western blot.
(B) Immunoprecipitation was performed using anti-FLAG antibody to prove Pellino-1 and IRF5 interaction. b-actin was used as loading control and equal expression of overexpressed proteins between groups were confirmed via western blot using total cell lysate (TCL). All data were representative of 3 independent experiments.
A
B
Figure 9. Pellino-1:IRF5 interaction is mediated by FHA domain and occurs in cytoplasm.
(A) Myc-PELI1 and FLAG-IRF5 were co-transfected into HEK293T cells.
Lysates were fractionated into nuclear and cytoplasmic parts, and immunoprecipitation was performed using anti-Myc antibody. (B) FLAG-IRF5 and various Myc-PELI1 mutants were co-transfected and immunoprecipitated to prove binding domain.
(C) Immunoprecipitation was performed with anti-IRF5 antibody in mouse BMDMs polarized with M0 (non-stimulated), M1, and M2 (IL-4+IL-13) for 30 min. All data were representative of 3 independent experiments.
C
To prove this interaction in macrophages, BMDMs were polarized into M1 or M2a and immunoprecipitation was performed with anti-IRF5 antibody. As found in 293T cells, Pellino-1 interacted with IRF5 in M1-polarized macrophages, but lesser in non-polarized, or M2a-polarized macrophages (Fig. 9C).
Collectively, it was concluded that Pellino-1 might regulate M1 polarization via interaction with IRF5, one of M1-related transcription factors.
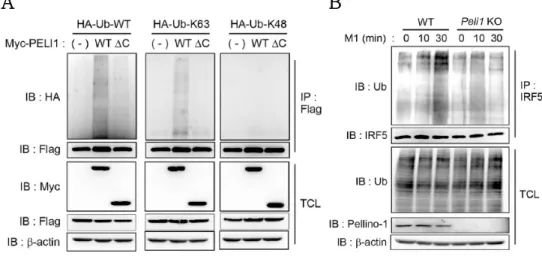
Whether Pellino-1:IRF5 interaction leads to ubiquitination of IRF5 was also investigated. K63- and K48- linked ubiquitination have been extensively studied and it has been found that K63- linked polyubiquitination regulates proteasome-independent signaling pathway by modification of protein activity. In contrast, K48-linked polyubiquitination leads the target protein to proteasome for degradation (31). As shown in Figure 10A, Pellino- 1 ubiquitinated IRF5 in K63-dependent manner, and Pelino-1 mutant which lacks the RING domain required for E3 ubiquitin ligase activity did not induce ubiquitination of IRF5 (Fig. 10A). To confirm this phenotype in macrophages, immunoprecipitation was performed with anti-IRF5 antibody in mouse BMDMs. M1 polarization induced ubiquitination of IRF5 after 30 min in WT BMDMs but not in Pellino-1 knockout (Peli1-KO) BMDMs (Fig. 10B).
Outcome of IRF5 ubiquitination was also investigated.
Considering IRF5 activation via ubiquitination-mediated nuclear translocation (32), nuclear translocation of IRF5 was tested in WT
A
B
Figure 10. K63-linked ubiquitination of IRF5 by Pellino-1
(A) Myc-PELI1 (WT and DC which lacks RING domain), FLAG-IRF5, and HA-Ub (WT, K63 only, K48 only) were co-transfected into HEK293T cells and immunoprecipitation was performed to prove ubiquitination of IRF5.
(B) Immunoprecipitation was performed with anti-IRF5 antibody in mouse BMDMs polarized with M1(LPS+IFNg) for indicated time periods, and ubiquitination of IRF5 was assessed via immunoblotting. All data were representative of 3 independent experiments.
when polarized into M1, but expression of IRF5 in cytoplasm was not altered in WT BMDM (Fig. 11A). In contrast, Peli1-KO BMDMs failed to translocate IRF5 upon M1 polarization (Fig. 11A). To confirm these phenotypes in human macrophages, human MoDMs were used for further experiments, showing consistency with the mouse BMDM results (Fig. 11B). Furthermore, Chromatin immune- precipitation (ChIP) assay showed induced binding of IRF5 to promoter regions specific for M1 genes such as Nos2 and Il12a, but not to promoter region of Arg1, representative M2a marker, in M1- polarized WT BMDMs (Fig. 11C). However, this phenotype was severely impaired in Peli1-KO BMDMs when polarized into M1 (Fig.
11C). Collectively, these data demonstrated that Pellino-1- mediated K63-liked ubiquitination of IRF5 leads to nuclear translocation and activation of IRF5 in M1 polarization, thus promoting IRF5-mediated transcription of M1 markers.
A
B
C
Figure 11. Pellino-1 regulates nuclear translocation of IRF5.
(A) Lysates from WT and Peli1-KO BMDMs were fractionated and immunoblotted to detect IRF5 and Pellino-1 expression in both nuclear and cytosol fractions.
(B) Human MoDMs were transfected with control of siRNA specific for PELI1, fractionated into nuclear and cytosol parts. Nuclear translocation of IRF5 was assessed via western blot. (C) BMDMs polarized into M1 were processed for Chromatin immunoprecitation (ChIP) assay and further analyzed via qRT-PCR using primers specific for promoter regions. All data were representative of 3 independent experiments.
3.6. Pellino-1 regulates obesity and diabetes in vivo.
The general view regarding obesity is an imbalance in the M1/M2 macrophage ratio, with M1 macrophages being enhanced compared with M2 macrophages which is down-regulated, leading to chronic inflammation and propagation of metabolic dysfunction (33). Moreover, it was previously reported that IRF5, one of the transcription factors associated with M1 polarization, promotes insulin resistance during obesity (26, 34). To study the role of Pellino-1 in obesity and diabetes, diet-induced obesity (DIO) models induced by high fat diet (HFD) feeding was used for further experiments. Considering that Pellino-1 promotes M1 polarization in vitro, it was hypothesized that Peli1 KO mice exhibits reduced body weight and insulin resistance index. Consistent with this hypothesis, glucose intolerance (Fig. 12A) and insulin resistance (Fig. 12B), along with homeostatic model assessment for insulin resistance (HOMA-IR) (Fig. 12C) were increased upon HFD feeding, and Peli1 KO mice exhibited lower level of diabetic phenotypes compared with Hetero mice. Furthermore, macrophage polarization observed in epididymal adipose tissue indicated that M1 polarization is significantly induced upon HFD-fed Hetero mice, but impaired in HFD-fed Peli1-KO mice (Fig. 12D). Moreover, stroma-vascular fraction cells from adipose tissue expressed more M1 markers in Hetero mice compared with Peli1-KO (Fig. 12E).
M2 markers were expressed similarly between groups, which is
Figure 12. Pellino-1 promotes insulin resistance and M1 polarization in DIO model.
A-B) Peli1+/-(Het) and Peli1-KO mice were fed with HFD for 8 weeks and blood glucose level was measured after fasting overnight and intraperitoneal injection of glucose (1.5 g/kg) for glucose tolerance test (A) or after fasting 4 h and intraperitoneal injection of insulin (0.75 U/kg) for insulin tolerance test (B).
(C) HOMA-IR was calculated with blood glucose level and insulin level.
(D) Epididymal fat tissue from mice fed with HFD for 8 weeks was subjected to flow cytometry for evaluation of macrophage polarization (left) and M1/M2 ratio (right). (E) Expressions of several M1 and M2 markers were assessed via qRT- PCR using SVF cells from epididymal fat tissues. ( n= 8 )
Pellino-1.
Next, obesity-associated phenotypes were assessed in the DIO model. HFD-feeding induces chronic inflammation in adipose tissue evaluated with H&E staining and detection of crown-like structures (15, 35). Formation of crown-like structures was observed in Hetero mice fed with HFD, but severely reduced in KO mice fed with HFD (Fig. 13A). Furthermore, insulin-mediated signaling such as AKT and ERK phosphorylation was abolished in Peli1-KO mice (Fig. 13B). Along with insulin resistance, HFD-mediated increase in body weight (Fig. 13C) and fat tissue weight (Fig. 13D) were impaired in Peli1-KO mice, indicating that Pellino-1 promotes obesity, M1 polarization and insulin resistance. Food intake was not significantly different in Peli1-Hetero and –KO mice (Fig. 13E), indicating that difference in obesity is not caused by food intake.
Pellino-1 is expressed in several cells including T cells, macrophages, dendritic cells, and non-immune epithelial cells (9- 11, 36, 37). To exclude the possibility that Pellino-1 in other cells might affect disease phenotypes observed in DIO model, clodronate liposome, which is known to deplete macrophage population in vivo (38), was used to explore the role of Pellino-1 specifically in macrophages. Macrophage population was reduced for 1 week after administration of clodronate but recovered to normal homeostatic level (data not shown). Thus, to distinguish macrophages from donor and recipient, CD45.1+ congenic mice were used as recipient mice. Macrophages derived from CD45.2+ WT and Peli1-KO mice
A B
C D E
Figure 13. Pellino-1 promotes obesity in DIO model.
Peli1-Hetero (Het) and KO mice were fed with normal chow (NCD) or HFD for 8 weeks. (A) Hematoxylin & Eosin (H&E) staining was performed using epididymal adipose tissue. (B) Mice were intraperitoneally injected with PBS or Insulin (1 U/kg) and insulin signaling was assessed via western blot using epididymal adipose tissues. (C) Body weight was measured weekly. (D) Epididymal (ED), subcutaneous (SC) and retroperitoneal (RP) adipose tissues were harvest and their weights were measured. (E) The amount of food intake was measured in indicated time points. All data were representative of 3 independent experiments in A and B. ( n= 12 for NCD and n= 15 for HFD in C and D; n= 8 in E)
Figure 14. Macrophage-specific Pellino-1 promotes M1 polarization in DIO model.
(A) Diagram of experimental scheme for adoptive transfer of macrophages into mice fed with HFD. (B) SVF cells were prepared and macrophage polarization in donor and recipient macrophages was assessed via flow cytometry using CD45.1+ (recipient) and CD45.2+ (donor) markers. (C) Expression of M1 markers was evaluated in SVF cells from adipose tissues obtained from mice prepared as scheme described in A. All data were representative of 3 independent experiments ( n= 5 ).
macrophages (Fig. 14A).
Remained recipient macrophages showed similar M1/M2 ratio between groups but donor macrophages from Peli1-KO mice exhibited less M1 polarization compared with WT (Fig. 14B).
Furthermore, expression of M1 markers was reduced upon clodronate administration, similar to a previous report (39), induced by transfer of WT macrophages. In contrast, transfer of KO macrophages induces relatively less M1 polarization (Fig. 14C).
Administration of clodronate or transfer of macrophages did not induce body weight change, possibly due to short-term experimental schedule.
Next, glucose tolerance test (GTT) and insulin tolerance test (ITT) were performed to assess insulin resistance in adoptive transfer model. Administration of clodronate decreased blood glucose levels detected in GTT and ITT. Adoptive transfer of WT macrophages induced glucose intolerance and insulin resistance, but adoptive transfer of Peli1-KO macrophages could not increase blood glucose level in GTT and ITT (Fig. 15A and B). Furthermore, activation of insulin signaling assessed by western blot demonstrated that clodronate promoted phosphorylation of AKT and ERK, downstream signaling of insulin, and adoptive transfer of WT macrophages reduced activation of insulin signaling. However, transfer of Peli1-KO macrophages could not induce insulin resistance (Fig. 15C), suggesting that Pellino-1 in macrophages promotes insulin resistance and M1 polarization in obesity.
A B
C
Figure 15. Macrophage-specific Pellino-1 promotes insulin resistance in DIO model.
Mice were prepared as experimental scheme described in Figure 14A.
(A) Glucose tolerance test was performed after overnight fasting and injection of glucose (1.5 g/kg) (B) Insulin tolerance test was performed after 4 h fasting and injection of insulin (0.75 U/kg) (C) Western blot for p-AKT, AKT, p-ERK, ERK was performed after injection of insulin (1 U/kg) to measure insulin-mediated signaling activation. All experiments were representative of 3 independent experiments. ( n= 5 in A and B )
3.7. Expression of Pellino-1 is correlated with M1 polarization and diabetes in human.
Finally, the role of Pellino-1 was investigated in human adipose tissue samples. Visceral adipose tissues from volunteer patients who underwent laparoscopic gastrectomy for early gastric cancer were collected to validate correlation between expression of Pellino-1 and several parameters for obesity and diabetes. The expression of Pellino-1 was significantly induced in the obese group compared with the non-obese group (Fig. 16A). Furthermore, expression of Pellino-1 was correlated with HOMA-IR (Fig. 16B), and percentage of M1 macrophages in adipose tissue (Fig. 16C).
Immunohistochemistry demonstrated that CD68+macrophages were accumulated in adipose tissue of obese group more than non-obese group. Along with CD68, Pellino-1 was highly expressed in cytosolic fraction of adipose tissue macrophages from obese group, while IRF5 was highly expressed in nuclear fraction of adipose tissue macrophages from obese group compared with non-obese group (Fig. 16D). Consistent with in vitro mechanism for Pellino-1, as described in Figure 11, these data suggest that Pellino-1 induces M1 polarization and insulin resistance in human adipose tissue through translocation of IRF5. Thus, Pellino-1 could be proposed as a diagnostic marker for adipose tissue inflammation and diabetes.
A B C
D
Figure 16. Pellino-1 expression is positively correlated with obese and diabetic phenotypes in human adipose tissue.
A-C) CD14+ macrophages were isolated from visceral fat tissues from obese ( n
= 21 ) and non-obese ( n = 34 ) human. (A) Expression of Pellino-1 was measured and compared between obese and non-obese groups. (B) Correlation between HOMA-IR and Pellino-1 expression was evaluated. (C) Correlation between M1 macrophage population among immune cells and Pellino-1 expression was evaluated. (D) Immunohistochemistry for CD68, IRF5 and Pellino-1 was performed using visceral fat tissues (left) and statistically analyzed (right).
Correlation analysis was performed via non-parametric Spearman’s test in (B) and (C). Data were representative of 3 independent experiments in (D).
3.8. Pellino-1 binds and ubiquitinates IRAK1 in M2c polarization
To investigate the mechanisms of how Pellino-1 suppresses M2c polarization, downstream signaling driven by IL-10 stimulation was focused on. IL-10 leads to phosphorylation and activation of STAT3, which is critical for expression of IL-10-responsive genes (40, 41). Furthermore, it has been reported that STAT1 and SAT3 have many antagonistic functions in myeloid cells, and it was proposed that balance between STAT1 and STAT3 activation by several cytokines, including IL-6 and IL-10, determines pro- inflammatory or anti-inflammatory outcome derived by cytokine stimulation (42-44). Thus, IL-10-driven activation of STAT1 and STAT3 were assessed via western blot. Interestingly, serine and tyrosine phosphorylation of STAT3 were minimally affected by Pellino-1 deficiency, but tyrosine phosphorylation of STAT1 was significantly impaired in Peli1-mKO BMDMs (Fig. 17A and 17B).
Reduced phosphorylation of STAT1 led to attenuated STAT1 promoter activity to IL-10-responsive genes (Fig. 17C).
To define underlying mechanisms in detail, expression of SOCS proteins, the negative regulator for STAT family (45), were evaluated but unfortunately differences of SOCS expression were not detected between control and Peli1-mKO BMDMs (data not shown). Next, IRAK1 was investigated because it is known to play a role in STAT1 phosphorylation under diverse conditions (46, 47)
Figure 17. Pellino-1 regulates STAT1-STAT3 balance
(A) Expressions of p-STAT3 (serine727 and tyrosine705), total STAT3, p-STAT1 (serine727 and tyrosine701), total STAT1 were evaluated via western blot in control and Peli1-mKO BMDMs. (B) Western blot images were quantitatively analyzed with ImageJ program ( n= 4). (C) ChIP assays were performed using STAT1-specific antibody and promoter binding was evaluated via qRT-PCR ( n= 5).
and is a direct target for Pellino-1 (48, 49).
Therefore, it was hypothesized that Pellino-1 directly binds to IRAK1 and ubiquitinates IRAK1, thus promoting STAT1 activation and relative de-activation of STAT3 in IL-10-driven M2c polarization. Total ubiquitin and K63-specific ubiquitin bound to IRAK1 were significantly reduced in Peli1-mKO BMDMs, and Pellino-1 bound to IRAK1 upon IL-10 stimulation (Fig. 18A). Next, the role of IRAK1 in STAT activation and M2c polarization was investigated. Treatment of IRAK inhibitor revealed that IRAK1 inhibition reduced tyrosine phosphorylation of STAT1 in control BMDMs but not in Peli1-mKO BMDMs (Fig. 18B), supporting the hypothesis that Pellino-1-mediated activation of IRAK1 induces phosphorylation of STAT1.
Furthermore, when treated with IRAK1 inhibitor, M2c markers were induced in control BMDMs, but not in Peli1-mKO BMDMs (Fig.
18C). Collectively, Pellino-1 binds to IRAK1 and induces K63- linked ubiquitination, thus promoting STAT1 activation and negative regulation of M2c gene expression upon IL-10 stimulation.
A B
C
Figure 18. Pellino-1 ubiquitinates IRAK1 and IRAK1 regulates M2c polarization.
(A) Control and Peli1-mKO BMDMs were treated with IL-10 for 30 min and subjected to immunoprecipitation using anti-IRAK1 antibody and further analyzed to define ubiquitination of IRAK1. B-C) BMDMs were pre-treated with IRAK inhibitor for 1 h and further treated with IL-10 for 6 h.
Expression of p-STAT3 and p-STAT1 were assessed via western blot (B) and expression of M2c markers were evaluated via qRT-PCR (C). All data were representative of 3 independent experiments.
3.9. Pellino-1 plays a suppressive role in mouse tumor model.
Cancer development and progression are closely associated with alterations in the surrounding stroma containing fibroblast, neuroendocrine cells, adipose cells and immune cells (50, 51).
Tumor microenvironment (TME) is characterized by immune suppression, and thereby promotion of tumor growth (52).
Therefore, it was hypothesized that Pellino-1-mediated regulation of M2c polarization would lead to alteration in the outcome of tumor growth.
To investigate the role of Pellino-1 in tumor model, mice were subcutaneously injected with murine melanoma cell line, B16F10.
Peli1-mKO mice exhibited promoted tumor growth compared to control mice (Fig. 19A and 19B). Although LysM-Cre mice have been widely used for creation of macrophage-specific knockout strains, LysM is not a specific marker for macrophages, as some other cells including granulocytes, a few CD11c+ dendritic cells also express LysM (53). To exclude the possibility that other cells expressing LysM might affect tumor growth, mice were injected with anti-CSF1 antibody to deplete macrophages (54). Macrophage depletion suppressed tumor growth in Peli1-mKO, but not in control mice, indicating that tumor promotion in Peli1-mKO mice is macrophage-dependent (Fig. 19C and 19D).
Figure 19. Macrophage-specific Pellino-1 suppresses tumor growth.
Control or Peli1-mKO mice were subcutaneously injected with B16F10 melanoma.
(A) Tumor growth was measured every 2-3 days. (B) 16 days after tumor inoculation, mice were sacrificed and tumors were excised and weighed. C-D) Mice were injected with either isotype or anti-CSF1 antibody 1 day before B16F10 melanoma inoculation. Tumor growth was measured every 2-3 days (C) and final tumor weight was measured (D). ( n= 8 )
Furthermore, tumors obtained from Peli1-mKO mice induced M2 polarization and IL-10 production, providing more suppressive features of TME in Peli1-mKO mice (Fig. 20A-20C). IL-10 production from other immune cells such as regulatory T cells and myeloid-derived suppressor cells (MDSCs) was not altered in Peli1-mKO (data not shown), further supporting the hypothesis that Pellino-1 in tumor-associated macrophages (TAMs) indeed promotes tumor progression. Gene expression profiles revealed that TAMs from Peli1-mKO express more M2c markers including Il10, Socs3 and Bcl3 (Fig. 20D). A slight difference was observed in M1 and M2a markers except Arg1, which could be also regulated by IL-10-driven M2c polarization (55). Collectively, it is demonstrated that Pellino-1 makes tumor microenvironment unfavorable to tumor growth, thereby inhibiting tumor progression in mouse melanoma model.
A B
C D
Figure 20. Macrophage-specific Pellino-1 suppresses M2c polarization in TME.
Tumors from control of Peli1-mKO mice injected with B16F10 melanoma were subjected to prepare mononuclear cells. (A) Tumor associated macrophage (TAM) and M1/M2 ratio were analyzed by flow cytometry. (B) Statistical analysis was performed based on data from flow cytometry. (C) IL-10 production in TAMs was analyzed by intracellular staining of IL-10. (D) TAMs were sorted with APC-conjugated anti-F4/80 antibody and expressions of M2c markers (left), M1 markers (middle), M2a markers (right) were assessed via qRT-PCR. ( n= 8 for A and B; n= 6 for C and D )
IV. Discussion
4.1. Pellino-1 and M1 polarization
Here, the role of Pellino-1 in macrophage polarization and related diseases such as type II diabetes and cancer has been investigated. Previously, it was reported that Pellino-1 induces expression of pro-inflammatory cytokines upon TLR ligand- induced signaling in macrophages and dendritic cells (10). Although RIP1-mediated mechanism for regulation of TLR signaling by Pellino-1 was suggested, the data showed that M1 polarization was not impaired by the treatment of RIP1 kinase inhibitor, Necrostatin-1 (data not shown). Thus, novel mechanism to explain Pellino-1-mediated regulation of M1 polarization was elucidated, and it was proved that Pellino-1 regulates M1 polarization via interaction and K63-linked polyubiquitination of IRF5 (36). These dual acting-mechanisms could be explained by the facts that M1 polarization is induced by dual stimulations of LPS and IFN-g.
Furthermore, M1-polarized macrophages show unique gene characteristics such as Nos2, Ptgs2, Il12a, Tnf, Ccl2 and Ccl5 (56), which is not solely pro-inflammatory cytokines, but contain chemokines and enzymes.
Although the model suggested how Pellino-1 regulates activation of IRF5 in cytoplasm, Pellino-1 is actually expressed in both cytoplasm and nucleus. Several studies have been
predominantly focused on cytoplasmic ubiquitination-associated regulation of target proteins (57). However, the possibility that Pellino-1 regulates M1 polarization in the nucleus was not completely excluded. Nevertheless, it is more feasible that Pellino- 1 ubiquitinates IRF5 and induces nuclear translocation of IRF5 in the cytoplasm, suggesting that more nuclear IRF5 leads to more activation of M1-related gene transcription in the nucleus. Further experiments would help to find a more detailed role of nuclear Pellino-1.
Macrophages exhibit a distinct metabolic profile during M1 and M2 polarization; M1 macrophages shift towards anaerobic glycolysis, whereas M2 macrophages employ OXPHOS to generate ATP (18, 58). Consistent with these reports, Pellino-1-deficient BMDMs showed impaired glycolysis than WT BMDMs did upon M1 polarization, suggesting that Pellino-1 is involved in regulating glycolysis during M1 polarization. Although the mechanisms by which Pellino-1 regulates glycolysis in M1 macrophages are unclear, it is hypothesized that Pellino-1 might directly regulate glycolysis by inducing ubiquitination of target proteins in the glycolysis pathway, indirectly by promoting M1 polarization via IRF5-dependent manner, or both.
Other Pellino members, Pellino-2 and Pellino-3, might also regulate macrophage polarization. Although experiments describing the role of Pellino-2 or Pellino-3 were not performed in detail, several studies proposed that Pellino-3 acts as a negative regulator
viral immunity (59, 60), playing roles opposite to Pellino-1 (36, 61). Furthermore, protein expression of Pellino-2 was not detected in mouse and human macrophages (data not shown), suggesting the major role of Pellino-1 in induction of M1 polarization.
Based on the in vitrostudies, it was hypothesized that Pellino-1 regulates diseases in which M1 polarization plays an important role.
Among diseases, it was found that Pellino-1 regulates obesity and glucose intolerance in DIO model. Insulin-mediated activation of AKT and ERK pathways are significantly impaired in fat tissues from Peli1-KO mice fed with high-fat diet (HFD). Furthermore, macrophage depletion by clodronate results in no significant difference in insulin resistance index between WT and Peli1-KO mice fed with HFD. Considering that Pellino-1 is expressed in a variety of cells and tissues, Pellino-1 expressed in other cells might play a role in DIO model. Thus, studies about Pellino-1 in other immune cells would be required to completely understand the role of Pellino-1 in obesity and diabetes.
IRF5 is known to be implicated