저작자표시-비영리-변경금지 2.0 대한민국 이용자는 아래의 조건을 따르는 경우에 한하여 자유롭게
l 이 저작물을 복제, 배포, 전송, 전시, 공연 및 방송할 수 있습니다. 다음과 같은 조건을 따라야 합니다:
l 귀하는, 이 저작물의 재이용이나 배포의 경우, 이 저작물에 적용된 이용허락조건 을 명확하게 나타내어야 합니다.
l 저작권자로부터 별도의 허가를 받으면 이러한 조건들은 적용되지 않습니다.
저작권법에 따른 이용자의 권리는 위의 내용에 의하여 영향을 받지 않습니다. 이것은 이용허락규약(Legal Code)을 이해하기 쉽게 요약한 것입니다.
Disclaimer
저작자표시. 귀하는 원저작자를 표시하여야 합니다.
비영리. 귀하는 이 저작물을 영리 목적으로 이용할 수 없습니다.
변경금지. 귀하는 이 저작물을 개작, 변형 또는 가공할 수 없습니다.
공학박사 학위논문
Study on ECH-assisted start-up using trapped particle configuration in KSTAR and application to ITER
KSTAR 장치에서 입자가둠 구조와
전자공명가열을 활용한 플라즈마 시동 연구 및 ITER 로의 응용
2017 년 2 월
서울대학교 대학원
에너지시스템공학부
이 정 원
Study on ECH-assisted start-up using trapped particle configuration in KSTAR and application to ITER
지도 교수 나 용 수
이 논문을 공학박사 학위논문으로 제출함
2016 년 10 월
서울대학교 대학원
에너지시스템공학부
이 정 원
이 정 원의 공학박사 학위논문을 인준함
2016 년 12 월
위 원 장 황 용 석 ( 인 )
부위원장 나 용 수 ( 인 )
위 원 함 택 수 ( 인 )
위 원 최 원 호 ( 인 )
위 원 김 재 현 ( 인 )
i
Abstract
Study on ECH-assisted start-up using trapped particle configuration in KSTAR and application to ITER
Lee, Jeongwon Department of Energy System Engineering (Fusion & Plasma Engineering) The Graduate School Seoul National University
Efficient and reliable ECH (Electron Cyclotron resonance Heating)-assisted start-up using TPC (trapped particle configuration) is demonstrated in conventional, superconducting tokamak, KSTAR and analyzed by a plasma start-up simulator.
Characteristics of TPC start-up under the start-up conditions of the magnetic field quality and the prefill pressure are studied. Stable plasma start-up under ITER- relevant condition is achieved in KSTAR and the ITER start-up scenario using TPC is proposed to replace FNC (field null configuration). ECH-assisted plasma start-up
ii
has been proposed to overcome the difficulties of plasma initiation phase in future tokamaks, such as JT60-SA and ITER. Due to the limitation of superconducting solenoid coil operations, the toroidal electric field applied by an inductive way is lower than that of present tokamak devices. And large eddy current and complex ferromagnetic structure makes it difficult to control the poloidal magnetic field. So tokamak plasma initiation with ECH-assistance has been studied to supplement the limited inductive input power and to relax the criteria related to the poloidal magnetic field quality. Many researches have shown that the poloidal magnetic structure makes an efficient ECH-assisted start-up, instead of the conventional FNC. The TPC, recently developed in VEST (Versatile Experiment Spherical Torus), has shown enhanced confinement of ECH pre-ionization plasmas and based on them, efficient tokamak plasma formation with an expanded operation window is achieved. Applicability of TPC needs to be demonstrated to large, conventional, and SC tokamaks. It is noticed that TPC could help to overcome the defects of start-up based on FNC in JT60-SA or ITER, but it needs to be validated. However, there are some concerns when applying TPC to large, conventional, and SC (superconducting) tokamaks such as KSTAR. First, the PF (Poloidal Field) coils to generate the TPC field structure need to be carefully chosen with consideration of the initial charging current of PF coils. Second, the reduced particle trapping fraction effect due to the intrinsically low magnetic mirror ratio of large aspect ratio tokamaks need to be tested. Third, the operation window of the TPC poloidal field strength and initial deuterium prefill pressure needs to be identified. The plasma start-up experiments using TPC has been conducted in KSTAR for feasibility study and finding the operation regime of TPC. The plasma start-up
iii
scenario based on FNC is replaced by TPC by overlapping the mirror-like structure on the null. The 2ndharmonic, X-mode ECH system is used for pre-ionization of plasmas. 170 GHz of wave frequency with injection power of 600 kW is applied with toroidal injection angle of 20 degree, co-current direction. Applicability of TPC in conventional tokamak with improved efficiency than FNC is clearly demonstrated by experiments. The feasibility of TPC in low particle trapping ratio is analyzed through 0-d modeling, TECHP0D. The plasma confinement model is improved to represent the reduced convective loss due to the mirror effect. Based on this model, 35 % reduction of the convective loss along the magnetic field line is required to reproduce the experimental pre-ionization condition. The reduction fraction is similar value of the trapped particle fraction which is calculated by the guiding center averaged single particle calculation. Then, operation window of the TPC start-up is identified in KSTAR 2015 and 2016 campaign. With 16 shots using TPC, an operation diagram in terms of the magnetic pitch which represent magnetic field quality and the deuterium prefill pressure is obtained. The diagram shows a broader operation range of TPC for both magnetic pitch and prefill pressure than that of FNC. The magnetic pitch and the prefill pressure can be increased by 5 times and 1.5 times, respectively, compared to conventional FNC.
All shots using the TPC scheme in KSTAR 2015 and 2016 campaign are used to find the operation limits of TPC. The diagram in terms of the magnetic pitch and the deuterium prefill pressure shows two operation limits of TPC; a high prefill limit that is independent of the magnetic pitch and a low prefill limit that is linearly dependent on the magnetic pitch have been found. The parameter scan experiment shows two conditions in which the plasma start-up is failed. One is in a low
iv
ionization rate state and the other is in a low ionization density state. The operation limits are analyzed by the TECHP0D code. Low pre-ionization density case, the high electron temperature is achieved due to the reduced radiation loss. The radiative barrier is overcome by only the ECH power. However, the high electron temperature makes shorter confinement time than the closed flux surface formation time and the plasma start-up is failed. These conditions are confirmed by the experimental data with a low ionization density. The low ionization rate makes energy loss by ionization reaction after solenoid swing down. The energy loss delays the rise of the electron temperature and increases the plasma resistance. As a result, the plasma start-up was failed. Applicability of TPC start-up to ITER is studied. TPC start-up with a reduced toroidal electric field to ITER-level is conducted and successful plasma formation is observed, whereas with FNC, the start-up is failed. ECH power of 700 kW is used, and the toroid electric field during the entire start-up phase is kept less than the target value of ITER of 0.3 V / m. The TPC structure can be generated by ITER PF coils of #1 and #6, even though the up-down asymmetry of position and turn-number of coils. The newly developed start-up scenario using TPC is proposed to ITER and compared to the conventional FNC based scenario. Saving the solenoid flux and stable superconducting coil operation will be expected.
Keyword: Nuclear fusion, Plasma start-up, Trapped particle configuration, KSTAR, ITER
Student Number: 2012-30266
v
Table of Contents
Chapter 1. Introduction ... 1
1.1. Tokamak start-up ... 4
1.2. ECH-assisted start-up ... 5
1.3. Trapped particle configuration start-up... 8
1.4. Objectives and outline of this research ... 14
Chapter 2. Background Methodology for Tokamak Start-up Study... 18
2.1. Townsend avalanche theory ... 19
2.2. Vacuum field structure optimization with eddy current effect ... 27
2.3. Plasma dynamic model ... 31
2.4. Poloidal field structure effect to ECH-assisted start-up ... 37
Chapter 3. Reliable and efficient ECH-assisted start-up using TPC in KSTAR... 41
3.1. Development of TPC start-up operation scenario and experimental set-up41 3.2. Demonstration of TPC and comparison with FNC... 45
3.3. Benchmarking of TPC experiments with TECHP0D with improved open- field confinement model ... 51
3.4. Reliable start-up with expanded operation window of TPC... 58
vi
Chapter 4. Characteristics of TPC start-up... 61
4.1. Operation limits of TPC... 61
4.2. Parametric dependency of TPC start-up performance ... 62
4.3. Interpretation of operation limits with upgraded TECHP0D and its validation .... 66
4.4. ECH power effect to the operation limit ... 75
Chapter 5. Feasibility study of TPC start-up for ITER ... 77
5.1. ITER-relevant toroidal electric field start-up experiments in KSTAR
...
775.2. PF geometry for mirror-like magnetic field structure and ECH/ECCD condition of ITER... 80
5.3. Start-up scenario development based on TPC in ITER and comparison with FNC ... 80
Chapter 6. Conclusion and future work... 89
Appendix A. TPC experiments in VEST ... 91
A.1. Magnetic mirror ratio effect to plasma start-up... 91
A.2. Development of reference start-up scenario using TPC with full solenoid flux capability... 98
Bibliography ... 101
vii
Abstract in Korean... 109
viii
List of tables
Table 2.1. The parameters A and B in the Townsend theory... 21
ix
List of Figures
Figure 1.1 Schematic of plasma and magnetic field structure in tokamak. Image:
EUROfusion (www.euro-fusion.org)... 3 Figure 1.2 The experimental results in FTU tokamak with different ECH injection
mode (a), and the poloidal magnetic field structure at the error field of 85 G (b). ... 7 Figure 1.3 Time evolution of plasma parameters with five different phases of
ECH-assisted start-up (a), and 2-dimensional magnetic field configuration of -40 G vertical field case (b). ... 9 Figure 1.4 Pre-ionization plasma density and temperature profiles at the mid-
plane under the magnetic field of pure TF, TPC, and FNC (a), and plasma start-up performance of TPC and FNC (b) in VEST. ... 11 Figure 1.5 The various poloidal magnetic field structure (a), and the ECH plasma
images (b) for inter-shot wall conditioning in KSTAR. ... 13
Figure 2.1 Schematic diagram of Townsend avalanche theory. Image:
https://en.wikipedia.org/wiki/Townsend_discharge... 22 Figure 2.2 Required toroidal electric field for tokamak plasma formation based on
Townsend avalanche theory. ... 25 Figure 2.3 Schematic of tokamak and electromagnetic field structure during start-
up phase. ... 26 Figure 2.4 Examples of optimized poloidal magnetic field strength (a), and Lloyd
breakdown condition (b) in KSTAR. The yellow circle is the target position
x
of minimum poloidal magnetic field. ... 30 Figure 2.5 Validation of DYON simulator with JET start-up plasma parameters. ... 34 Figure 2.6 Open field confinement time according to the vertical field strength
using KSTAR typical condition, Bt=2 T, Te~20 eV. ... 39 Figure 2.7 The validation of particle confinement time in TORPEX device with theory and experiments. ... 40
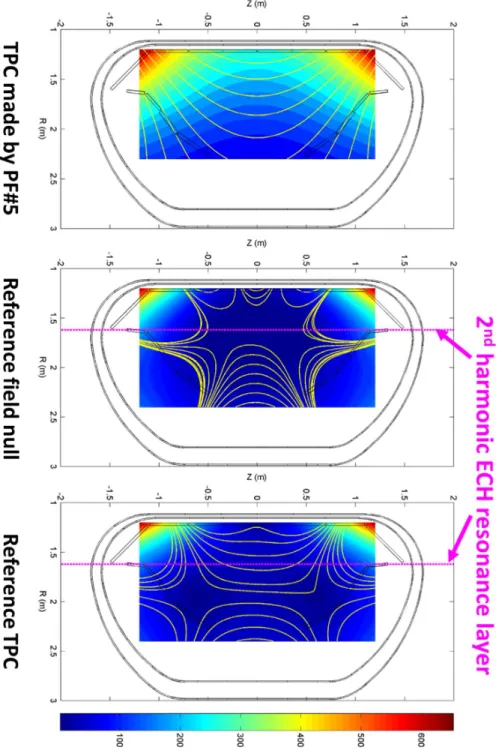
Figure 3.1 The magnetic field configurations of PF#5 only (a), conventional FNC (b), and reference TPC (c). The operation scenario of figure (c) is
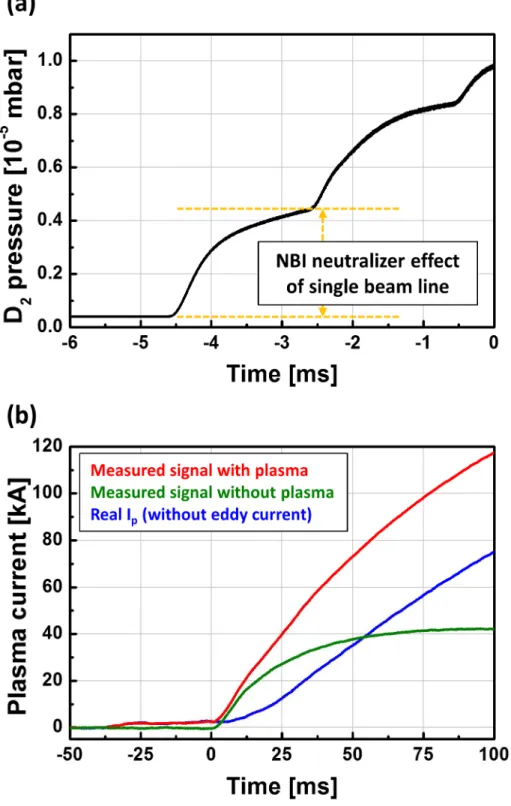
developed by overlapping the figure (a) on the figure (b). Magenta dot line indicates the X2 EC resonance layer. ... 42 Figure 3.2 Prefill pressure effect by the neutralizer pressure of NBI system (a),
and the Rogowski coil signal before and after the eddy current
compensation (b). ... 44 Figure 3.3 Comparison of the plasma start-up performance between the pure
ohmic and the ECH-assisted shot using FNC. Plasma current, loop voltage, line averaged electron density, deuterium line radiation, deuterium prefill pressure, and carbon radiation are presented. ... 46 Figure 3.4 Comparison of the plasma start-up performance between TPC and
FNC. Plasma current, loop voltage, line averaged electron density, deuterium line radiation, deuterium prefill pressure, and carbon radiation are presented. ... 47 Figure 3.5 Fast camera images of TPC and FNC during the pre-ionization phase. .... 49 Figure 3.6 Fast camera image of TPC and FNC after applying loop voltage. ... 47
xi
Figure 3.7 Pre-ionization plasma density according to the parallel loss reduction ratio (a), and the particle trapping ratio of KSTAR TPC at the resonance layer (b). ... 53 Figure 3.8 Time evolution of plasma parameters of experiment, TECHP0D model
before confinement model improving, and with improved model
TECHP0D. ... 55 Figure 3.9 Evolution of power balance with and without confinement
improvement. ... 57 Figure 3.10 Operation range of FNC and TPC for poloidal magnetic field quality
and deuterium prefill pressure. ... 59
Figure 4.1 Operation window of TPC using 27 shots in KSTAR 2015 and 2016 campaign. ... 61 Figure 4.2 Pre-ionization density and peak deuterium line time (a), and maximum
plasma current (b) according to the magnetic pitch angle and compared to FNC. ... 63 Figure 4.3 Pre-ionization density and peak deuterium line time (a), and maximum
plasma current and current ramp-up ratio (b) according to the deuterium prefill pressure and compared to FNC. ... 65 Figure 4.4 Electron temperature according to the electron density of pre-
ionization phase under different impurity condition (a), and comparison of convective loss time and closed surface formation time (b). ... 68 Figure 4.5 Plasma parameters of start-up success (#15888) and failure (#15889) case in KSTAR. ... 70
xii
Figure 4.6 Plasma parameters and fast camera images of the start-up failure case. .... 71 Figure 4.7 Start-up simulation with different ionization rate at solenoid swing
down. ... 73 Figure 4.8 Simulation results of closed surface formation time according to the
initial ionization rate. ... 74 Figure 4.9 Simulation of operation window according to the ECH power. .... 74
Figure 5.1 Comparison of low toroidal electric field start-up using FNC (#15348) and TPC (15833) in KSTAR. ... 78 Figure 5.2 Mirror-like poloidal magnetic field structure made by PF#1 and PF#6
in ITER. ... 81 Figure 5.3 ECH plasma formation according to the ECH injection angle in DIII-D. . 83 Figure 5.4 Ratio of collisionless energy growth rate between KSTAR and ITER. .... 84 Figure 5.5 Time trace of magnetic characteristics of FNC based scenario and
newly developed TPC based scenario to ITER. ... 86 Figure 5.6 Poloidal field structure of TPC based scenario at 0.2 s to ITER. .. 87
Figure A.1 Magnetic field configuration of different mirror ratio in VEST. Rm~3 case and Rm~1 case. ... 92 Figure A.2 Pre-ionization density (a) and temperature (b) profile with different
mirror ratio case. ... 94 Figure A.3 Plasma start-up performance with different mirror ratio (a), and radial
profile of pre-ionization plasma properties at the loop voltage applied time (b). ... 95
xiii
Figure A.4 Magnetic connection length of different magnetic mirror ratio scenario. . 97 Figure A.5 Poloidal magnetic flux contour of PF#1 (a), PF#5 (b), and PF#1 and PF#5(c). ... 99 Figure A.6 Plasma current formation of FNC (#14597) and TPC(#14584). ... 100
1
Chapter 1. Introduction
As a future energy resource, nuclear fusion is the most attractive and fascinating way to address the world-widely growing energy demand. The nuclear fusion realizes the way the sun makes energy on earth. In the sun, light nuclei fuse together to produce energy. There are many types of fusion reactions, but the most promising is the reaction between deuterium and tritium [1];
( ) ( )
2 3 4 1
1D+1T = 2He 3.5 MeV +0n 14.1 MeV (1.1) The energy required to fuse the two nuclei is tens of keV, which is much lower than the energy calculated by Coulomb barrier due to the quantum-mechanical tunneling effect. This is called thermonuclear fusion because the nuclei are heated to a temperature sufficient to cause a fusion reaction. At the temperature for thermonuclear fusion, the fuel atoms are ionized and the fuel is in a plasma state.
For a commercial fusion reactor, the energy from the fusion reaction must be greater than the energy required to sustain the fusion reaction. For sustained fusion reactions, the energy carried by alpha particles is used to maintain the plasma temperature with external heating, and the energy carried by neutrons is converted to electrical energy. If the plasma is maintained solely by energy from alpha particle, then this state is called ignition. In this state, no external heating is required to maintain the plasma temperature, and the plasma is self-ignited. To make this state, the following conditions must be satisfied[1];
2
21 3
3 10
nTtE > ´ m- ×keV s× (1.2)
where n, T, and τE are plasma density, temperature and energy confinement time, respectively. In this condition, the density and temperature profile is assumed to be flat. If both the energy by alpha particle and neutron are needed to sustain the plasma, it is called breakeven.
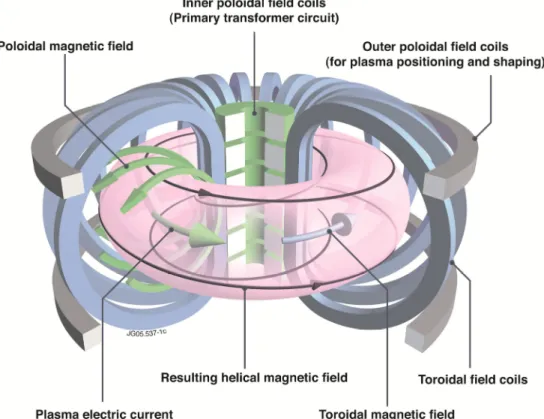
As an expected fusion reactor concept, the magnetic confinement devices have been studied and developed. The basic idea of magnetic confinement is that the magnetic field makes the high-energy charges particles to move circularly by Lorentz force so that they are not randomly scattered. Among the magnetic confinement devices, the torus-shaped magnetic confinement tokamak has been the most successful. The tokamak has toroidal and poloidal magnetic field made by external coils and plasma current. The schematic diagram of plasma and magnetic field structure in tokamak is presented in figure 1.1. As alternative concepts of magnetic confined torus-shaped devices, stellarator [2] and spherical torus [3] are also under researched.
ITER (International Thermonuclear Experimental Reactor) is the largest tokamak device currently under construction and is being built in Cadarache, France through collaboration of USA, EU, Russia, India, Japan, China, and Korea to provide the production of fusion energy and to verify its engineering effectiveness. The target energy multiplication factor is 10 under H-mode operation.
In addition to studying plasmas, proving that the self-generation and safe management of tritium and the energy carried by neutrons to thermal energy is one of the important goals.
3
Figure 1.1 Schematic of plasma and magnetic field structure in tokamak. Image:
EUROfusion (www.euro-fusion.org)
4
1.1. Tokamak start-up
The plasma start-up in the tokamak consists of three phase, avalanche, burn-through, and plasma current ramp-up. The tokamak start-up depends mainly on the toroidal electric field induced by the central solenoid coils. This is similar to a transformer, where solenoid coils corresponds to primary winding, and plasma corresponds to secondary loop. The toroidal electric field is used not only for plasma avalanche but also for the plasma current formation and maintenance in the tokamak.
In tokamak, the seed electrons present in the gas are used for the plasma avalanche process. The seed electrons are accelerated by the external toroidal electric field and ionize the prefilled gas molecules. For hydrogen, the energy required for ionization is 13.6 eV. The seed electrons as well as the electrons generated by ionization reaction are accelerated and contribute to the ionization reaction. The process is known as Townsend avalanche theory. The growth rate of electron density along the electron pass is called as the first Townsend coefficient.
Electron confinement during avalanche process is essential for a successful plasma start-up. The electron travels through two mechanisms, one to move along the magnetic field line with a termination speed, and the other to drift motion by magnetic field gradient and curvature. The first of these is the primary mechanism for electron confinement. Therefore, it is necessary to maximize magnetic connection length by making poloidal field null configuration improve the electron confinement. Because the poloidal magnetic field is created by the solenoid coils to create the toroidal electric field, it must be compensated for using the external PF coils. However, this is not easy because the eddy currents which is
5
induced in the tokamak structure by the external coils, also contributes to the poloidal magnetic field. Development of a code that optimizes the magnetic field structure considering the tokamak geometry is essential for reliable plasma start-up.
After the avalanche phase, the burn-through phase starts. To raise the electron temperature, it is necessary to exceed the radiative barrier by impurities in the vacuum vessel. The rise of the electron temperature is important for reducing the plasma resistance and raising the plasma current. The radiative power loss by impurities are determined by impurity density, electron density, and cooling rate, which is a function of electron temperature and impurity species.
Recently, the plasma breakdown studies have been carried out in consideration of plasma response as well as external electromagnetic fields. By using PIC(particle-in-cell)-MCC(MonteCarlo Collision) simulation, the studies show that electric potential due to charge distribution during discharging, as well as external electromagnetic field conditions, play an important role during the plasma formation phase [4, 5].
1.2. ECH-assisted start-up
The ECH-assisted plasma start-up is initially proposed by Y-K. M.
Peng[6] to get the cost efficiency of tokamak fusion reactor by moderating the ohmic heating power supply system. The required reduction of loop voltage was demonstrated in ISX [6], and related researches were performed in tokamaks such as FT-1 [7], WT-1 [8], WT-2, WT-3 [9], ISX-B [10], JFT-2 [11] and CLEO [12], as well as the stellarator, Tokapole-II [13]. Based on these results, study was conducted on various experimental conditions in DIII-D device [14].
6
Especially in the results at DIII-D, the various advantages of ECH- assisted start-up have been experimentally demonstrated in mid-size tokamak [14].
The loop voltage for plasma initiation was reduced to 0.15 V/m, which is lower than the target value of ITER, 0.3 V/m. The poloidal field strength to 50 G was overcome and the resistive volt-second consumptions decreases of 30 %. This shows that the ITER design of the 1990’s was possible with reliable ECH-assisted plasma start-up.
Since the 2000’s, the ECH-assisted start-up study was conducted under high harmonic ECH condition. A reduction of the magnetic field was applied as an alternative method for high-β operation with limited heating power. Therefore the ECH resonance condition changes from fundamental to second harmonic. The experiments were performed in JT60-U [15], DIII-D [16], Tore Supra [17], ASDEX-U [18], KSTAR [19] and FTU [20]. Especially ECH-assisted start-up contributes to the first plasma of KSTAR[21]. The experiments focused on the reliable ECH-assistance with reduced high harmonic ECH and reducing loop voltage below the ITER limitation in the mid-size tokamak.
The theoretical expectation for second harmonic assisted start-up is proposed with experimental results in DIII-D [22]. The single particle simulation of collisionless heating phase with second harmonic ECH shows that electrons can be heated up to several tens of eV, which is effective for the ionization reaction regardless of the initial energy, but when the Lheat>>Ln-e col+Lionization condition is satisfied. And the perpendicular energy growth rate, β=0.5k0E0/Bt, proposed in this study is used to compare the efficiency of different 2ndharmonic ECH.
A study of ECH-assisted start-up experiment under ITER-like conditions
7
Figure 1.2 The experimental results in FTU tokamak with different ECH injection mode (a), and the poloidal magnetic field structure at the error field of 85 G (b) [20].
8
in FTU is studied [20]. In this research, the identical ECH frequency and toroidal magnetic condition of ITER are applied and the operation limit of toroidal electric field and poloidal error field are explored. With 2ndharmonic extraordinary ECH injection of 350 kW and toroidal injection angle of 20˚, reliable plasma start-up with error field up to 9.52 mT is achieved with 0.5 V/m of toroidal electric field. In this case, the toroidal magnetic field is 2.7 T and the connection length is 85 m.
The experimental results are analyzed by BKD0 plasma evolution code with ECH ray tracing calculation by GRAY code [23].
The effect of the poloidal field on the open-field pre-ionization plasma confinement, especially the vertical poloidal magnetic field, has been studied through theory and experimental methods. A plasma start-up with a vertical field of 40 G showed better pre-ionization plasma performance and current ramp-up performance than the conventional FNC (field null configuration) in DIII-D [16].
The experimental result with vertical magnetic field is shown in figure 1.3.
Theoretical studies on the vertical magnetic field effect on open field plasma confinement has been conducted [24, 25]. The charge accumulation by the drift motions is neutralized by the current flowing along the magnetic field line, and therefore the radial plasma loss by ExB drift is reduced. However, because the poloidal field reduces magnetic connection length and exacerbates the parallel loss, optimal vertical field strength exists.
1.3. Trapped particle configuration start-up
Efficient ECH-assisted plasma start-up at mirror-like TPC (Trapped Particle Configuration) has been developed in VEST (Versatile Experiment Spherical
9
Figure 1.3 Time evolution of plasma parameters with five different phases of ECH- assisted start-up (a), and 2-dimensional magnetic field configuration of -40 G vertical field case (b) [16].
10
Torus) [26]. The mirror-like curved magnetic field structure has shown that it is more efficient and robust to plasma start-up performance than the vertical field case like DIII-D and FNC. The TPC has a wider operation range for the electromagnetic condition, the ECH input power, and the prefill pressure.
For pre-ionization plasma formation, the fundamental, extraordinary ECH power of up to 6 kW is applied. In VEST pre-ionization plasmas, studies related to EBW (Electron Bernstein Wave) heating are also being conducted. Electron density and temperature of the pre-ionization plasma are measured by the movable triple Langmuir probe at the mid-plane. Total plasma current is measured by the Rogowski coil installed inside of the vacuum chamber, and the plasma evolution is shown by the fast visible camera images.
The electron density and temperature of the TF only, FNC and TPC are shown in figure 1.4 (a). The left figure shows the TPC generated by the PF#3 and PF#4. The plasma equilibrium field is supplied by the PF#8 and PF#9 with plasma current initiation. The magenta dot line shows the resonance layer of 2.45 GHz ECH fundamental resonance layer with toroidal field of 0.05 T at the machine center. The red solid line shows the single particle trajectory according to the magnetic field structure.
TPC shows an improved confinement of ECH pre-ionization plasma in open field condition. The electron density and temperature profiles show the enhanced plasma confinement than FNC, and even though pure TF (perfect field null) case. Especially the density is higher than both FNC and pure TF at the whole region and the temperature is especially higher at outer region. The particle
11
Figure 1.4 Pre-ionization plasma density and temperature profiles at the mid-plane under the magnetic field of pure TF, TPC, and FNC (a), and plasma start-up performance of TPC and FNC (b) in VEST [26].
12
confinement time measured by the exponential decay rate of the electron density after ECH termination was found to be 3 times higher in TPC than that of pure TF case.
The improved ECH plasma contribute to efficient and reliable plasma current formation. At the same loop voltage, higher maximum plasma current was achieved with a faster ramp-up rate at TPC than at FNC. TPC is capable of reliable plasma start-up under broader operating conditions for prefill pressure, ECH injection power and electromagnetic conditions. Additionally, the intrinsically favorable magnetic field curvature for plasma position stability also results in immediate plasma current formation.
Plasma breakdown condition is represented by the electromagnetic condition, Et*Bt/Bp, also called Lloyd condition, not only in ohmic but also in ECH- assisted start-up. In this condition, the toroidal electric field represents the electron multiplication capability and the Bt/Bp expresses the magnetic connection length related to the electron confinement. Although the criteria of the electromagnetic condition is released with ECH pre-ionization, but the physical concept does not changed. However TPC achieves a more efficient plasma start-up through improved pre-ionization plasma, even though the connection length is reduced.
The TPC is expected to enable reliable plasma start-up in superconducting tokamak like ITER and spherical torus. The superconducting tokamaks have a limitation of toroidal electric field because of the limitation of current slew rate of the solenoid coils. Additionally, the large eddy current of conducting structure makes lowers the poloidal field control performance. Spherical torus has a low flux supply capability due to the small cross section of the solenoid coils. An efficient
13
Figure 1.5 The various poloidal magnetic field structure (a), and the ECH plasma images (b) for inter-shot wall conditioning in KSTAR [27].
14
start-up using TPC can help overcome the problems in the plasma initiation phase.
It has been studied that the curved poloidal field configuration can improve plasma confinement performance in wall conditioning by ECH plasmas between the plasma discharges in KSTAR [27] as well as in start-up. Among the various poloidal field structure, the mirror-like poloidal magnetic field structure showed the most expanded ECH plasma in vertical and horizontal directions with density of 2.3x10¹⁹ m-3. Successful wall recovery after the disruption is demonstrated by the wall conditioning plasmas. The various magnetic field structure and the ECH plasmas for wall conditioning is shown in figure 1.5.
1.4. Objectives and outline of this research
In this research, the efficient and improved ECH-assisted start-up using TPC is studied in conventional, superconducting tokamak, KSTAR. The feasibility of TPC will be studied by experiments and improved 0-dimensional start-up modeling. The characteristics of TPC operation in KSTAR will be explored and analyzed. Finally, ITER-relevant operation will be performed and scenario development using TPC for ITER will be proposed.
The plasma start-up scenario of KSTAR based on the FNC has inherent difficulties in controlling the poloidal magnetic field. PF coils for solenoid have a ferromagnetic material in coil jacket. This makes a serious distortion to the poloidal magnetic field structure, especially trying to generate the magnetic field null. Since 2011, the start-up scenario has been developed with PF and eddy currents as well as ferromagnetic effect. However, the ferromagnetic calculation has error to affect the plasma start-up, which is confirmed by the measured magnetic probe. In order
15
to optimize a scenario, the calculation and experiment have been carried out, simultaneously.
In addition, prefill pressure control has difficulties in reliable plasma start- up. The prefill pressure is affected by the neutralizer of the NBI (Neutral Beam Injection) system. The pressure at the neutralizer needs to rise 5 second prior to NBI operation and require about 102 times higher than the prefill pressure. In KSTAR, there is one NBI box consists of 3 neutral beam lines. Each beam line has its own neutralizer, and the main chamber prefill pressure is increased by 4×10⁻⁶ mbar per each neutralizer. The prefill pressure effect from a single NBI box is controllable to around 1×10⁻⁵ mbar. However, when a newly developed NBI system is installed, the two NBI boxes create a high pressure factor of 2 over the normal operation range.
Low toroidal electric field operation using TPC is the final issue of KSTAR start-up. NBI is inject in the direction of co-current when the normal experiments. But counter-current injection experiments are also needed for other physics researches such as resonant magnetic perturbation or plasma rotation. For counter-current operation, the plasma current direction must be reversed because the NBI system cannot move. However, since the BRIS (Blip Resistor Insert Circuit) circuit cannot be used to increase the slew-down rate of the solenoid coil currents, the toroid electric field in the start-up phase for reversed plasma current operation is limited. The low toroidal electric field scenario with FNC was developed in 2012, but it is very unstable. In this case, the toroidal electric field is reduced to ITER target level of less than 0.3 V/m. Thus, development of low toroidal electric field start-up scenario can help not only to various physics
16
researches in KSTAR but also ITER-relevant start-up researches.
In ITER, it is well-known problem that the toroidal electric field is restricted less than 0.3 V/m [28]. Additionally, due to the low resistivity of conducting structures to μohm, severe eddy currents makes poloidal field structure difficult to control. These characteristics narrow the operation range for prefill pressure or impurity contents. JT60-SA has an effective level of toroidal electric field of 0.5 V/m, similar to KSTAR or EAST, but eddy currents also too severe up to 600 kA to affect poloidal field configuration.
Summaries of the requirements for a more robust and reliable plasma start-up of KSTAR and ITER;
1. Increase the tolerance of poloidal field error to cover the uncertainties.
2. Widen operation range of prefill pressure for second NBI effect
3. Low toroidal electric field start-up for various physics studies in KSTAR and overcoming the intrinsic limitation of SC solenoid operation in ITER
TPC is likely to overcome the difficulties of KSTAR and ITER, but there are also issues to adopt in KSTAR;
1. Feasibility of TPC in KSTAR due to the intrinsically low magnetic mirror ratio from large aspect ratio (about half mirror ratio than spherical torus)
2. Operation window and limits of TPC for TPC poloidal field strength and prefill pressure
3. Demonstration of ITER-relevant low toroidal electric field operation using TPC
17
Therefore, this dissertation is consist to four part to achieve the improved ECH-assisted start-up in conventional, SC tokamak. In chapter 2, the background methodology to investigate the start-up is introduced. In chapter 3, efficient and reliable ECH-assisted start-up using TPC in KSTAR is presented. In chapter 4, the characteristics of TPC operation is investigated with experiment and modeling.
Chapter 5 shows ITER relevant operation using TPC in KSTAR and propose the ITER start-up scenario using TPC. Chapter 6, conclusion and future work of this dissertation is given.
18
Chapter 2. Background Theory for Tokamak Start-up Study
For plasma start-up study, Townsend avalanche theory is a basic physics of plasma formation. It is necessary to optimize the vacuum magnetic field in consideration of eddy current distribution and other magnetic materials. Time- dependent plasma density, temperature and current simulations are also required. It is important to optimize preprogrammed plasma start-up scenarios using all of these analyzes.
Townsend avalanche theory is introduced as the basic physics theory of plasma initiation. The theoretical derivation of conditions for electron events from seed electrons has been proposed, and the experiments conducted by Paschen have been verified and compared with the Townsend theory. Based on them, the criteria for tokamak plasma start-up is derived as electric field required as a function of prefill pressure and magnetic connection length.
Optimization of the time-varying magnetic field structure in the plasma startup phase is essential for reliable tokamak plasma initiation. In this phase, the central solenoid coils swing down from the initial charging current for applying the loop voltages in the vacuum chamber. The outer PF coils are also change the current to generate the target magnetic field structure. At the avalanche phase, it is necessary to create a poloidal magnetic field in order to increase the connection length with sufficient toroidal electric field to satisfy the breakdown condition.
This phase is evaluated by Lloyd condition, described in the previous chapter When
19
Lloyd conditions are met, a plasma event can occur and plasma currents can start.
After the plasma current starts to grow, a vertical magnetic field is required for plasma equilibrium and suitable radial magnetic field is also required for plasma position stability.
The plasma dynamics analysis code is needed to optimize startup scenario development by comparing plasma current evolution and poloidal vertical fields for plasma equilibrium. A simple method is to calculate the current assuming that the plasma is a RL (Resistance and Inductance)-circuit. However, for more accurate analysis, the methodology is upgraded to solving plasma density, temperature, and plasma current evolution, self-consistently. In this methodology, the plasma resistance is determined by Coulomb collision and electron-neutral collision.
2.1. Townsend avalanche theory
The plasma avalanche is explained by Townsend avalanche theory [29]. In this theory, the seed electrons generated by cosmic ray, natural radiation or ultraviolet are accelerated by external electric field and ionize the background gas.
By introducing first Townsend coefficient, α, the density increase along the electric field line is defined as;
dn=andx (2.1)
where αmeans the number of the produced electron per distance. The density as function of the position is gathered by integrating the equation (2.1);
20
( )
0exp
n n= ax (2.2)
where n0 is the initial particle number at x=0. First Townsend coefficient can be derived by considering the electron energy balance. The electric field is defined by the distance of both electrode and applied voltages;
/
E V d= (2.3)
where E is electric field, V is applied voltage between both electrode, and d is distance between electrodes. For a continuous ionization reaction, it is necessary to obtain sufficient energy for ionization by an external electric field before the other collisions. The distance between collisions is defined by mean free path, λ, and the electron which has long mean free path to get the enough ionization energy is expressed as following;
( )
exp
n N = -d l (2.4)
where the n is electron density which can contribute to the ionization, N is total particle density, and δ is required distance to get the ionization energy by given electric field. Here, the ionization number α by single particle per distance can be expressed as following;
1 1 n exp N a d
l l l
æ ö
= = ç- ÷
è ø (2.5)
In this equations, by replacing the δ/λas following;
21
( ) ( ) ( )
IE V
E E
d d
l = l = l (2.6)
and dividing the equation (2.6) by pressure p, then the final equation is;
( )
1 exp VI p
p p E p
a l l
æ ö
= ç- ÷
è ø (2.7)
By replacing 1/pλ=A, and VI/(pλ)=B, the equation (2.7) is expressed as;
exp B
p A E p
a æ ö
= ç- ÷
è ø (2.8)
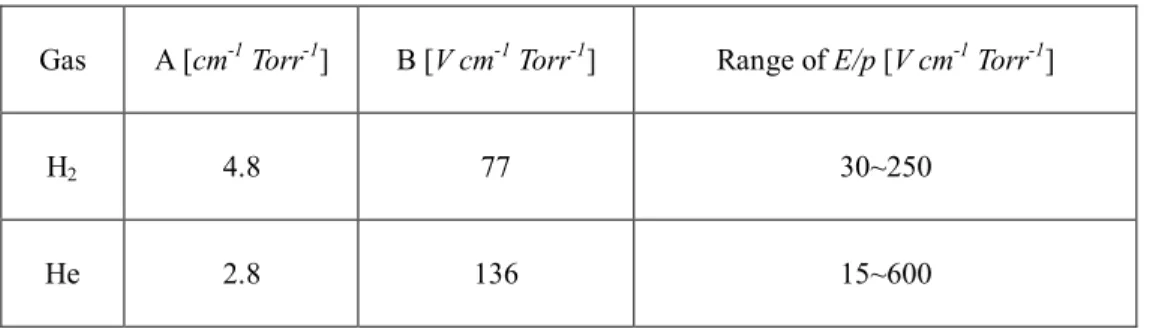
Here, the parameter A and B is determined by background gas species, and the examples of the parameters of hydrogen molecule and helium is presented in table 1.1. The schematic diagram of alpha process of Townsend avalanche is depicted in figure 2.1.
To sustain the plasma avalanche, the secondary electrons comes from the cathode by colliding the ion or photons are essential. The coefficient to represent the secondary electron generation is called by the second Townsend coefficient, γ.
Table 2.1 The parameters A and B in the Townsend theory
Gas A [cm-1Torr-1] B [V cm-1Torr-1] Range of E/p[V cm-1Torr-1]
H2 4.8 77 30~250
He 2.8 136 15~600
22
23
When the initial current comes to I0as the cathode, the current at the anode through the exponentially grown electrons is expressed as;
( )
0exp
I =I al (2.9)
where lis the distance between cathode and anode. The increase of electron current is I0eαl-I0 and if we define the multiplication factor η=eal-1, then the total electron current can be expressed by the infinite geometrical series;
( ) ( )
2( )
0( )
0 0 0
exp exp exp exp
1
I l
I I l I l I l a
a h a h a
= + + + = h
L - (2.10)
From this equation, Townsend makes the discharge condition as;
(
eal 1)
1h g= - = (2.11)
The required voltage for plasma formation is studied by Paschen. The relation between the required voltage, the gas pressure and the distance between cathode and anode has been experimentally found. It can be also derived from Townsend avalanche theory. By applying the logarithm to equation (2.11);
ln 1 1 al
g
æ ö
= ç + ÷º F
è ø (2.12)
Here, Φ is defined by the second Townsend coefficient which is affected by the cathode material. Equation (2.12) multiplied by pl and applied to equation (2.8), the resulting voltage required for plasma breakdown is:
24
( )
s ln V Bpl
= Apl
F (2.13)
In this equation, constant A, B, and Φ is defined by the gas species and cathode material. The required voltage for breakdown is a function of gas pressure and distance between electrodes.
It has been shown that the Townsend avalanche theory is reliable to explain the initiation of plasmas in tokamak. In tokamak, it has different characteristics such as low loop voltage of few volt, long particle trajectory of thousands meter, and only occurring Townsend first process. For sustain the avalanche process, the ionization rate during the seed electron traveling must be larger than 1;
connection 1
aL > (2.13)
With consideration of electron drift velocity and gas characteristics related toα, the required electric field according to the prefill pressure with given connection length condition is described as;
(
1) (
4) ( )
min
1.25 10 ( ) ln 510
p Torr E V m
p Torr L m
- ´
× =
é ù
ë û (2.13)
For the hydrogen, deuterium, and tritium case. The theoretical derive and the experimental validation are presented in [30] and the plot of equation (2.15) with various connection length and multi-machine experimental results are shown in figure 2.2.
25
26
In tokamak, inductive start-up based on the Townsend avalanche theory has been used. Since the tokamak structure cannot be used with electrodes, the electric field is applied in an induction manner. The electric field is used not only for plasma avalanche, but also for plasma current formation. It makes the tokamak operation as pulse and need to research the non-inductive current drive for the steady state long pulse operation. The configuration of tokamak start-up phase is depicted in figure 2.3.
Figure 2.3 Schematic of tokamak and electromagnetic field structure during start-up phase [31].
27
2.2. Vacuum field structure optimization with eddy current effect
Poloidal magnetic field configuration in the start-up phase is one of the key factors to be analyzed. There are three components that contribute to the poloidal magnetic field: PF coil currents, plasma current, and the eddy currents on the tokamak structure. The poloidal magnetic field by a toroidal current source is calculated by analytic form as followed;
( )
r z, I G r z r zc(
, ; ,0 0)
y = (2.14)
where G is the Green’s relation between toroidal current source and arbitrary (r,z) position, ψ is poloidal magnetic flux, and (r0,z0) is the position of the toroidal current source. The Gis defined as;
(
, ; ,0 0)
2( )
0 0.5(
2 2) ( )
2( )
G r z r z rr k K k E k
k m
p é ù
= ë - - û
(
0) (
2 0 0)
2k 4rr
r r z z
= + + -
(2.15)
where, (r, z)is the target position of magnetic field on poloidal plane. Here, K and E is complete elliptic integral of the first kind and second kind, respectively. The poloidal magnetic flux and poloidal magnetic field have relation as follow;
1 1
and
r z
B B
r z r r
y y
¶ 
= - =
¶ ¶ (2.16)
The toroidal electric field is obtained from time derivative of poloidal magnetic flux, ψ. The toroidal magnetic field has 1/Rdependency and determined by TF coil current. Based on them, the plasma avalanche condition, Lloyd condition, is
28 derived.
During the start-up phase, the eddy currents are major unknown parameters to find magnetic field configuration. The plasma current can also contribute to the poloidal field, but it is neglected for the start-up scenario design.
The eddy currents induced in the conductive structure by the PF coils are expressed by the following circuit equation;
d
= dtI+
V M RI (2.17)
where Mis matrix of mutual inductance between toroidally continuous structures and poloidal field coils, and Ris the resistance of structure, Vis externally applied voltages and I is current at the coil or eddy current elements, respectively.
The circuit equation can be solved by numerical integration like in [32], but the analytic solution of the equation (2.17) described in [33] is helpful to optimize the magnetic field configuration with eddy currents. By defining matrix A=-M-1Randg=M-1V,
d
dtI = +
AI g (2.18)
This is simple 1st order linear differential equation, and the solution I is expressed by summation of the homogeneous solution, Ih, and the particular solution, Ip. Here, the Ipis defined with constant matrixR-1and V;
= -1
Ip R V (2.19)
and the Ihis expressed as;
29
( )
1
exp
N
j j
lt
=
=
å
h j
I x (2.20)
Here, xj and λj are the eigenvector and eigenvalue of matrix A, respectively. The total solution of equation is;
( ) ( )
1 N exp
SS
i i j
j
t I lt
=
= +
å
ijI Z (2.21)
where ISS=Ip, the steady-state currents. To de-normalize the eigenvectors, Zij, the initial condition is used as;
( )
1 N 0
SS
ij i i
j
Z I I
=
= -
å
(2.22)The de-normalized factor χjare obtained by Zij=Zijχj. Finally, the equation (2.21) is expressed as;
( )
1( )
1( )
11 1 1 1
ˆ exp ˆ 0
N N N N
i il l ij i jk k kl l
l j k l
I t R V- Z lt Z- I R V-
= = = =
ì ü
= + í - ý
î þ
å å å å
(2.23)The expression is valid with a constant applied voltage. For example, in the pre- programmed start-up phase, which lasted about 120ms after the solenoid swing down in the KSTAR start-up experiments, the voltage applied to the PF coil remained constant.
To develop the start-up scenario, the magnetic field optimization to minimize the poloidal magnetic field strength at the target positions is performed by Green’s relation and analytic eddy current solutions and the cost function is
30
31 defined as [35];
2
2 1 ,
1 N M
i k k k i
l i
y V x
c = s=
é - ù
ê ú
= êë úû
å å
(2.24)where V, σ, M, and N are the applied voltage to the PF coils and the standard deviation used for adjusting weighting factors, number of PF coils, and number of constraints, respectively. The y is target value of the poloidal magnetic field, and the matrix xhas the relation factors between the applied voltage, eddy currents and the Green relation between current sources and target positions. To find the optimal solution, the singular value decomposition (SVD) method is used. The examples of the conducting structures and the target position for generating field null scenario of KSTAR is depicted in figure 2.4. The yellow circle is the target position to minimize the poloidal magnetic field.
2.2. Plasma dynamics model
A 0-dimensional plasma dynamic simulator during the start-up phase has been studied. Initially the plasma models are proposed in [6] to analyze the effect of ECH-assistance for low loop voltage start-up. To analyze the low toroidal field effect of ITER as a burn-through simulator, a zero-dimensional code was developed in [36]. Based on these researches, many kinds of start-up simulator as SCENPLINT [37], TECHP0D [38, 39], and DYON [40]. As a subroutine of TRANSMAK, SCENPLINT has been used to develop the ITER start-up scenario.
TECHP0D has been developed for first plasma study of KSTAR. Finally, DYON is
32
newly developed burn-through simulator, validated with JET result [41], and applied to the ITER estimation [42].
The basic plasma model of power, particle balance of electron and ion, and plasma current evolution is presented in [36]. The model is based on the plasma state, the initial plasma formation by Townsend avalanche theory or ECH is assumed. The ion particle balance is expressed as;
n 0
D D
e
p p
dn V n
dt =V Sn n -t (2.25)
where Vn, Vp, S, n0, and τp are neutral volume, plasma volume, ionization rate coefficient, and plasma confinement time, respectively. The ratio between the neutral and plasma volume represent the neutral screening effect. By charge neutrality, the electron density is;
e D I
I
n =n +
å
nI Z (2.26)And the neutral density is expressed as;
( ) ( { ) ( ) }
( )
{ }
00
1
p v D p n p e
p n v
V V n V V Sn n
dn
dt V V V
y t - + G
= - - (2.27)
where ψ, Γ, and Vvare the deuterium recycling coefficient, the external gas influx per unit volume, and the vacuum vessel volume, respectively. The neutral screening regime is defined by the mean free path of a neutral for ionization by electrons.
The electron power balance is presented as;
33
( ) ( )
( )
3 2
e e
OH ECH Dion Drad equil brem
e
ion line RRE DRE conv
I
d n T
P P P P P P
dt
P P P P P
k = + - + - -
-
å
+ + + - (2.28)Where POHand PECHare ohmic and ECH input power. The PDion,PDrad, Pequil, Pbrem, and Pconv are the power loss of ionization, the radiative loss by deuterium, the energy transfer from electron to ion by Coulomb collision, the bremsstrahlung loss, and convective loss, respectively. The power loss by each impurity species are also defined and the PRRE and PDRE are the power loss by radiative recombination and dielectric recombination, respectively. The ion power balance is simpler than electron;
( )
3 2
i i i
equil CX conv
d n T
P P P
dt
k = - - (2.29)
where PCX is the charge exchange power loss. Generally the energy confinement time of electron and ion for convective power loss are assumed to be identical.
The plasma current is modeled by RL-circuit approximation;
p p p
dI V R I
dt L
= - (2.30)
Here, the plasma inductance is calculated by plasma geometry and the internal inductance of 0.5 with assumption of flat current density profile, and the plasma resistance is solved with plasma parameters. The externally applied voltage is came from the magnetic field simulation.
The detailed physical models to solve the equation (2.25) to (2.30) are different to each codes. For example, as an energy confinement time after closed
34
Figure 2.5 Validation of DYON simulator with JET start-up plasma parameters [40].
35
surface formation, TECHP0D, SCENPLINT, and DYON use Alcator-INTOR scaling [43], combination between the Bohm and the ITER L-mode scaling [30], and the Bohm diffusion model described in [44], respectively. Nowadays, the DYON code was validated with JET ILW (ITER like wall condition) experiments [41] and applied to predict the ITER start-up to estimate the operation window, especially ECH required power [42]. The validation result of DYON with JET experiments are presented in figure 2.5.
TECHP0D, developed for KSTAR initial ECH-assisted start-up. ECH power absorption fraction is calculated with plasma parameters based on[45] and the applied formalism is well described in [39]. The absorbed power to the plasma is;
0 1 o x
ECH o x
P =P éë - f e-h - f e-h ùû (2.31)
where P0 is injected ECH power, and the ηo and ηx are the dimensionless optical depth of ordinary and extraordinary mode. The foand fxare the fraction of ordinary and extraordinary power. The optical depth of fundamental modes are given by;
( )
2 0 e e 1 1 2 0.5 1
o
c
R T n m n n
h p a a
l
é ù-
= - ë + P - û (2.32)
( ) ( )
2 0 e 2 2 1.5 1 2 1
x
R T n m
h p a a a
l
= P - + - (2.33)
where λ, m, nc, α, n∥ are the free-space wavelength of injected EC, the electron mass, the cutoff density, the ratio of electron density and cutoff density, and the
36
parallel reflective index, respectively. With Nth-order harmonic case, the optical depth derived by the quasi-linear Fokker-Planck equation and the cold plasma dispersion relation is expressed as;
( )
( )( )
( ) ( )
2 2 2
2 3
,
, 2 2
2 2 2
,
2 2
2 2 2 2
,
2 1 ! 2
,
N
O X e
O X e
O X
O X
n N T T
R N
mc N mc
S D n P n n o x
D P n n S n
h p
l a
-
^
^
^
æ ö
= - ççè ÷÷ø
é - - - ù
ë û
´ ^
- + P -
(2.34)
where S, D, Pare defined as;
2 2 2
2 2 2 2
1 1
1
pe
ce
S N
N
w w a
w w w
æ ö æ ö
= - çè - ÷ø= - çè - ÷ø (2.35)
2
1 pe2 1
P w
w a
= - = - (2.36)
2
2 2 2 2 1
pe ce
ce
D N
N
w ww a
w w w
æ ö æ ö
= - çè - ÷ø= - çè - ÷ø (2.37)
and the perpendicular reflective index, n⊥, is defined by;
2 2 4
2
B B AC
n^ A
- ± -
= (2.38)
The plus sign is corresponding to the ordinary mode and the minus sign to extraordinary mode.
37
2.3. Poloidal field structure effect to ECH-assisted start-up
The vertical component of poloidal magnetic field makes improved plasma confinement during the pre-ionization phase before applying the loop voltages. Modeling about the vertical field effect are first derived in [24]. In this research, the particle loss along the magnetic field line and the ExB drift loss to the outward radial direction are considered.
The applied vertical magnetic field can moderate the ExB loss, but worsen the magnetic field parallel loss. The electric field E, derived by the charge separation with gradient motion by magnetic field gradient and curvature, can be neutralized by the current flowing along the pitched magnetic field line. But the magnetic connection length is shorten by vertical magnetic field and the plasma loss along the magnetic field line is increased. Therefore, there is optimum vertical magnetic field.
To estimate the optimal vertical field strength, simple particle loss model is applied. With vertical magnetic field, the parallel electric field to magnetic field, Eparallelcan generate current along the magnetic field line. The terminal velocity of electrons determined by the electric field and collision with background neutral is given by;
e ea
v eE mn
= P
P (2.39)
where me, and νea are electron mass and collision frequency of the electron and neutral atoms. With small magnetic pitch of Bv/Bt≪1, the vertical velocity of the
![Figure 1.2 The experimental results in FTU tokamak with different ECH injection mode (a), and the poloidal magnetic field structure at the error field of 85 G (b) [20].](https://thumb-ap.123doks.com/thumbv2/123dokinfo/11720565.0/23.799.170.651.113.916/figure-experimental-results-different-injection-poloidal-magnetic-structure.webp)
![Figure 1.3 Time evolution of plasma parameters with five different phases of ECH- ECH-assisted start-up (a), and 2-dimensional magnetic field configuration of -40 G vertical field case (b) [16].](https://thumb-ap.123doks.com/thumbv2/123dokinfo/11720565.0/25.799.181.625.112.902/evolution-parameters-different-assisted-dimensional-magnetic-configuration-vertical.webp)
![Figure 1.4 Pre-ionization plasma density and temperature profiles at the mid-plane under the magnetic field of pure TF, TPC, and FNC (a), and plasma start-up performance of TPC and FNC (b) in VEST [26].](https://thumb-ap.123doks.com/thumbv2/123dokinfo/11720565.0/27.799.140.666.128.905/figure-ionization-plasma-density-temperature-profiles-magnetic-performance.webp)
![Figure 1.5 The various poloidal magnetic field structure (a), and the ECH plasma images (b) for inter-shot wall conditioning in KSTAR [27].](https://thumb-ap.123doks.com/thumbv2/123dokinfo/11720565.0/29.799.137.612.106.918/figure-various-poloidal-magnetic-structure-plasma-images-conditioning.webp)
![Figure 2.3 Schematic of tokamak and electromagnetic field structure during start-up phase [31].](https://thumb-ap.123doks.com/thumbv2/123dokinfo/11720565.0/42.799.138.636.482.858/figure-schematic-tokamak-electromagnetic-field-structure-start-phase.webp)
![Figure 2.5 Validation of DYON simulator with JET start-up plasma parameters [40].](https://thumb-ap.123doks.com/thumbv2/123dokinfo/11720565.0/50.799.136.678.97.958/figure-validation-dyon-simulator-jet-start-plasma-parameters.webp)