저작자표시-비영리-변경금지 2.0 대한민국 이용자는 아래의 조건을 따르는 경우에 한하여 자유롭게
l 이 저작물을 복제, 배포, 전송, 전시, 공연 및 방송할 수 있습니다. 다음과 같은 조건을 따라야 합니다:
l 귀하는, 이 저작물의 재이용이나 배포의 경우, 이 저작물에 적용된 이용허락조건 을 명확하게 나타내어야 합니다.
l 저작권자로부터 별도의 허가를 받으면 이러한 조건들은 적용되지 않습니다.
저작권법에 따른 이용자의 권리는 위의 내용에 의하여 영향을 받지 않습니다. 이것은 이용허락규약(Legal Code)을 이해하기 쉽게 요약한 것입니다.
Disclaimer
저작자표시. 귀하는 원저작자를 표시하여야 합니다.
비영리. 귀하는 이 저작물을 영리 목적으로 이용할 수 없습니다.
변경금지. 귀하는 이 저작물을 개작, 변형 또는 가공할 수 없습니다.
이 학 석 사 학 위 논 문
Trailing genomic signature to discover substantial information in genome data
using bioinformatics approaches
생물정보학적 접근방법을 이용한 유전적 표지인자 탐색과 유전체데이터의 유용한 정보 발굴
2016 년 2 월
서울대학교 대학원 협동과정 생물정보학과
정 현 수
Trailing genomic signature to discover substantial information in genome data
using bioinformatics approaches
By
Hyeonsoo Jeong
Supervisor: Professor Heebal Kim
Feb, 2016
Interdisciplinary Program in Bioinformatics
Seoul National University
생물정보학적 접근방법을 이용한 유전적 표지인자 탐색과 유전체데이터의 유용한 정보 발굴
지도교수 김 희 발
이 논문을 이학석사 학위논문으로 제출함 2015 년 12 월
서울대학교 대학원
생물정보협동과정 생물정보학과 정 현 수
정현수의 이학석사 학위논문을 인준함 2015 년 12 월
위 원 장 김 선 (인)
부위원장 김 희 발 (인)
위 원 조 서 애 (인)
4
Abstract
Trailing genomic signature to discover substantial information in genome data
using bioinformatics approaches
Hyeonsoo Jeong Interdisciplinary Program in Bioinformatics Seoul National University
These studies are mainly focusing on the deciphering biologically meaningful information in genome sequences of living organisms using bioinformatics techniques.
In chapter 2, I investigate the relationship between genomic composition and Berkshire pig’s meat quality trait by scanning for signatures of positive selection in whole-genome sequencing data.
Berkshire pigs are regarded as having superior meat quality compared to other breeds. As the meat production industry seeks selective breeding approaches to improve profitable traits such as meat quality, information about genetic determinants of these traits is in high demand.
However, most of the studies have been performed using trained
5
sensory panel analysis without investigating the underlying genetic factors. Results revealed several candidate genes involved in Berkshire meat quality; most of these genes are involved in lipid metabolism and intramuscular fat deposition.
In chapter 3, I construct the HGTree: database of horizontally transferred genes determined by tree reconciliation. In Bacteria and Archaea, Horizontal gene transfer (HGT) plays an important role in the acquisition of biological advantages such as virulence factor and antibiotic resistance and provides significant genetic diversity. It is important to have a well-defined database containing precise information about HGT events between Prokaryotes in order to understand prokaryotic evolution and discover genes which have led to adaptive genetic variation through HGT as opposed to processes such as mutation, natural selection, or genetic drift. The HGTree database provides putative genome-wide horizontal gene transfer information for 2,472 prokaryotic genomes by reconciling gene trees against species trees. The tree reconciliation method is considered to be a useful way to detect HGT events but has not been utilized extensively by existing databases because the method is computationally intensive and conceptually challenging. In this regard, HGTree represents a useful addition to the biological community, enabling quick and easy retrieval
6
of information for HGT-acquired genes and better understanding of microbial taxonomy and evolution. The database is freely available and can be easily scaled and updated to keep pace with the rapid rise in genomic information.
Key words: Positive selection, Phylogenetics, Horizontal gene transfer, Tree reconciliation
Student number: 2014-21323
7
Contents
ABSTRACT ... 4
CONTENTS ... 7
LIST OF TABLES ... 9
LIST OF FIGURES ... 10
CHAPTER 1.LITERATURE REVIEW ... 12
1.1 Detecting positive selection ... 13
1.2 Detecting horizontal gene transfer ... 15
CHAPTER 2.EXPLORING EVIDENCE OF POSITIVE SELECTION REVEALS GENETIC BASIS OF MEAT QUALITY TRAITS IN BERKSHIRE PIGS THROUGH WHOLE GENOME SEQUENCING ... 19
2.1 Introduction ... 20
2.2 Material and methods ... 21
2.3 Results ... 27
CHAPTER 3.HGTREE: DATABASE OF HORIZONTALLY TRANSFERRED GENES DETERMINED BY TREE RECONCILIATION ... 54
3.1 Introduction ... 55
3.2 Material and Methods ... 56
3.3 Results ... 62
8
3.4 Discussion ... 67
REFERENCES ... 82 국문초록 ... 97
9
List of Tables
Table 2. 1 The result summary of sequence reads mapping using Bowtie2 (Berkshire). ... 39 Table 2. 2 The result summary of sequence reads mapping using Bowtie2
(Landrace). ... 40 Table 2. 3 The result summary of sequence reads mapping using Bowtie2
(Yorkshire). ... 41 Table 2. 4 List of candidate genes resulted from genome-wide positive
selection scan. ... 42 Table 2. 5 Major candidate genes for meat quality detected from positive
selection scans (XP-EHH and XP-CLR). ... 43 Table 2. 6 The summary statistics of assembled contigs for Berkshire,
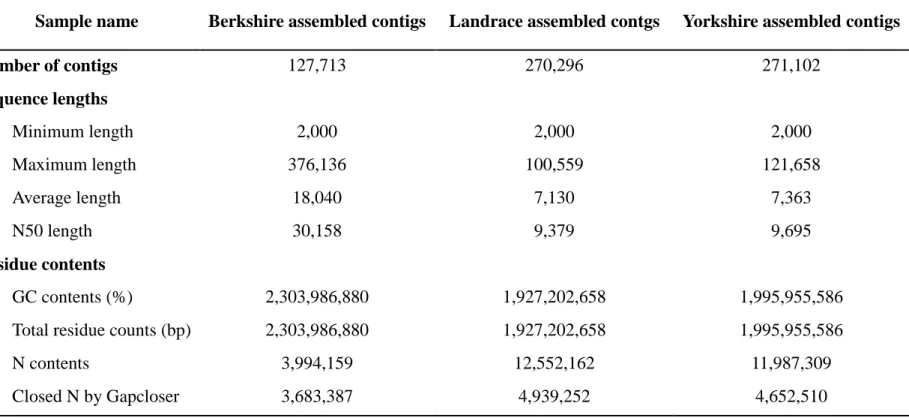
Landrace, and Yorkshire using IDBA_UD. ... 44 Table 2. 7 The result summary of assembled contigs’ repeated and
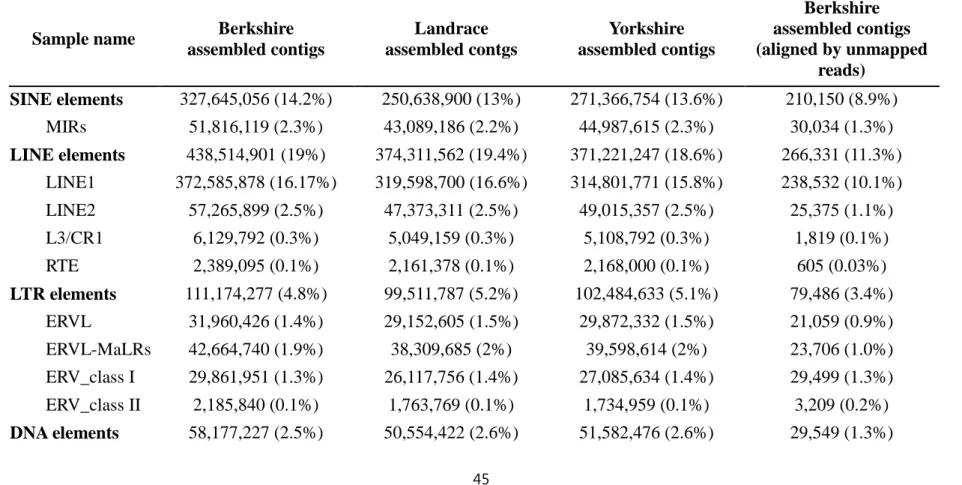
transposable elements for Berkshire, Landrace, and Yorkshire; and Berkshire assembled contigs of which unmapped reads were aligned. ... 45 Table 2. 8 The alignment mapping summary of unmapped sequencing reads to
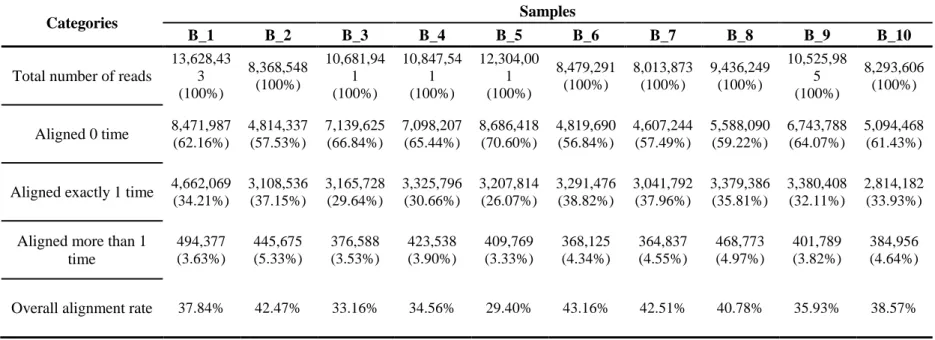
the Berkshire assembled contigs. (The unmapped sequencing reads were defined as the ones that were not mapped to the reference genome and to the Landrace and Yorkshire assembled contigs.) ... 47 Table 2. 9 Predicted gene list related to meat quality from Berkshire specific
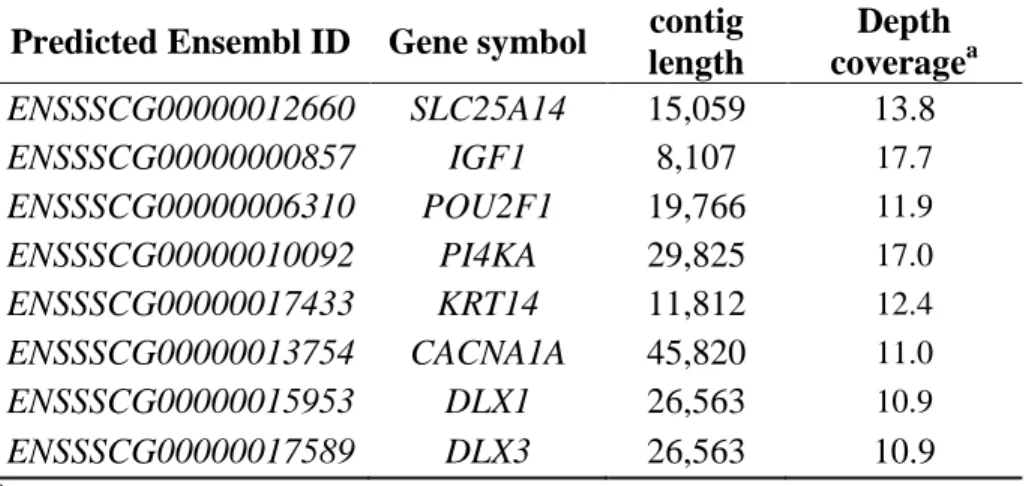
aligned contigs. ... 48
Table 3. 1 Number of Phyla of Bacteria and Archaea complete genomes involved in the HGTree. ... 74 Table 3. 2 Summary statistics ... 76 Table 3. 3 Processing time required for genomes of varying sizes. ... 77
10
List of Figures
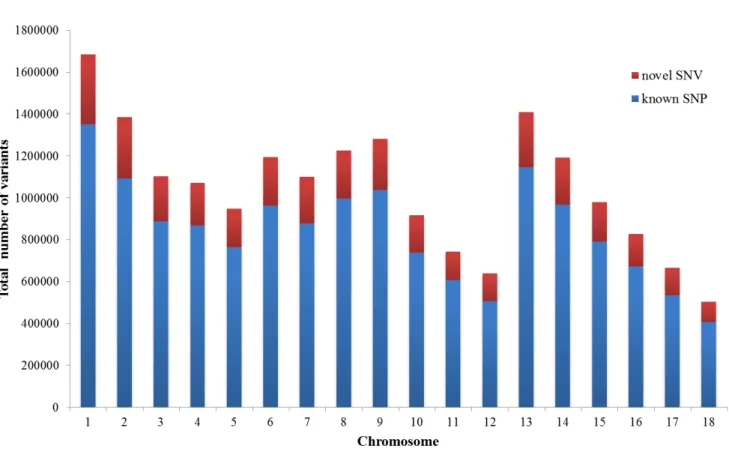
Figure 2. 1 The distributions of novel SNV and known SNP in each
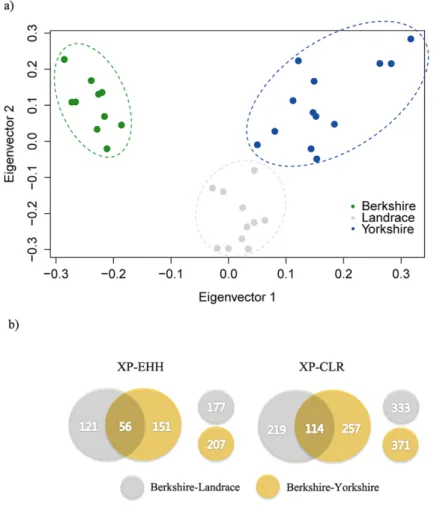
chromosome. ... 49 Figure 2. 2 (a) Results of principal component analysis (PCA) of Berkshire,
Landrace, and Yorkshire breeds. Eigenvector1 (x-axis) versus
Eigenvector2 (y-axis). Both Eigenvector1 (15.7% of the total variance) and Eigenvector2 (13.7% of the total variance) indicate proportion of variance. (b) Summary of gene sets identified from statistical analyses (XP-EHH and XP-CLR) of Berkshire tested against Landrace and Yorkshire breeds. ... 50 Figure 2. 3 Results of two statistical analyses (XP-EHH and XP-CLR) are
plotted across the genome. (a) Results of XP-EHH analyses and (b) Results of XP-CLR with Berkshire pigs against Landrace pigs or Yorkshire pigs for detection of positive selection signature. Each dot represents the maximum score in the non-overlapping 25kb genomic region. ... 51 Figure 2. 4 Results of Fisher’s exact test for detection of specific enriched
sites on ICAM2 gene (see Figure S2-3 for other candidate genes). The X- axis represents the order of the detect variants in ICAM2 gene based on the reference genome. The Y-axis represents −𝑙𝑙𝑙𝑙𝑙𝑙10(𝑝𝑝 − 𝑣𝑣𝑣𝑣𝑙𝑙𝑣𝑣𝑣𝑣). The presence or absence of Indels is labelled as Y's and N's, respectively in each breed. The upper red dotted-line represents the Bonferroni cut-off line (5% significance level) and the lower red dotted-line represents the 5%
significance level without multiple testing corrections. ... 52 Figure 2. 5 The overall reads mapping rate of assembled contigs for each
breed and reference genome by aligning the total sequence reads of each Berkshire sample. ... 53
Figure 3. 1 Workflow of the HGTree analysis pipeline. See Material and Methods and main text for detailed description and filtering criteria. ... 78 Figure 3. 2 Screenshots of HGT Browser functionality in HGTree. (A) Users
can either search for their genome of interest or navigate through the
‘Taxonomic Tree’. Upon selection of genome(s), list of HGT-related genes are displayed at the bottom. (B) Tables display basic information about all genes that have participated in HGT events. (C) Plots display donors and recipient genomes in each HGT event, as well as both the
11
gene and species trees. (D) Users can query their sequences against pre- compiled datasets for NJ reconstruction. ... 79 Figure 3. 3 Microbial genomes as viewed by HGTree. (A) Each triangle in the
scatter-plot represents one microbial genome. The fitted regression line (blue) (y = -44.31 + 0.33X; 𝑅𝑅2 = 0.81) describes a linear relationship between the number of HGT-related genes and the total number of genes in each genome. The grey area around the regression line indicates standard error. The red-dotted line excludes organisms that fall in the upper and lower 5% percentiles of HGT-index. (B) Boxplots show the distribution of HGT-index values for organisms in each major microbial phylum in our dataset. The horizontal red line represents the global median HGT-index value (0.3). Phyla are sorted in descending order based on their median HGT-index. ... 80
12
Chapter 1. Literature Review
13
1.1 Detecting positive selection
1.1.1 Signature of positive selection
Positive selection, also known as directional selection, is a type of natural selection in which a specific phenotype is dominant in population. Under positive selection, the allele that increases reproductive and survival fitness become fixed over time in a specific population. It is well known that positive selection plays an important role in the history of mammals. Therefore, finding positively selected regions in animals which have a unique phenotypic trait can help clarifying the role of a genomic region and its function (Bowcock, Kidd et al. 1991, Sabeti, Reich et al. 2002, Sabeti, Schaffner et al. 2006).
Recently, it has been shown that using a distorted pattern of genetic variation between populations can be useful for detecting selection related to specific traits. For example, genetic signals of selection discovered several genes in cattle responsible for milk production (Qanbari, Pimentel et al. 2010). Also, Pollinger et al. identified rapid phenotypic diversification unique to the domestic dog (Pollinger, Lohmueller et al. 2010), and Moradi et al. revealed three regions associated with fat deposition in thin and fat tail sheep breeds (Moradi, Nejati-Javaremi et al. 2012).
14
1.1.2 Methods for detecting positive selection
One of the underlying concepts of detecting positive selection has been based on searching for a region where genetic diversity was decreased in a large region. This distorted pattern of genetic variation (so-called selective sweep) plays an essential role in detecting a unique characteristic of the certain population (Sabeti, Schaffner et al. 2006).
There are several methods to detect signature of positive selection from the genetic data. 1) reduction in genetic diversity (reduced level of heterozygosity), 2) high frequency derived allele (a skew in the allele frequency distribution), 3) long-range association with other alleles, and 4) differences between populations.
The cross-population extended haplotype heterozygosity test (XP- EHH) measures signals of ongoing or nearly fixed selective sweeps by analyzing haplotypes between two populations (Sabeti, Varilly et al.
2007). This approach is known to be a strong statistical test detecting positive selection occurred in a short period of time. Also, another statistical method for identifying signals of selective sweep is the cross- population multiple-locus composite likelihood ratio test (XP-CLR), which is detecting multi-locus allele frequency differentiation between two populations (Chen, Patterson et al. 2010).
15
1.2 Detecting horizontal gene transfer
1.2.1 Horizontal gene transfer
Vertical inheritance refers to transfer of genetic information from parents to offspring. Vertically inherited genes typically show higher degree of similarity between organisms and species that are closely related than those that are distantly related. This aids in reliable recognition of species and understanding their classification and evolution. For example, ribosomal RNA genes have been historically used to determine the taxonomic structure of cellular life (Woese 1987).
However, vertical signal can sometimes be confounded by acquisition of genes from other sources such as environmental, viruses, or via direct interactions between organisms. Recent advances in genomics have confirmed the existence of ‘foreign’ genes embedded in cellular genomes. For example, mammalian genomes are enriched with viral- like genetic elements, constituting up to 8% of the human genome (Griffiths 2001). Similarly, many microbial genomes possess genes acquired from multiple sources (Doolittle 1999). This phenomenon is referred to as horizontal gene transfer (HGT), which is a natural
16
outcome given the numerous ways species interact with each other and occupy common habitats.
HGT allows gain of novel molecular functions and can (sometimes) provide selective evolutionary advantages to species. For example, transfer of antibiotic resistance genes and virulence factors between bacterial species posits significant challenges to human health (Salyers, Gupta et al. 2004). Similarly, transfer of genes involved in response to heat and cold shock and heavy metal and ultra-violet resistance facilitates bacterial adaptation to certain environments. While HGT is an important force driving the evolution of (especially) microbial organisms (Koonin, Makarova et al. 2001), it can complicate interpreting the true evolutionary history of species and lead to erroneous interpretations regarding their classification and community interactions (Doolittle 1999). Therefore, it is crucial to distinguish between vertically and horizontally acquired genes in genomes when studying deep evolutionary relationships.
1.2.2 Methods for detecting HGT events and their limitations
Accurate detection of HGT remains a computational and conceptual challenge. Existing databases such as HGT-DB (Garcia-Vallvé,
17
Guzmán et al. 2003) and DarkHorse HGT Candidate Resource (Podell, Gaasterland et al. 2008) use genomic signatures (i.e. GC bias, nucleotide composition, and codon usage) and implicit phylogenetic methods (i.e. comparing evolutionary distance inferred from sequence similarity) to detect HGT. Because genomic signatures of transferred genes may lose their ‘distinctiveness’ over long periods of evolutionary time and tend to be highly similar to host genomes in cases of HGT between very closely related organisms, these methods likely have a high rate of false-positive and negative predictions (Guindon and Perriere 2001, Lawrence and Ochman 2002). Moreover, GC composition within the same genome may fluctuate considerably for different genomic regions (Deschavanne and Filipski 1995, Wuitschick and KARRER 1999) and (even) for some vertically inherited genes (e.g.
ribosomal proteins) (Muto and Osawa 1987), leading to erroneous inferences. In turn, implicit phylogenetic methods are limited by their reliance on similarity scores and underlying phylogeny. This poses another problem since statistically significant sequence similarity is not necessarily a result of vertical evolution (Koski and Golding 2001, Ravenhall, Škunca et al. 2015). Because genes acquired from foreign sources typically do not show congruence to species trees, one way to detect HGT would be to reconcile gene trees against reference species
18
trees. This principle is based on an explicit evolutionary model and is generally considered to be a reliable alternative to detect HGT events (Ragan 2001). However, its practical use has remained limited because reconciling trees is computationally intensive (Ravenhall, Škunca et al.
2015) and because tree incongruence can also arise from processes other than HGT (Than, Ruths et al. 2007) (see also Discussion in Chapter 3).
19
This chapter was published in BMC Genetics as a partial fulfillment of Hyeonsoo Jeong’s M.Sc. program.
Chapter 2. Exploring evidence of
positive selection reveals genetic basis of
meat quality traits in Berkshire pigs
through whole genome sequencing
20
2.1 Introduction
The domestic pig, Sus scrofa domestica, has been an important food source throughout human history. In addition to undergoing natural selection due to various environmental factors, pig breeds have gone through intensive artificial selection in order to increase economically important traits such as reproduction, growth rate, stress resistance, and meat quality (Hazel 1943). For example, studies have shown that modern Landrace and Yorkshire breeds were positively selected to improve both reproduction and lactation ability for economic traits (Serenius, Sevón-Aimonen et al. 2004).
Berkshire pigs have been renowned for their superior meat quality since their meat contains a great proportion of neutral lipid fatty acids and marbling fat (Wood, Nute et al. 2004) which is important for palatability characteristics such as tenderness and juiciness. This breed has been intensively selected for meat quality in recent centuries, especially in East Asia where it is marketed as black pork at a premium price. Therefore, Berkshire has become specialized for high quality meat production and relative lack of boar taint following strong artificial selection for these traits. While several studies have investigated genetic factors relating to meat quality in Berkshire pigs (Suzuki, Shibata et al. 2003, Jeong, Choi et al. 2010, Lee, Choi et al.
21
2010, Kang, Choi et al. 2011), most of the research is performed in the traditional way using trained sensory panel analysis without investigating underlying genetic factors.
Thus, identifying genetic regions that are positively selected especially in Berkshire breed might allow us to reveal genetic variation related to phenotypic trait. In this study, whole genome sequencing of Berkshire, Landrace, and Yorkshire breeds was conducted to identify genomic variants. I performed two statistical analyses, the cross- population extended haplotype homozygosity test (XP-EHH) and the cross-population composite likelihood ratio test (XP-CLR), to determine signals of selection in Berkshire breed. In addition, I performed a Fisher’s exact test for detection of breed specific amino acids or Indels, which are specifically enriched and affected by positive selection. Finally, Berkshire specific aligned reads were separately analyzed to detect the genomic difference between Berkshire and other breeds using de novo short sequencing reads assembly.
2.2 Material and methods
Ethics statement
22
The experiment and all its procedures were approved by the regional Ethical Committee (JNU Animal Bioethics committee permit number:
2013-0009).
Sample preparation and whole genome re-sequencing
For genomic DNA extraction, tissue and blood samples were collected from 10 female Berkshire pigs. Berkshire tissue samples were collected from a local pig breeding company in Namwon, Korea. To generate inserts of ~300 bp, 3µg of genomic DNA was randomly sheared using Covaris System. The TruSeq DNA Sample Prep. Kit (Illumina, San Diego, CA) was used for library construction by following the manufacturer’s guidelines. Whole genome sequencing was performed on the Illumina HiSeq 2000 platform. Whole-genome sequence data of 11 Landrace (Danish) and 13 Yorkshire (Large White) pigs was obtained from NCBI Sequence Read Archive database under accession number SRP047260. FastQC (Andrews 2010) software was used to perform a quality check on raw sequence data. Using Trimmomatic- 0.32 (Bolger, Lohse et al. 2014), potential adapter sequences were removed prior to sequence alignment. Paired-end sequence reads were mapped to the pig reference genome (Sscrofa 10.2) from the Ensembl database using Bowtie2 (Langmead and Salzberg 2012) with default settings.
23
For downstream processing and variant-calling, I used open-source software packages: Picard tools (http://picard.sourceforge.net), SAMtools (Li, Handsaker et al. 2009), and Genome Analysis Toolkit (GATK) (McKenna, Hanna et al. 2010). “CreateSequenceDictionary”
and “MarkDuplicates” Picard command-line tools were used to read reference FASTA sequence for writing bam file with only sequence dictionary, and to filter potential PCR duplicates, respectively. Using SAMtools, index files for the reference and bam files were created.
Local realignment of sequence reads was performed to correct misalignment due to the presence of small insertion and deletion using GATK “RealignerTargetCreator” and “IndelRealigner” arguments. Also, base quality score recalibration was performed to get accurate quality scores and to correct the variation in quality with machine cycle and sequence context. For calling variants, GATK “UnifiedGenotyper” and
“SelectVariants” arguments were used with the following filtering criteria. All variants with 1) a Phred-scaled quality score of less than 30;
2) read depth less than 5 ; 3) MQ0 (total count across all samples of mapping quality zero reads) > 4; or a 4) Phred-scaled P-value using Fisher’s exact test more than 200 were filtered out to reduce false positive calls due to strand bias. “vcf-merge” tools of VCFtools (Danecek, Auton et al. 2011) was used in order to merge all of the
24
variants calling format files for the 34 samples. BEAGLE software (Browning and Browning 2007) was used to conduct the haplotype phasing for the entire set of pig populations.
Population stratification
I used Genome-Wide Complex Trait Analysis (GCTA) (Yang, Lee et al. 2011) to calculate eigenvectors which are equivalent to those estimated by the EIGENSTRAT software tool for principal component analysis (PCA). Autosomal genotype data was converted to PLINK (Purcell, Neale et al. 2007) format, the input format required for GCTA, using VCFtools.
Statistical analysis
Two methods were employed to infer positive signatures in Berkshire population. Firstly, XPEHH software (Sabeti, Varilly et al. 2007), which measures cross-population extended haplotype homozygosity, was used to detect signatures of positive selection. I calculated EHH and the log ratio of the integrated haplotype homozygosity (iHH) for the pairwise test of Berkshire and other breeds for each of the SNP loci.
An extreme value of XP-EHH suggests selection in Berkshire breed.
Log ratios was standardized using R (Ihaka and Gentleman 1996), and divided the genome into consecutive, non-overlapping 25 kb windows.
25
The SNP with the maximum XP-EHH value was selected to represent the summary statistics for each window. To define empirical P-value, I considered the number of SNPs in each window, and binned genomic windows according to the numbers of SNPs in increments of 200 SNPs.
When a window encompassed more than 600 SNPs, I combined all the windows (> 600 SNPs) into one bin. An empirical P-value for each window was defined based on its ranking of summary statistics in its bin following the protocol of previous studies (Granka, Henn et al.
2012, Lee, Kim et al. 2014). I assigned all of the regions with an empirical P-value less than 0.01 as the candidate regions which were positively selected in Berkshire breed.
Next, the cross-population composite likelihood ration test (XP-CLR) (Chen, Patterson et al. 2010) was performed using the XP-CLR software package with non-overlapping windows of 25 kb. Windows with a XP-CLR value in the top 1% of the empirical distribution were designated as candidate regions. Genes located in the regions under significant selection were annotated.
Additionally, two types of Fisher’s exact tests were performed using a 2x2 contingency table for detecting breed specific amino acid or Indel.
Firstly, a specific amino acid enrichment test was performed using a contingency table composed of two factors such as specific breed
26
(Berkshire / other ) and specific amino acid information (‘specific amino acid’ / other). I performed the statistical test 3 (Berkshire, Landrace and Yorkshire) * k * n times on each of amino acid position in the targeted gene, where k is the number of existing different type of amino acid on each position, and n is number of site in targeted gene.
Secondly, a specific Indel enrichment test was performed on the table composed of specific breed information and Indel existence (Yes / No) in each of positions on targeted gene. This statistical test was also performed 3*2*n times on each position. Using these tables, a Fisher’s exact test was performed with the alternative hypothesis that the odds ratio is greater than 1. The two types of statistical tests, for non- synonymous SNP and Indel, respectively, calculate cumulative type-1 error through individual statistical tests. The Bonferroni correction method was employed for considering multiple testing problems in the enrichment test.
Short reads assembly using NGS sequence reads
To eliminate possible sequencing errors, I used “Error correction”
module of Allpaths-LG (Gnerre, MacCallum et al. 2011) with default settings. Error corrected paired-end reads were merged to FASTA format using “Fq2fa” module from IDBA v1.1.1 software (Peng, Leung et al. 2012) which stands for iterative De Bruijn graph De novo
27
assembler for short reads sequencing data with highly uneven sequencing depth. I assembled error corrected paired-end reads using IDBA_UD from IDBA package with the following parameters: 1) Perform pre-correction before assembly (“--pre_correction”), and 2) minimum k value should be more than 30 (--mink 30). Using Gapcloser (Luo, Liu et al. 2012), predicted gaps were filled in the assembled sequences with a default setting.
In order to identify genomic regions unique to the Berkshire population, I defined sequence reads which unaligned to the reference genome and Landrace/Yorkshire assembled contigs but aligned to the Berkshire assembled contigs using Bowtie2 (Langmead and Salzberg 2012). Among the total Berkshire assembled contigs, contigs with an average mapping depth of sequence reads resulted from the previous process of over 10 in common between every Berkshire samples were defined as the candidate region. RepeatMasker (Tarailo‐Graovac and Chen 2009) was used to screen DNA sequences for interspersed repeats and low complexity DNA sequences before gene prediction for the candidate contigs.
2.3 Results
28
DNA sequencing and whole genome re-sequencing
The whole genomes of 10 Berkshire, 11 Landrace, and 13 Yorkshire pigs were sequenced to an approximate coverage of 11.68-fold on average, with a total of 1,201,160,368,944 bp in 11,981,734,530 reads after removing potential adapter sequence using Trimmomatic-0.32.
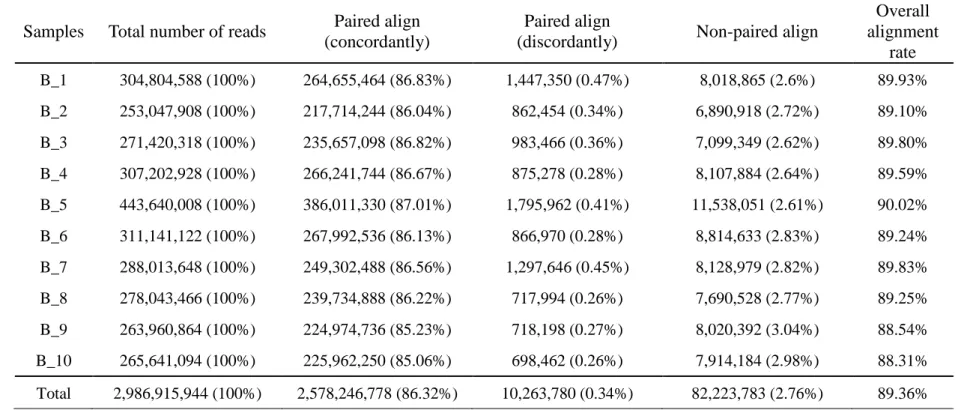
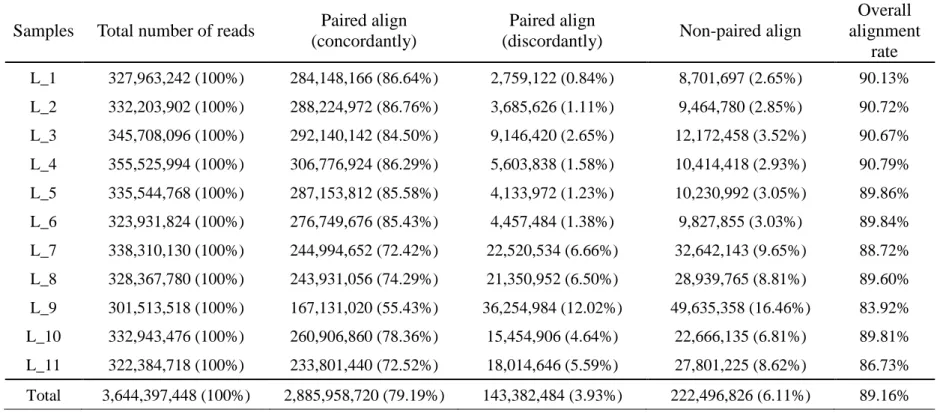
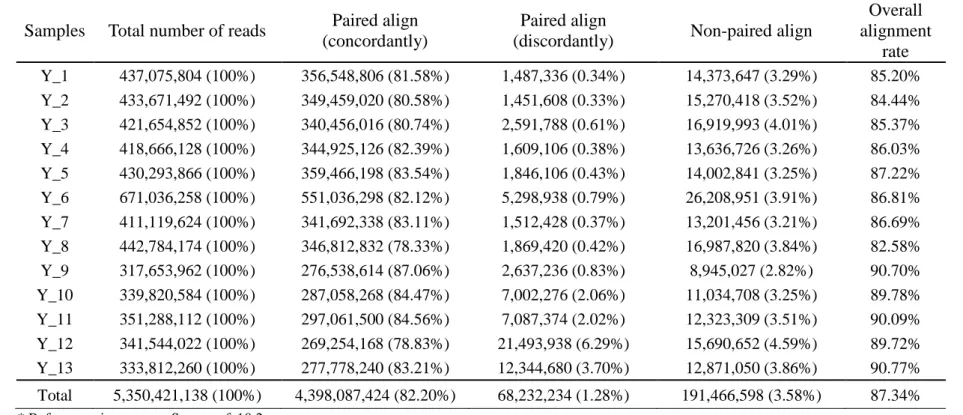
Sequence reads of each breed were aligned to the pig reference genome (Sus scrofa 10.2) from the Ensembl database using Bowtie2, and 88.46 % of the sequence reads were aligned to the reference sequence (Table 2.1-3). After removing PCR duplicates and recalibrating base quality, 18,886,809 single nucleotide variants (SNVs) and 3,384,566 Indels were retained. Of the total SNVs, although 15,237,076 SNVs (80.7%) have been already reported previously to dbSNP (Sus scrofa 10.2.74;
ftp://ftp.ensembl.org/pub/release-
74/variation/vcf/sus_scrofa/Sus_scrofa.vcf.gz), 3,649,733 SNVs were defined as novel variants (19.3%). The distributions of both types of SNVs in each chromosome are shown in Figure 2.1.
Population Stratification
Using genome-wide complex trait analysis (GCTA), I performed principal component analysis (PCA) of the whole autosomal genotype loci (SNP; n = 18,802,810) to characterize the pattern of individual samples. The analysis revealed structurally cleared difference between
29
populations. As shown in Figure 2.2(a), the first eigenvector (15.7% of the total variance) separated Berkshire from other breeds, and Landrace and Yorkshire pigs were divided by the second eigenvector (13.7% of the total variance).
Signatures of selection in the Berkshire breed
To detect signals of positive selection in Berkshire against other breeds, I used two statistical analysis methods in order to achieve maximum statistical power for localizing the source of selection. I first used the cross-population extended haplotype homozygosity (XP-EHH) statistic to make comparisons between Berkshire and other breeds (Landrace and Yorkshire). This statistic is originally designed to estimate alleles that have increased in frequency to the point of fixation or near-fixation in one of the populations and assesses haplotype differences between two populations (Simonson, Yang et al. 2010). To make comparisons of genomic regions across populations, I divided the genome into consecutive, non-overlapping segments of 25 kb. Among the total of 98,037 windows, the maximum XP-EHH score was assigned in each segment as the window statistic. Giving consideration to the number of SNPs in each segment, the test statistic was converted to an empirical p-value based on its rank of XP-EHH score. Those that yielded significant values (P < 0.01) were identified as positively
30
selected regions (Figure 2.3(a)). A total of 177 and 207 genes were identified as positive signatures from XP-EHH test in Berkshire breed against to Landrace and Yorkshire breed, respectively (Figure 2.2(b)).
I also ran a cross-population composite likelihood ratio test (XP-CLR) to search for the genomic regions where the changes in allele frequency at the locus occurred very fast due to random drift. XP-CLR is a multi- locus sliding window test which is robust to ascertainment bias in SNP discovery (Chen, Patterson et al. 2010). XP-EHH and XP-CLR were used to detect signatures of selective sweeps by comparing signals from two populations. However, while the XP-CLR test considers the variation of allele frequency using the differentiation of multi-locus allele frequency between two populations, the XP-EHH test aims primarily to identify differentially overrepresented haplotypes between two populations. In addition, combining the results from two different statistical analyses provides more powerful information than results from one test alone. The whole genome area was divided into non- overlapping windows of 25 kb as before. All windows above a threshold of 216.23 and 257.06 (top 1% of the empirical distribution) were defined as significant regions (Figure 2.3(b)), and identify 333 and 371 positively selected genes in Berkshire compared to Landrace, and to Yorkshire, respectively (Figure 2.2(b)).
31
Identification and analysis of positively selected genes in Berkshire While selective traits are likely to be detected among various regions, I focused specifically on the meat quality specific to the Berkshire breed. The amount of fat and fatty acid in adipose tissue or muscle as well as the muscle fiber characteristic plays an important role in meat quality (Wood, Nute et al. 2004). To identify genomic regions associated with meat quality in Berkshire, I detected candidate genes using two statistics (XP-EHH and XP-CLR) comparison between Berkshire and mother breeds (Landrace and Yorkshire) which are superior in maternal performance farrowing and raising large litters of pigs (Johnson and Omtvedt 1973, Hanenberg, Knol et al. 2001).
Landrace and Yorkshire purebreds are well-known for their reproductive performance. In particular, Yorkshire pigs are noted for slow growth compared to Landrace or Berkshire pigs. When I compared the genes detected from statistical analyses of B-L and B-Y, a considerable number of common genes related to growth performance in the results of B-Y but not in the results of B-L (WNT2, FGF14, PTPN11, FXYD2, APBB1, ACAP1, NET1, NF2, and KCTD11).
I observed 56 genes (Table 2.4) overlapped among the 177 and 207 resulting from comparisons between Berkshire and Landrace breeds and between Berkshire and Yorkshire breeds using XP-EHH analysis,
32
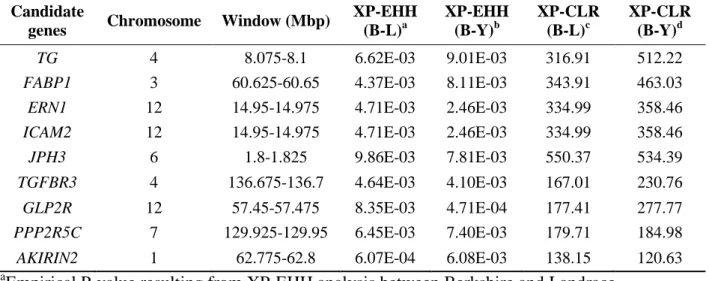
respectively (Figure 2.2(b)). The positively selected gene list included FABP1 and TG. These results suggest that several genomic regions and genes may have been selected for meat quality in Berkshire pigs (Table 2.5). Fatty acid-binding protein1 (FABP1) also known as liver fatty acid-binding protein (L-FABP) is a member of the FABP multi-gene family expressed in both the liver and small intestine (Chmurzyńska 2006). It has been suggested that L-FABP gene, which has an effect on uptake, transport, mitochondrial oxidation, and esterification of fatty acids, were strongly related to meat quality in previous study (Atshaves, McIntosh et al. 2004, JIANG, LI et al. 2006, Wang, Shu et al. 2007).
Thyroglobulin (TG) gene, encoding to produce the precursor for thyroid hormones, affects adipocyte growth, differentiation and homeostasis of fat deports (Rosenfeld, Mermod et al. 1983). Many studies have shown that TG is significantly associated with meat quality traits. (Barendse, Bunch et al. 2004, Burrell, Moser et al. 2004, Fortes, Curi et al. 2009, Smith, Thomas et al. 2009). AKIRIN2, a homolog of the Akirin protein, is relevant to the control of skeletal myogenesis through up-regulation of muscle specific transcription factors (Chen, Huang et al. 2013); it is also negatively regulated by cytokine such as myostatin, which plays an important role in skeletal myogenesis (Marshall, Salerno et al. 2008). In a previous study, Sasaki et al. detected a SNP in the 3’ untranslated
33
region of the AKIRIN2 is associated with marbling in Japanese Black beef cattle (Sasaki, Yamada et al. 2009). The high proportion of marbling, which is defined by the amount and distribution of intramuscular fat (IMF), exceedingly improve the palatability by affecting the taste and tenderness of the meat. Also, a SNP located in an intron region of Glucagon-like peptide 2 receptor (GLP2R) is significantly associated with IMF according to a previous study (Luo, Cheng et al. 2012). Transforming growth factor β3 (TGF-β3), a secreted protein, is related with the mammalian target of rapamycin (mTOR) pathway, which has been renowned as significantly associated with muscle mass and strength (Park, Jacobsson et al. 2006). Although its specific mechanism is not well understood, it is clear that TGFBR3 plays a role in the muscular or adipose tissue development (Cánovas, Quintanilla et al. 2010). Also, Chen at el. recently discovered a SNP in TGF-β1/2/3 had an effect on myofiber diameter (Chen, An et al. 2013).
Berkshire has been renowned to have smaller cross-sectional area and high density muscle fiber compared to other breeds (Jeong, Choi et al.
2010). Many studies have shown the relationship between the composition of myofiber type and pork quality (Lebret, Le Roy et al.
1999), and this result is at the base of the fact that Berkshire pork has a tremendous tenderness and juiciness. Also, JPH3, PPP2R5C, USP25,
34
and ACTN2 were associated with boar taint (Ramos, Duijvesteijn et al.
2011), IMF, tenderness (Hamill, McBryan et al. 2012), and cooking loss (Li, Kim et al. 2011), respectively.
To explore deep into the phenotypic traits of Berkshire breed, I further investigated the 114 genes (Table 2.4) observed using XP-CLR (Figure 2.2(b)). 13 genes intersected with the results from XP-EHH selection candidate genes (Table 2.4). Interestingly, these genes included FABP1, TG, ERN1, JPH3, and ICAM2 (Shin and Chung 2007, Chang, Yeh et al.
2008, Qiu, Ni et al. 2008, Sen, Jumaa et al. 2013).
In addition to genes responsible for meat quality traits, our genome- wide selection scan also identified genes associated with immune response, particularly regulation of leukocyte and immunoglobulin (CD79B, CD8B, FLT3, ICAM2, IFNGR1, and IGSF5). Berkshire pigs have an unusually high concentration of plasma immunoglobulin as opposed to the other breeds, as evidenced by distinctive high percentages of neutrophils and leukocytes (Sutherland, Rodriguez-Zas et al. 2005).
For further analysis of the influence of genomic variants on protein function, I performed a Fisher’s exact test for the detection of specific enriched sites on the 13 genes which were in the intersection with the results from XP-EHH and XP-CLR. Previously, most studies have
35
focused on non-synonymous SNPs, since substitution is known to affect gene function. Also, many studies focused on deletions and insertions sites, which can affect the performance traits considerably in pigs (Hanjie, Yanhua et al. 2005, Li, Li et al. 2007). Therefore, statistical analysis was performed employing these two types of data, non-synonymous SNP and Indel site, under positive selective region.
From the test results, numerous P-values are generated. For easily identified significant test results, I draw the line plots composed with
−𝑙𝑙𝑙𝑙𝑙𝑙10(𝑝𝑝 − 𝑣𝑣𝑣𝑣𝑙𝑙𝑣𝑣𝑣𝑣) and each of site, y-axis and x-axis, respectively.
Each test result was plotted together (Figure 2.4). From the figures, I can easily detected significant enriched site, breed, and amino-acid or Indel, simultaneously. I identified several genes including significant sites, TG, CPED1, CPNE8, CD8, ERN1, ICAM2, JPH3, NELFCD, SP110, and ADAM7 in Indel data under Bonferroni corrected 5%
significance level. These genes have a possibility that is related to breed specific phenotypic variation between Berkshire and other breeds by Indel.
Whole genome assembly
Although analyzing positive selection signature between breeds using SNP and small Indel information could allow us to identify genetic variation which affects phenotypic diversity, it is also important to
36
consider large sequence differences, which can be difficult to detect using reference-based alignments. I assembled short reads sequence of each breed to decipher the large genomic difference of Berkshire compare to other breeds more deeply. The sample with high concordantly paired mapping rate to the reference genome and with low heterozygosity was selected to perform genome assembly for each breed. After whole genome assembly was performed using IDBA-UD, all of the contigs less than 2,000 bp were removed for the minimum threshold length. I observed an average of 223,028 contigs with an average length of 10,843 bp, and N50 length for Berkshire, Landrace, and Yorkshire are 30,152, 9,379, and 9,694, respectively. I further performed the gapclosing step to fill N base within the contig. The average sum of the total assembled contigs after the gapclosing step for Berkshire, Landrace, and Yorkshire breeds was 2,304 Mbp, 1,927 Mbp, and 1,996 Mbp, respectively. Detailed results are shown in Table 2.6.
To infer distinct genomic contents for Berkshire against other breeds, firstly, I compared the overall read mapping rate between assembled contigs for each breed, using the total mapped reads of each Berkshire sample (Figure 2.5). The average overall read mapping rate to the Berkshire assembled contigs was 93.5% in contrast to the Landrace and Yorkshire assembled contigs was 79.9% and 82.3%, respectively,
37
which is also about 4.7% higher to the overall mapping rate of reference-based alignment. Although satellites sequences were about 0.1% in Berkshire assembled contigs which is about 0.04% higher than others at 0.06%, there was no significant difference based on the ratio of interspersed repeat elements including retrotransposon and retrovirus-like sequence in each assembled contigs (Table 2.7).
I then separately remapped the each Berkshire sample’s sequencing reads, which were both unmapped to the reference genome and to the Landrace/Yorkshire assembled contigs, using Berkshire assembled contigs to find the regions in Berkshire that are distinct from the others.
The average mapping rate of unmapped reads was about 37.8% aligned to the Berkshire assembled contigs using Bowtie2, and the details of the information for each sample is described in Table 2.8. Among the total number of 127,713 Berkshire assembled contigs, I observed 563 contigs which the unmapped reads were aligned with depth coverage of more than 10 in common between all Berkshire samples. Additionally, I removed PCR duplication of sequence reads to reduce the number false positives. As shown in Table 2.7, the results summary of repeat contents demonstrated that high proportion of satellites (24.4%) was detected in these contigs which is approximately 240 times higher than those of the total assembled sequence. After performing gene prediction
38
and functional annotation, 43 contigs with 46 predicted genes were finally identified as Berkshire specific candidate genomic region. Out of 46 predicted genes, I identified 4 genes that were related to lipid metabolism: SLC25A14 (Kopecký, Rossmeisl et al. 2004), IGF1(Saltiel and Kahn 2001), PI4KA (Balla, Tuymetova et al. 2005), and CACNA1A (Taverna, Saba et al. 2004) (Table 2.9). Li et al. recently identified 44 genes with 49 SNPs showing significant association with muscling and meat quality trait (Li, Kim et al. 2011). Of the 44 candidate genes, DLX1 and DLX3 showed a concordant result with our study. In addition, TGFBR3 and SYT1, also identified from positive selection scan, were included in the candidate gene list. Besides the meat quality trait, 6 genes (OR4D10, OR4D11, ENSSSCG00000028782, ENSSSCG00000029769, ENSSSCG00000013807, and ENSSSCG00000021192) including 4 novel genes were related to olfactory receptor.
39
Table 2. 1 The result summary of sequence reads mapping using Bowtie2 (Berkshire).
Samples Total number of reads Paired align (concordantly)
Paired align
(discordantly) Non-paired align
Overall alignment
rate B_1 304,804,588 (100%) 264,655,464 (86.83%) 1,447,350 (0.47%) 8,018,865 (2.6%) 89.93%
B_2 253,047,908 (100%) 217,714,244 (86.04%) 862,454 (0.34%) 6,890,918 (2.72%) 89.10%
B_3 271,420,318 (100%) 235,657,098 (86.82%) 983,466 (0.36%) 7,099,349 (2.62%) 89.80%
B_4 307,202,928 (100%) 266,241,744 (86.67%) 875,278 (0.28%) 8,107,884 (2.64%) 89.59%
B_5 443,640,008 (100%) 386,011,330 (87.01%) 1,795,962 (0.41%) 11,538,051 (2.61%) 90.02%
B_6 311,141,122 (100%) 267,992,536 (86.13%) 866,970 (0.28%) 8,814,633 (2.83%) 89.24%
B_7 288,013,648 (100%) 249,302,488 (86.56%) 1,297,646 (0.45%) 8,128,979 (2.82%) 89.83%
B_8 278,043,466 (100%) 239,734,888 (86.22%) 717,994 (0.26%) 7,690,528 (2.77%) 89.25%
B_9 263,960,864 (100%) 224,974,736 (85.23%) 718,198 (0.27%) 8,020,392 (3.04%) 88.54%
B_10 265,641,094 (100%) 225,962,250 (85.06%) 698,462 (0.26%) 7,914,184 (2.98%) 88.31%
Total 2,986,915,944 (100%) 2,578,246,778 (86.32%) 10,263,780 (0.34%) 82,223,783 (2.76%) 89.36%
* Reference pig genome: Sus_scrofa10.2
* Fastq Quality Encoding: Sanger / Illumina 1.9 encoding
40
Table 2. 2 The result summary of sequence reads mapping using Bowtie2 (Landrace).
Samples Total number of reads Paired align (concordantly)
Paired align
(discordantly) Non-paired align
Overall alignment
rate L_1 327,963,242 (100%) 284,148,166 (86.64%) 2,759,122 (0.84%) 8,701,697 (2.65%) 90.13%
L_2 332,203,902 (100%) 288,224,972 (86.76%) 3,685,626 (1.11%) 9,464,780 (2.85%) 90.72%
L_3 345,708,096 (100%) 292,140,142 (84.50%) 9,146,420 (2.65%) 12,172,458 (3.52%) 90.67%
L_4 355,525,994 (100%) 306,776,924 (86.29%) 5,603,838 (1.58%) 10,414,418 (2.93%) 90.79%
L_5 335,544,768 (100%) 287,153,812 (85.58%) 4,133,972 (1.23%) 10,230,992 (3.05%) 89.86%
L_6 323,931,824 (100%) 276,749,676 (85.43%) 4,457,484 (1.38%) 9,827,855 (3.03%) 89.84%
L_7 338,310,130 (100%) 244,994,652 (72.42%) 22,520,534 (6.66%) 32,642,143 (9.65%) 88.72%
L_8 328,367,780 (100%) 243,931,056 (74.29%) 21,350,952 (6.50%) 28,939,765 (8.81%) 89.60%
L_9 301,513,518 (100%) 167,131,020 (55.43%) 36,254,984 (12.02%) 49,635,358 (16.46%) 83.92%
L_10 332,943,476 (100%) 260,906,860 (78.36%) 15,454,906 (4.64%) 22,666,135 (6.81%) 89.81%
L_11 322,384,718 (100%) 233,801,440 (72.52%) 18,014,646 (5.59%) 27,801,225 (8.62%) 86.73%
Total 3,644,397,448 (100%) 2,885,958,720 (79.19%) 143,382,484 (3.93%) 222,496,826 (6.11%) 89.16%
* Reference pig genome: Sus_scrofa10.2
* Fastq Quality Encoding: Sanger / Illumina 1.9 encoding
41
Table 2. 3 The result summary of sequence reads mapping using Bowtie2 (Yorkshire).
Samples Total number of reads Paired align (concordantly)
Paired align
(discordantly) Non-paired align
Overall alignment
rate Y_1 437,075,804 (100%) 356,548,806 (81.58%) 1,487,336 (0.34%) 14,373,647 (3.29%) 85.20%
Y_2 433,671,492 (100%) 349,459,020 (80.58%) 1,451,608 (0.33%) 15,270,418 (3.52%) 84.44%
Y_3 421,654,852 (100%) 340,456,016 (80.74%) 2,591,788 (0.61%) 16,919,993 (4.01%) 85.37%
Y_4 418,666,128 (100%) 344,925,126 (82.39%) 1,609,106 (0.38%) 13,636,726 (3.26%) 86.03%
Y_5 430,293,866 (100%) 359,466,198 (83.54%) 1,846,106 (0.43%) 14,002,841 (3.25%) 87.22%
Y_6 671,036,258 (100%) 551,036,298 (82.12%) 5,298,938 (0.79%) 26,208,951 (3.91%) 86.81%
Y_7 411,119,624 (100%) 341,692,338 (83.11%) 1,512,428 (0.37%) 13,201,456 (3.21%) 86.69%
Y_8 442,784,174 (100%) 346,812,832 (78.33%) 1,869,420 (0.42%) 16,987,820 (3.84%) 82.58%
Y_9 317,653,962 (100%) 276,538,614 (87.06%) 2,637,236 (0.83%) 8,945,027 (2.82%) 90.70%
Y_10 339,820,584 (100%) 287,058,268 (84.47%) 7,002,276 (2.06%) 11,034,708 (3.25%) 89.78%
Y_11 351,288,112 (100%) 297,061,500 (84.56%) 7,087,374 (2.02%) 12,323,309 (3.51%) 90.09%
Y_12 341,544,022 (100%) 269,254,168 (78.83%) 21,493,938 (6.29%) 15,690,652 (4.59%) 89.72%
Y_13 333,812,260 (100%) 277,778,240 (83.21%) 12,344,680 (3.70%) 12,871,050 (3.86%) 90.77%
Total 5,350,421,138 (100%) 4,398,087,424 (82.20%) 68,232,234 (1.28%) 191,466,598 (3.58%) 87.34%
* Reference pig genome: Sus_scrofa10.2
* Fastq Quality Encoding: Sanger / Illumina 1.9 encoding
42
Table 2. 4 List of candidate genes resulted from genome-wide positive selection scan.
¶Genes within regions resulted from XP-EHH.
*Genes within regions resulted from XP-CLR.
∮Genes within regions resulted from both XP-EHH and XP-CLR.
5S_rRNA * 7SK ∮ ABCA13 * ABI1 * ACTN2 ¶ ADAM7 ∮ ADAMDEC1
∮
ADPRM * AKIRIN2 ¶ AMPH * ANKRD16 * APBB1IP * ASB13 * ATP5E * ATP9A * ATXN7L3B ¶ BACH2 * BCAP29 * BIN2 *
BTBD9 ¶ C2CD3 ¶ CCDC30 * CCR2 ¶ CCR5 ¶ CCRL2 ¶ CD79B * CD8B ∮ CEP152 ¶ COL5A1 * CPED1 ∮ CPNE8 ∮ CTSZ * CU469018.1 * CUL1 ¶ CWC15 * DAZAP2 * DUS4L * ELAC2 ¶ ELP6 
ENOX1 ¶ ERN1 ∮ FABP1 ∮ FAM114A2 * FAM134B * FAM208B * FBXO18 * FBXO31 * FLT3 * FNDC8 * FRAS1 ¶ FRMD4B * GABRR2 * GDI2 * GH * GLP2R ¶ GNAS * GPATCH2 * GPR111 * ICAM2 ∮
IFNGR1 * IGKV-5 ¶ IGKV-6 ¶ IGKV-7 ¶ IGSF5 * IKBKAP * IL22RA2 * IL2RA * INTS4 * ITGA1 ¶ JPH3 ∮ KCND2 ¶ KIAA0100 ¶ KIAA1009 * KLHL1 * KRCC1 * LDB2 * LPHN3 ¶ LRRC6 * MAP1LC3B *
MARCH10 * MATN4 ∮ MEP1A * MRAP2 * MRC2 * MRPL1 ¶ MTSS1 * MTUS2 * MYO10 * NELFCD ∮ NFATC2 * NLE1 * NPEPL1 ¶ NUP62 ¶ OLFM1 * OLFML1 * OR52E4 ¶ OR52N1 * OR52N5 * ORC3 
OTOGL * OVCH2 * P2X3R * PDIA4 * PHF20L1 * POLA2 * PPME1 ¶ PPP2R5C ¶ PROM1 * RAE1 * RARS2 ¶ RBM17 * RCAN2 * RFFL * RGS18 ¶ RIMKLA * RMND5A * RNF4 * RNPC1 * RRP1B 
SCAP ¶ SCN4A * SCO1 * SLMO2 * SLPI * SMAGP * SMYD1 * SNORA70 * SP110 ∮ SPAG4L * SPAG5 ¶ SRSF12 ¶ SYT1 * SZT2 * TG ∮ TGFBR3 ¶ TIMP-2 * TMEM220 * TNFRSF19 * TNFRSF21 *
TRAPPC9 * TUBB1 * TUBGCP3 * U6 ∮ UBE2J1 * UNC45B * USP25 ¶ USP36 * XCR1 ¶ Y_RNA * ZBP1 * ZC3HAV1L * ZMYND12 * ssc-mir-296 ¶ ssc-mir-30b ¶ ssc-mir-30d 
43
Table 2. 5 Major candidate genes for meat quality detected from positive selection scans (XP-EHH and XP-CLR).
Candidate
genes Chromosome Window (Mbp) XP-EHH (B-L)a
XP-EHH (B-Y)b
XP-CLR (B-L)c
XP-CLR (B-Y)d
TG 4 8.075-8.1 6.62E-03 9.01E-03 316.91 512.22
FABP1 3 60.625-60.65 4.37E-03 8.11E-03 343.91 463.03 ERN1 12 14.95-14.975 4.71E-03 2.46E-03 334.99 358.46 ICAM2 12 14.95-14.975 4.71E-03 2.46E-03 334.99 358.46 JPH3 6 1.8-1.825 9.86E-03 7.81E-03 550.37 534.39 TGFBR3 4 136.675-136.7 4.64E-03 4.10E-03 167.01 230.76 GLP2R 12 57.45-57.475 8.35E-03 4.71E-04 177.41 277.77 PPP2R5C 7 129.925-129.95 6.45E-03 7.40E-03 179.71 184.98 AKIRIN2 1 62.775-62.8 6.07E-04 6.08E-03 138.15 120.63
aEmpirical P-value resulting from XP-EHH analysis between Berkshire and Landrace
bEmpirical P-value resulting from XP-EHH analysis between Berkshire and Yorkshire
cXP-CLR score of genomic region between Berkshire and Landrace
dXP-CLR score of genomic region between Berkshire and Yorkshire
44
Table 2. 6 The summary statistics of assembled contigs for Berkshire, Landrace, and Yorkshire using IDBA_UD.
Sample name Berkshire assembled contigs Landrace assembled contgs Yorkshire assembled contigs
Number of contigs 127,713 270,296 271,102
Sequence lengths
Minimum length 2,000 2,000 2,000
Maximum length 376,136 100,559 121,658
Average length 18,040 7,130 7,363
N50 length 30,158 9,379 9,695
Residue contents
GC contents (%) 2,303,986,880 1,927,202,658 1,995,955,586
Total residue counts (bp) 2,303,986,880 1,927,202,658 1,995,955,586
N contents 3,994,159 12,552,162 11,987,309
Closed N by Gapcloser 3,683,387 4,939,252 4,652,510
45
Table 2. 7 The result summary of assembled contigs’ repeated and transposable elements for Berkshire, Landrace, and Yorkshire;
and Berkshire assembled contigs of which unmapped reads were aligned.
Sample name Berkshire assembled contigs
Landrace assembled contgs
Yorkshire assembled contigs
Berkshire assembled contigs (aligned by unmapped
reads) SINE elements 327,645,056 (14.2%) 250,638,900 (13%) 271,366,754 (13.6%) 210,150 (8.9%) MIRs 51,816,119 (2.3%) 43,089,186 (2.2%) 44,987,615 (2.3%) 30,034 (1.3%) LINE elements 438,514,901 (19%) 374,311,562 (19.4%) 371,221,247 (18.6%) 266,331 (11.3%)
LINE1 372,585,878 (16.17%) 319,598,700 (16.6%) 314,801,771 (15.8%) 238,532 (10.1%) LINE2 57,265,899 (2.5%) 47,373,311 (2.5%) 49,015,357 (2.5%) 25,375 (1.1%) L3/CR1 6,129,792 (0.3%) 5,049,159 (0.3%) 5,108,792 (0.3%) 1,819 (0.1%)
RTE 2,389,095 (0.1%) 2,161,378 (0.1%) 2,168,000 (0.1%) 605 (0.03%)
LTR elements 111,174,277 (4.8%) 99,511,787 (5.2%) 102,484,633 (5.1%) 79,486 (3.4%) ERVL 31,960,426 (1.4%) 29,152,605 (1.5%) 29,872,332 (1.5%) 21,059 (0.9%) ERVL-MaLRs 42,664,740 (1.9%) 38,309,685 (2%) 39,598,614 (2%) 23,706 (1.0%) ERV_class I 29,861,951 (1.3%) 26,117,756 (1.4%) 27,085,634 (1.4%) 29,499 (1.3%) ERV_class II 2,185,840 (0.1%) 1,763,769 (0.1%) 1,734,959 (0.1%) 3,209 (0.2%) DNA elements 58,177,227 (2.5%) 50,554,422 (2.6%) 51,582,476 (2.6%) 29,549 (1.3%)
46
hAT-Charlie 31,265,469 (1.4%) 26,880,273 (1.4%) 27,613,550 (1.4%) 20,302 (0.9%) TcMar-Tigger 12,426,706 (0.5%) 11,178,616 (0.6%) 11,242,173 (0.6%) 4,049 (0.2%) Unclassified 920,632 (0.04%) 850,145 (0.04%) 855,520 (0.04%) 530 (0.02%) Small RNA 275,807,479 (12%) 207,554,004 (10.8%) 226,388,127 (11.3%) 180,478 (7.6%) Satellites 2,084,392 (0.1%) 1,397,379 (0.06%) 1,466,892 (0.06%) 577,725 (24.4%)
Total bases masked 938,893,022 (40.8%) 777,586,827 (40.4%) 799,311,123 (40.1%) 1,160,831 (49.1%)
47
Table 2. 8 The alignment mapping summary of unmapped sequencing reads to the Berkshire assembled contigs. (The unmapped sequencing reads were defined as the ones that were not mapped to the reference genome and to the Landrace and Yorkshire assembled contigs.)
Categories Samples
B_1 B_2 B_3 B_4 B_5 B_6 B_7 B_8 B_9 B_10
Total number of reads
13,628,43 3 (100%)
8,368,548 (100%)
10,681,94 1 (100%)
10,847,54 1 (100%)
12,304,00 1 (100%)
8,479,291 (100%)
8,013,873 (100%)
9,436,249 (100%)
10,525,98 5 (100%)
8,293,606 (100%)
Aligned 0 time 8,471,987 (62.16%)
4,814,337 (57.53%)
7,139,625 (66.84%)
7,098,207 (65.44%)
8,686,418 (70.60%)
4,819,690 (56.84%)
4,607,244 (57.49%)
5,588,090 (59.22%)
6,743,788 (64.07%)
5,094,468 (61.43%)
Aligned exactly 1 time 4,662,069 (34.21%)
3,108,536 (37.15%)
3,165,728 (29.64%)
3,325,796 (30.66%)
3,207,814 (26.07%)
3,291,476 (38.82%)
3,041,792 (37.96%)
3,379,386 (35.81%)
3,380,408 (32.11%)
2,814,182 (33.93%)
Aligned more than 1 time
494,377 (3.63%)
445,675 (5.33%)
376,588 (3.53%)
423,538 (3.90%)
409,769 (3.33%)
368,125 (4.34%)
364,837 (4.55%)
468,773 (4.97%)
401,789 (3.82%)
384,956 (4.64%)
Overall alignment rate 37.84% 42.47% 33.16% 34.56% 29.40% 43.16% 42.51% 40.78% 35.93% 38.57%
48
Table 2. 9 Predicted gene list related to meat quality from Berkshire specific aligned contigs.
Predicted Ensembl ID Gene symbol contig length
Depth coveragea ENSSSCG00000012660 SLC25A14 15,059 13.8 ENSSSCG00000000857 IGF1 8,107 17.7 ENSSSCG00000006310 POU2F1 19,766 11.9 ENSSSCG00000010092 PI4KA 29,825 17.0 ENSSSCG00000017433 KRT14 11,812 12.4 ENSSSCG00000013754 CACNA1A 45,820 11.0 ENSSSCG00000015953 DLX1 26,563 10.9 ENSSSCG00000017589 DLX3 26,563 10.9
aAverage depth coverage of total mapped length in common between Berkshire samples
49
Figure 2. 1 The distributions of novel SNV and known SNP in each chromosome.
50
Figure 2. 2 (a) Results of principal component analysis (PCA) of Berkshire, Landrace, and Yorkshire breeds. Eigenvector1 (x-axis) versus Eigenvector2 (y-axis). Both Eigenvector1 (15.7% of the total variance) and Eigenvector2 (13.7% of the total variance) indicate proportion of variance. (b) Summary of gene sets identified from statistical analyses (XP-EHH and XP-CLR) of Berkshire tested against Landrace and Yorkshire breeds.