저작자표시-비영리-변경금지 2.0 대한민국 이용자는 아래의 조건을 따르는 경우에 한하여 자유롭게
l 이 저작물을 복제, 배포, 전송, 전시, 공연 및 방송할 수 있습니다. 다음과 같은 조건을 따라야 합니다:
l 귀하는, 이 저작물의 재이용이나 배포의 경우, 이 저작물에 적용된 이용허락조건 을 명확하게 나타내어야 합니다.
l 저작권자로부터 별도의 허가를 받으면 이러한 조건들은 적용되지 않습니다.
저작권법에 따른 이용자의 권리는 위의 내용에 의하여 영향을 받지 않습니다. 이것은 이용허락규약(Legal Code)을 이해하기 쉽게 요약한 것입니다.
Disclaimer
저작자표시. 귀하는 원저작자를 표시하여야 합니다.
비영리. 귀하는 이 저작물을 영리 목적으로 이용할 수 없습니다.
변경금지. 귀하는 이 저작물을 개작, 변형 또는 가공할 수 없습니다.
이학박사학위논문
전장유전체 정보를 이용한 세균 종의 정의
Bacterial Species Delineation based on Whole Genome Information
2019년 8월
서울대학교 대학원 생명과학부
백 인 우
Bacterial Species Delineation based on Whole Genome
Information
by Inwoo Baek
Advisor: Professor Jongsik Chun, Ph. D.
A thesis submitted for the Partial Fulfillment of the Degree of Doctor of Philosophy
August 2019
School of Biological Science
Seoul National University
전장유전체 정보를 이용한 세균 종의 정의
지도 교수 천 종 식
이 논문을 이학박사 학위논문으로 제출함 2019 년 6월
서울대학교 대학원 생명과학부
백 인 우
백인우의 이학박사 학위논문을 인준함 2019년 8월
위 원 장 (인)
부위원장 (인)
위 원 (인)
위 원 (인)
위 원 (인)
ABSTRACT
For the last several decades, the identity of the 16S rRNA sequence and the value of DNA-DNA hybridization have been the standards of species classification.
However, those methods arose problems such as lower resolution in intra-genus level, and the variation due to experimental methods and environments. Because a huge amount of microbial genomic data was accumulated after the development of Next Generation Sequencing, researchers can reveal the phylogenetic relationship of microbes based on the whole genomic sequences instead of the ordinary methods. In this research, the procedure of reconstructing phylogenetic systematics of diverse microbes based on genomic data.
First, the research on checking whether the chemotaxonomic standards are reliable was executed. Genomes of Turicella otitidis, Corynebacterium spp, and the representative strains of Corynebacteriales order were collected, and comparative genomic analysis was performed. By the result, two distinct features of Turicella, lack of mycolic acid and fully unsaturated menaquinone, were also proven by the lack of corresponding genes in the genome. Moreover, those absences of genes were also detected in other Corynebacterium species who lack mycolic acid or contain fully unsaturated menaquinones. Also, the loss of the genes related to chemotaxonomic traits seems to occur independently, based on gene synteny and phylogenomic analysis result. Therefore, chemotaxonomy is not fulfilled for the standard of classification, due to be charged by a single or small number of genes and their low robustness from gene transfer or loss. Therefore, Turicella otitidis was reclassified as Corynebacterium otitidis, because it is less reliable that Turicella otitidis is placed as an independent genus compared with
Corynebacterium based on chemotaxonomic characteristics,
Next, the research of isolating and identifying two novel species was conducted. In this procedure, to confirm that the isolated strains are not ordinarily reported species, Average Nucleotide Identity (ANI) value between neighboring type strains were measured. In results, it is confirmed that the ANI value is lower than the species demarcation cutoff (95-96%). Also, investigating the morphology and biochemical experiments were performed those are essential for the validation of novel species. The combination of those results, the newly isolated two strains were named as Burkholderia monticola (JC2948T=JCM 19904T=KACC 17924T), and Burkholderia megalochromosomata (JC2949T=JCM 19905T=KACC 17925T), respectively.
Finally, the research about resetting the systematic relationship between Bacillus cereus and Bacillus thuringiensis, known as causative food poisoning pathogen and insecticidal species, was revealed based on comparative genomic analysis. By the result, Bacillus thuringiensis is consist of polyphyletic groups, displayed by the scattered distribution of Bt toxin genes among the phylogenomic tree. Instead, Bacillus thuringiensis can be reclassified as two genomovars based on position in the phylogenomic tree and the discovered frequency of insecticidal toxins. Moreover, there are no significant gene content dissimilarities between Bacillus cereus and two genomovars of Bacillus thuringiensis. Based on those consecutive results, it is strongly implied that Bacillus thuringiensis is not bona fide species according to genomic evidence.
In conclusion, the species delineation process of prokaryotes needs to be changed based on objective, unified, and numerical factors instead of subjective
newly identifying and changing misidentified nomenclature. It is expected that the results of the comparative genomic research conducted in this research can be utilized for the subsequent researches such as rapid medical diagnosis and pest control using microorganisms.
Keywords: Bacillus cereus, Bacillus thuringiensis, Bt toxin, Burkholderia, Chemotaxonomy, Phylogenomics, Turicella
Student Number: 2013-20295
TABLE OF CONTENTS
ABSTRACT ... i
TABLE OF CONTENTS ... iv
LIST OF FIGURES ... vii
LIST OF TABLES ... x
ABBREVIATIONS ... xi
CHAPTER 1. General Introduction ... 1
1.1. Species delineation in prokaryotes ... 2
1.2. Molecular Phylogenetics ... 5
1.3. Phylogenetic analysis based on genomic data... 7
1.4. Purpose of this study ... 10
CHAPTER 2. Phylogeny Trumps Chemotaxonomy ... 11
2.1. Introduction ... 12
2.2. Materials and Methods ... 16
2.2.1. Genome sequences and identification of genes ... 16
2.2.2. Phylogenetic analysis ... 20
2.3. Results ... 21
2.4. Discussion ... 31
CHAPTER 3. Identifying Two Novel Species in Burkholderia sensu lato3.1. Introduction ... 36
3.2. Materials and Methods ... 38
3.2.1. Isolation and identification of novel species candidate ... 38
3.2.2. Reconstructing 16S rRNA phylogenetic trees ... 38
3.2.3. Genome sequencing and calculating ANI ... 39
3.2.4. Polyphasic experiments of novel species ... 39
3.2.5. Phylogenomic analysis of Burkholderia sensu lato ... 40
3.3. Results ... 41
3.4. Discussion ... 57
Chapter 4. Clarify species demarcation between Bacillus cereus and Bacillus thuringiensis ... 61
4.1. Introduction ... 62
4.2. Materials and Methods ... 67
4.2.1. Downloading genomic data and filtering out low-quality genomes ... 67
4.2.2. Phylogenomic tree reconstruction of the Bacillus cereus - Bacillus
thruingiensis clade ... 674.2.3. Calculation of the overall genomic relatedness between the type strains of Bacillus cereus – Bacillus thuringiensis ... 68
4.2.4. Screening toxin-related genes from Bacillus cereus and Bacillus
thuringiensis genomes ... 684.2.5. Comparing orthologous gene composition among the genomes . 69
4.3. Results ... 71
4.4. Discussion ... 85
CHAPTER 5. General Conclusion ... 91
REFERENCES ... 95
Appendix I. Bacillus cereus and Bacillus thuringiensis genomes analyzed in this study ... 119
국문 초록 (Abstract in Korean) ... 133
LIST OF FIGURES
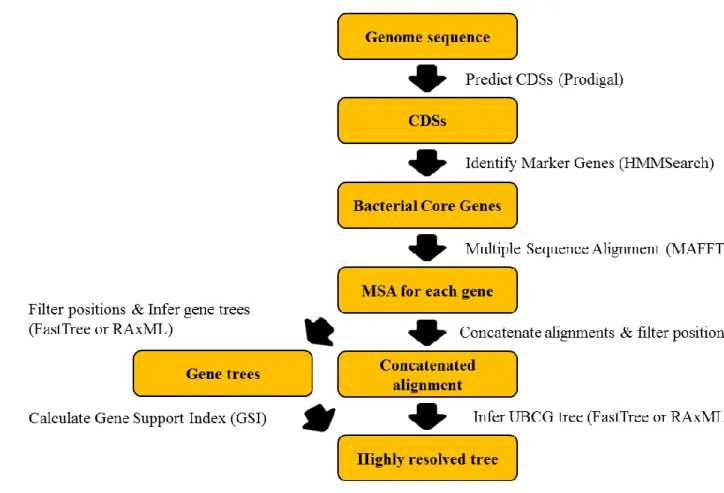
Figure 1. Overview process of inferring phylogenomic relationship by UBCG software ... 8 Figure 2. Genome-based phylogenetic tree of T. otitidis and neighboring
species, reconstructed by the UBCG phylogenomic pipeline ... 23 Figure 3. Genome-based phylogenetic tree of T. otitidis and neighboring
species, reconstructed by the PhyloPhlAn phylogenomic pipeline.
... 25 Figure 4. Phylogenetic tree reconstructed with 16S rRNA genes for T.
otitidis and neighboring species ... 26
Figure 5. The synteny plot of gene families near fadD32-pks13-accD4
operon site of species whose mycolic acid is absent and their phylogenetically neighboring species. ... 27 Figure 6. The synteny plot of gene families near menJ gene site of T. otitidis
and related species ... 28 Figure 7. Phylogenetic tree reconstructed based on amino acid sequence of
seven MK biosynthesis genes for T. otitidis and its close species ... 29 Figure 7. Phylogenetic tree reconstructed based on nucleotide sequence of
seven MK biosynthesis genes for T. otitidis and its close species
... 30
Figure 9. Neighbor-Joining tree based on 16S rRNA gene sequences to
describe the taxonomic position of strain JC2948
T.... 43 Figure 10. Neighbor-Joining tree based on 16S rRNA gene sequences to
describe the taxonomic position of strain JC2949
T... 44 Figure 11. Dendrogram depicting the UPGMA clustering based on ANI
values of strain JC2948
Tand its neighboring strains ... 45 Figure 12. Dendrogram depicting the UPGMA clustering based on ANI
values of strain JC2949
Tand its neighboring strains ... 46 Figure 13. Transmission electron micrograph of the novel strains ... 49 Figure 14. Two-dimensional TLC of polar lipid extracts ... 54 Figure 15. The compressd and collapsed ML phylogenomic tree of
Burkholderia sensu lato based on ubiquitous genes ... 56
Figure 16. The maximum-likelihood phylogenomic tree between the type
strains of Bacillus cereus sensu lato species, including Bacillus
cereus and Bacillus thuringiensis ... 72Figure 17. Figures depicting the relationship between Bacillus cereus and
Bacillus thuringiensis genomovars ... 74
Figure 18. The phylogenomic tree of Bacillus cereus and Bacillus
thuringiensis strains together with labeled enterotoxin genes ... 77
Figure 19. The phylogenomic tree of Bacillus cereus and Bacillus
thuringiensis strains together with labeled pesticidal genes ... 79
Figure 20. PCoA plots describing the Bray-Curtis distance between every
pair of strains ... 81
of strains ... 82
LIST OF TABLES
Table 1. Reference genes used in the analysis ... 17 Table 2. Major phenotypic characteristics that differentiate strain JC2948
Tfrom other species of the genus Burkholderia ... 50 Table 3. Major phenotypic characteristics that differentiate strain JC2949
Tfrom other species of the genus Burkholderia ... 51 Table 4. Cellular fatty acid composition of strain JC2948
Tand related strains of the genus Burkholderia ... 52 Table 5. Cellular fatty acid composition of strain JC2949
Tand related strains of the genus Burkholderia ... 53 Table 6. Pesticidal toxins discovered in B. cereus group species and their
corresponding homologous groups ... 66 Table 7. Pairwise OrthoANIu and dDDH values between the type strains of
each species or genomovar ... 75 Table 8. Significance tests of the effects of genomovar types on the gene
content with three different statistical approaches ... 84
ABBREVIATIONS
accA3: Acyl/Acetyl-CoA carboxylase subunit alpha accD4: Acyl-CoA carboxylase subunit beta 1 accD5: Acyl-CoA carboxylase subunit beta 2 accD6: Acetyl-CoA carboxylase subunit beta
accE: Acyl/Acetyl-CoA carboxylase subunit epsilon
ANI: Average Nucleotide Identity
ANOSIM: Analysis of similarity BCC: Burkholderia cepacia complex Bin: Binary insecticidal toxin
BLAST: Basic local alignment search tool bp: Base pair
BSC: Biological species concept Bt toxin: Bacillus thuringiensis toxin CDS: Coding sequence
cmrA: Probable short-chain type dehydrogenase/reductase
Cry: Crystal insecticidal toxin
CSI: Conserved signature indels Cyt: Cytolytic insecticidal toxin CytK: Cytotoxin K
dDDH: Digital DNA-DNA hybridization
DDH: DNA-DNA hybridization
desA3: NADPH-dependent stearoyl-CoA 9-desaturase
DNA: Deoxyribonucleic acid
DPG: diphosphatidylglycerol
fabD: Malonyl CoA-acyl carrier protein transacylase fabH: 3-oxoacyl-[acyl-carrier-protein] synthase 3 fadD32: long-chain-fatty-acid-AMP ligase
FAS: Fatty acid synthesis
fas: 3-oxoacyl-ACP synthase fbp: protein PS1
FFP:
Feature frequency profileGBDP: Genome blast distance phylogeny G+C: Guanine plus cytosine
GC: Gas chromatography GSI: Gene Support Index GTR: General time reversible
hadA: (3R)-hydroxyacyl-ACP dehydratase subunit A hadB: (3R)-hydroxy acyl-ACP dehydratase subunit B hadC: (3R)-hydroxy acyl-ACP dehydratase subunit C
Hbl: hemolysin BL
hepST: geranyl pyrophosphate synthase
ICSP: International Committee on Systematics of Prokaryotes
inhA: (NADH)dependent trans-2-enoyl-ACP reductaseJCM: Japan Collection of Microorganisms KACC: Korean Agricultural Culture Collection
kasA: 3-oxoacyl-[acyl-carrier-protein] synthase 1 kasB: 3-oxoacyl-[acyl-carrier-protein] synthase 2KO: KEGG orthology
MA: Mycolic acid
mabA: 3-oxoacyl-[acyl-carrier-protein] reductase
Mbp: Mega base pair
menD:
2-succinyl-5-enolpyruvyl-6-hydroxy-3-cyclohexene-1-carboxylate synthase
menG: demethylmenaquinone methyltransferase menJ: menaquinone reductase
mgtA: GDP-mannose-dependent alpha-mannosyltransferase
MIDI: Microbial Identification System
MK: Menaquinone
ML: Maximum-likelihood
MLSA:
Multilocus sequence analysismmpL3: Trehalose monomycolate exporter
MRPP: Multi-response permutation procedure MTBC: Mycobacterium tuberculosis complex Mtx: Mosquitocidal toxin
NA: Nutrient agar
NB: Nutrient broth
NCBI: National center of biotechnology information NGS: Next generation sequencing
Nhe: Non-hemolytic enterotoxin NJ: Neighbor-joining
OGRI: Overall genome related index PCR: Polymerase chain reaction PE: phosphatidylethanolamine PG: phosphatidylglycerol
pks13: polyketide synthase 13RNA: Ribonucleic acid
rRNA: Ribosomal ribonucleic acid SRA: sequence read archive TC.POT: di/tripeptide transporter
TEM: Transmission electron microscope TLC: Thin layer chromatography
UniProt: Universal Protein Resource
UPGMA: Unweighted Pair Group Method using Arithmetic average UQ: ubiquinone
Vip: Vegetative insecticidal toxin
CHAPTER 1.
General Introduction
1.1. Species delineation in prokaryotes
Prokaryotic systematics is the scientific field about studying the diversity and relationship of microbes, and it includes taxonomy (Rosenberg et al., 2013).
Taxonomy is defined by the science of biological classification (Stanier and Stanier, 1986). Classification (arranging prokaryotes into clusters), nomenclature (naming of groups clustered by classification), and identification (for an unknown organism, practically applying classification and nomenclature on it) are included concepts in the taxonomy (Cowan, 1968).
Species is the most basic unit in the taxonomy. It is controversial about the definition and concept of species. Biological species concept (BSC) proposed by Mayr is a group of organisms that are intrinsic reproductive isolation from the outside and can be interbred within the group (de Queiroz, 2005). However, for the asexual reproductive organisms like prokaryotes, this concept cannot be applicable.
In the world of prokaryotes, there is a committee called ‘International Committee on Systematics of Prokaryotes (ICSP)’ which validates novel nomenclature and judges the confliction about taxonomy. ‘A monophyletic cluster of organisms that show high similarity within them, and possess distinguishable phenotypes among them’ is the most reasonable species concept of prokaryotes among the member of ICSP (Rossello-Mora and Amann, 2001).
For the past several decades, the primary standard of identifying the prokaryotic species is a value of 97% 16S rRNA sequence similarity (Doolittle and Zhaxybayeva, 2009). However, it is also insufficient as a standard for taxonomic analysis. Because the copy number of 16S rRNA vary between species and In some
cases, the sequence between 16S rRNA gene copies of the same organism are different (Yap et al., 1999). Moreover, 16S rRNA sequence can be introduced from the outside via plasmid (Kunnimalaiyaan et al., 2001). On the other hand, DNA- DNA hybridization (DDH) was used as another standard of species delineation, and 70% was proposed as the cutoff (Wayne et al., 1987). However, the hybridization experiment is labor-demanding. Also, the DDH value varies depending on the difference of procedure between experiments (Grimont et al., 1980) and experiment conditions (Huss et al., 1983).
By those shortcomings, and due to accumulated, prokaryotic genomic data by the development of Next Generation Sequencing (NGS; Soon et al., 2013), it is tried to identify prokaryotic taxa based on genomic data. After the introduction of NGS, numerous microbial genomic sequences were accumulated (Chun and Rainey, 2014). Therefore researchers tried to grasp the taxonomic position of each species as genome-scale. Average Nucleotide Identity (ANI) is the taxonomic indicator obtained by directly measuring the similarity between two genome sequences (Goris et al., 2007). 95%-96% of ANI value was proposed as the cutoff of species segregation (Richter and Rossello-Mora, 2009), and it is correlated with 98.65%
16S rRNA similarity (Kim et al., 2014). Based on the ANI algorithm, software calculating a more vigorous version of ANI (OrthoANI) and its faster version (OrthoANIu) were released (Lee et al., 2015; Yoon et al., 2017b). Another alternative index of genomic relatedness is digital DNA-DNA hybridization (dDDH), which is statistically suggesting DDH value between two genomes by genomic comparison (Auch et al., 2010; Meier-Kolthoff et al., 2013). Also, a subsequent study revealed that the dDDH value of 79-80% is the appropriate boundary between subspecies (Meier-Kolthoff et al., 2014). Besides, by the result
obtained by large-scale genomic analysis, 1% G+C content difference can also be a factor for species separation cutoff (Kim et al., 2015).
Those values such as ANI and dDDH were named as the overall genome- related index (OGRI). Finally, after enormous amount microbial genomic data are stored in NCBI’s Sequence Read Archive (SRA), the rule was established that prokaryotic genome and its OGRI value with the references are required for propose novel nomenclature (Chun et al., 2018).
1.2. Molecular Phylogenetics
Phylogeny is a history of the evolution of a species or group and can be expressed as a tree consists of nodes which are linked by branches. The branch stands for the persistence of a genetic lineage through time, and the nodes stand for the speciation event. The phylogenetic tree is inferred from sequence or other data because it cannot be directly observed. (Yang and Rannala, 2012).
There are two methods of inferring phylogenetic tree; distance-based and character-based. Distance matrix methods infer phylogenetic relations based on calculated pairwise distance and the resultant distance matrix is utilized to reconstruct the phylogenetic tree. On the other hand, character-based methods involve the step of comparing all sequences in the alignment at once and calculate the score for each potentially possible trees (Yang and Rannala, 2012).
In the distance matrix methods, the sequence information is not used once the distances have been calculated. Neighbor-joining (NJ) is the most widely used distance matrix method, which consequently choosing a pair taxa which are closest taxon distance and joining them until the fully bifurcated tree is obtained (Saitou and Nei, 1987). When calculating the distance, the Jukes-Cantor model assumes that all nucleotide substitutions are equal rate (Jukes and Cantor, 1969), whereas Kimura two parameters model assumes that transitions and transversions have different rates (Kimura, 1980). Both models assume that the frequency of the four bases is equal. There are more complex models, the most complex one is general time reversible (GTR) model, which assumes that all six substitution frequencies are different and the base frequency is also unequal (Tavare, 1986). The advantage
of distance matrix methods is in computational efficiency, whereas the
disadvantage is in poor resolution in divergent sequences and sensitive to gaps (Bruno et al., 2000).
The Character-based methods compare all sequences in the alignment at once.
A site in the alignment at a time is used to calculate a score for each tree, and a whole tree score is obtained. Among the potential evolutionary stories (trees), the most reliable tree (highest tree score) was chosen. There are three character-based methods; maximum parsimony, maximum likelihood (ML), and Bayesian
inference. Maximum parsimony minimizes the number of state changes by assigning states to internal nodes. The tree score is calculated as the sum of character lengths over all sites, and the tree that minimizes tree score is selected as the maximum parsimony tree. Algorithm for finding the minimum number of change has developed since the 1970s (Fitch, 1971). ML tree reconstruction is based on likelihood concept. The likelihood function is defined as the probability of the data given the parameters but is viewed as a function of the parameters with the data observed and fixed. The ML estimates of parameters stand for the
parameter values that maximize the likelihood. Therefore, the tree that maximizes the likelihood will be chosen in the ML method (Felsenstein, 1985). Bayesian tree inference is also calculated likelihoods of trees, but try to sample from the tree set with a frequency proportional to the likelihood, given the observed data. It means that the output of Bayesian tree inference is not a single tree, but a set of trees. The certain tree is called maximum a posteriori tree, the tree topology that appears the most frequently in the sample set (Rannala and Yang, 1996).
1.3. Phylogenetic analysis based on genomic data
As mentioned in the previous section, 16S rRNA was selected as a marker gene for identifying taxonomy. However, it is not sufficient marker for the gene pediction, due to the drawbacks mentioned in the previous chapter. Phylogenetic inference based on artificial core genome composed of ubiquitous single copy genes is an alternative to overcome those shortcomings. This concept was applied into various software such as AMPHORA (Wu and Eisen, 2008), PhyEco (Wu et al., 2013), PhyloPhlan (Segata et al., 2013) and UBCG (Na et al., 2018).
In the case of UBCG software, the procedure of reconstructing phylogenetic inference based on genomic sequence is composed as Figure 1. The whole rough process is composed of 1) exploiting core gene sequences from the genomes, based on a pre-set reference database, 2) align for each core gene and concatenate them to build pseudo-genome, and 3) inferring phylogenetic tree based on the concatenated sequences.
In addition to core gene-based phylogenomic analysis, there are several attempts using other algorithms to discover genome-based taxonomic relationships.
One of them, a paper mentioned that gene content dissimilarity could be a factor for classifying the close microbial strains (Tu and Lin, 2016). This paper tried to classify the Enterobacteriaceae strains based on the distance matrix of gene content. Interestingly, when other genera are separated based on this analysis, Escherichia and Shigella are overlapped, it is coincident with another previous research that reveals Shigella is a subgenus of Escherichia (Lan and Reeves, 2002).
Figure 1. Overview process of inferring phylogenomic relationship by UBCG software. Data obtained from Na et al., (2018).
There are different approaches to describing phylogenetic tree inference based on genomic data. SNP sites in the genome also used as the marker for phylogenetic inference. Software such as kSNP (Gardner and Hall, 2013) and SNPhylo (Lee et al., 2014) chose this approach.
Alignment-free methods are also focused due to the bias in the sequence alignment (Golubchik et al., 2007). CVTree used composition vector as reconstruct phylogenetic relationship (Qi et al., 2004a). The vector is built from k-mer frequency with applying Markov model for subtracting the random neutral mutations, and calculating cosine function-based distance matrix (Qi et al., 2004b).
Feature frequency profile (FFP) is also an alignment-free method, calculate the Jensen-Shannon divergence matrix based on k-mer frequency (Sims et al., 2009).
For both approaches, UPGMA dendrograms were inferred from the matrices.
Indeed, those alignment-free methods are not real ‘phylogenetic tree’ due to lack of evolutionary model, still can be utilized as the guide map for reconstructing genuine phylogenetic trees (Katoh and Toh, 2007).
1.4. Purpose of this study
The ultimate goal of this paper is to establish the boundary of bacterial species isolated from soil and the human body, both newly identifying the previously undiscovered species and curating the phenotype-based identification into genomic-based identification. Therefore, current microbial species delineation criteria which occur lots of confusions and wrong identifications will be abolished, and the definition of prokaryotic species and its boundaries based on more objective criteria will be established.
This study made up of three parts. The first part re-examines the confidence of chemotaxonomy and demonstrates that Turicella is not an independent genus from Corynebacterium based on genomic screening data. The second part identifies novel prokaryotic species, proven the novelty by genomic relatedness data. The third part shows the relationship between Bacillus cereus and Bacillus thuringiensis, and propose the genomovars of Bacillus thuringiensis, based on multiple approaches of genomic analysis.
On the basis of several cases, this study would like to indicate that the fallacy of current phenotype-based taxonomy and insistent that genome is the constant evidence containing true evolutionary history.
CHAPTER 2.
Phylogeny Trumps Chemotaxonomy
2.1. Introduction
Actinobacteria is one of the major bacterial phyla, consisting of gram-positive bacteria with the high G+C content genome. Actinobacteria inhabit various environments such as soil, ocean and the human body. Many pathogens such as Mycobacterium tuberculosis and Nocardia asteroids belong to Actinobacteria.
Tuberculosis is the disease that causes more than one million death per year, which caused by infection of Mycobacterium tuberculosis complex (MTBC), and the emergence of antibiotic-resistant strains has emerged as a new problem in tuberculosis treatment (Sandhu, 2011).
The order Corynebacteriales, an order in Actinobacteria, circumscribes which are important in clinical, industrial, and environmental aspects (Goodfellow and Jones, 2015; Lehmann and Neumann, 1896). This taxon is widely known as the presence of mycolic acids (MA), a special type of branched fatty acid consists of two long chains. MAs are known to act as a cell wall permeability barricade that argues to antibiotics and phagocytes (Gebhardt et al., 2007). The length and double bonds in MAs are employed as substantial chemotaxonomic markers for demarcating between genera classified in Corynebacteriales (Bernard et al., 2010;
Marrakchi et al., 2014), except for some MA-lacked species (Collins et al., 1998;
Funke et al., 1994; Wiertz et al., 2013). The classification of MA-containing taxon groups was directed by a combination of 16S rRNA gene sequence and chemotaxonomic characteristics. Based on those criteria, several new genera such as Hoyosella (Jurado et al., 2009) and Lawsonella (Bell et al., 2016) were described. However, the absence of agreement between these sets of data in some
taxon needs to use the extra clue to signify this circumstance.
The classification of the genus Turicella is such a case. The type and only species in this genus, Turicella otitidis, was originally proposed to harbor bacterial strains isolated from the ear of an otitis media patient (Funke et al., 1994). In this study, the type strain of T. otitidis was reclaimed as a sister taxon to Corynebacterium based on 16S rRNA tree and two distinct chemotaxonomic markers; 1) the presence of fully unsaturated menaquinones (MK-10 and MK-11) as contradicting to partially saturated MKs in Corynebacterium [MK-8(H2) and MK-9(H2)], and 2) lack of MA whereas most Corynebacterium species contain MA.
However, succeeding studies using more 16S rRNA gene sequences demonstrated that Turicella formed a phyletic lineage within the Corynebacterium clade (Goyache et al., 2003; Hall et al., 2003).
Two major fatty acid biosynthesis pathways, FAS-I (Fatty acid synthesis-I) and FAS-II (Fatty acid synthesis-II) cycles are known in Actinobacteria (Marrakchi et al., 2014). One gene (3-oxoacyl-ACP synthase; fas) is charged in whole steps in FAS-I pathway (Bloch and Vance, 1977), whereas four essential genes are burden in FAS-II pathway, which are beta-ketoacyl-ACP synthase (kasA) (Bhatt et al., 2005), beta-ketoacyl-ACP reductase (mabA; Parish et al., 2007), (3R)-hydroxy acyl-ACP dehydratase subunit B (hadB; Brown et al., 2007; Sacco et al., 2007) and (NADH)dependent trans-2-enoyl-ACP reductase (inhA; Vilcheze et al., 2000).
Mycobacterium species are known to possess both FAS-I and FAS-II pathway, whereas most Corynebacterium species contain only FAS-I pathway. It is revealed that Corynebacterium jeikeium and Corynebacterium urealyticum have neither the FAS-I nor FAS-II cycle and absorb fatty acids from the exogenous environment (Tauch et al., 2005; Tauch et al., 2008).
MAs are synthesized by conjugation of two long chain fatty acids, which are carboxylated
α
-branch fatty acid and meromycolic acid. The carboxylatedα
-branch fatty acid was formed by acyl-CoA carboxylase (accD4) and acetyl-CoA carboxylase (Gande et al., 2007). The meromycolic acid was formed after modification steps including desaturation (NADPH-dependent stearoyl-CoA 9- desaturase; desA3; Cole et al., 1998), Then, long-chain fatty acid AMP ligase (fadD32) leads to the synthesis of the meromycolic acid (Portevin et al., 2005).Eventually, MAs are formed by merging two fatty acids by polyketide synthase 13 (pks13) (Portevin et al., 2004). It is known that a single operon consists of three genes (fadD32-pks13-accD4) is substantial for MA formation (Portevin et al., 2005). Also, two beta subunits of carboxylases (accD4 and accD5) are also necessary for MA forming (Gande et al., 2004).
Isoprenoid quinone plays the role of electron and proton transporter in the electron transport system of photosynthesis and cellular respiration in many species.
Two types of quinones in prokaryote cell are naphthoquinone and benzoquinone, MK corresponds to former, and UQ corresponds to the latter. Gram-positive bacteria have MK, while gram-negative bacteria have UQ (Nowicka and Kruk, 2010). Some species such as Escherichia coli have both MK and UQ (Meganathan and Kwon, 2009). In Actinobacteria, most species have MK as a respiratory quinone. Species in Nocardia, Skermania, and Smaragdicoccus have cyclic MK, having a cyclized ring at the end of the isoprenoid chain (Adachi et al., 2007; Chun et al., 1997). Some species produce other types of quinone instead of MK. Species belonging to Bifidobacterium don’t have respiratory quinone. They obtain quinone from the host or the surrounding environment (Ramotar et al., 1984).
Classical MK pathway synthesizes MK via isochorismate (Bentley and Meganathan, 1982). An alternative pathway produces MK via futalosine (Seto et al., 2008). Among the species belonging to Actinobacteria, MK biosynthesis pathway through isochorismate was discovered in M. tuberculosis (Dhiman et al., 2009), while Streptomyces coelicolor has MK biosynthesis pathway via futalosine (Hiratsuka et al., 2008).
The length and saturated sites in isoprenoid chain of MK are factors for species identification (Collins and Jones, 1981). Also, the enzyme menaquinone reductase (menJ) was discovered (Upadhyay et al., 2015), which confers the saturation of MK in M. tuberculosis. The deletion of this gene guides to the production of fully unsaturated MK (MK-9) instead of normal partially saturated MK [MK-9(H2)].
In this study, we re-examine the opaque taxonomic status of the genus Turicella using genome-based phylogenetics and comparative genomics of genes charged in synthesizing or modifying chemotaxonomic markers. Based on the genomic evidence, Turicella otitidis need to be classified in the genus Corynebacterium, reclassify as Corynebacterium otitidis.
2.2. Materials and Methods
2.2.1. Genome sequences and identification of genes
A set of 93 genome sequences which are type strains of 77 Corynebacterium spp., one T. otitidis (Brinkrolf et al., 2012), and 14 genomes that are representative for each genus in the order Corynebacteriales (Dietzia alimentaria, Gordonia bronchialis, Hoyosella altamirensis, Lawsonella clevelandensis, Millisia brevis, Mycobacterium tuberculosis, Nocardia asteroides, Rhodococcus rhodochrous, Segniliparus rotundus, Skermania piniformis, Smaragdicoccus niigatensis, Tomitella biformata, Tsukamurella paurometabola and Williamsia muralis). The type strain of Pseudonocardia thermophila was used as an outgroup. The genomic contigs and their predicted CDS sequences were obtained from the EzBioCloud database (https://www.ezbiocloud.net/; Yoon et al., 2017a). Genes corresponds to chemotaxonomic markers of Corynebacteriales were detected BLASTX search using BLAST+ v. 2.2.29 software (E-value cutoff = 1e-5, bit score cutoff = 100, identity cutoff = 30%; Rost, 1999). The alignment-based searching was executed against the reference gene sequences. For MA biosynthesis genes, genes of M.
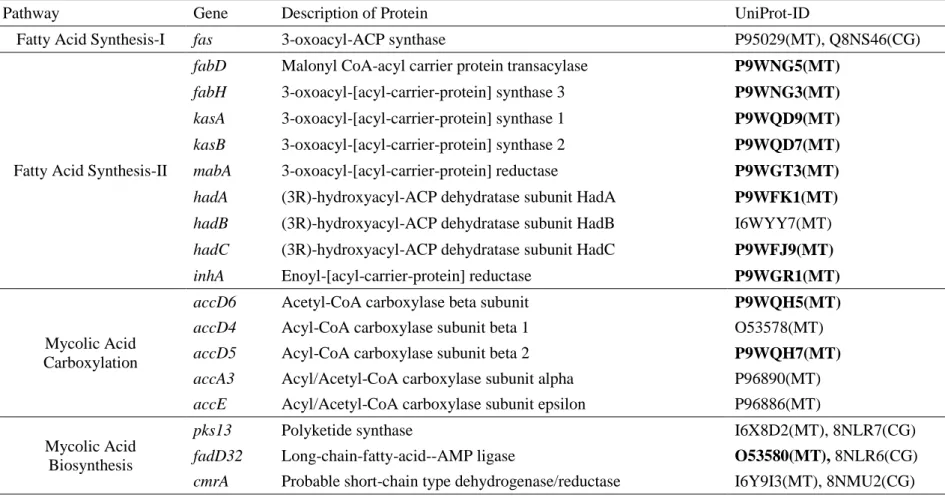
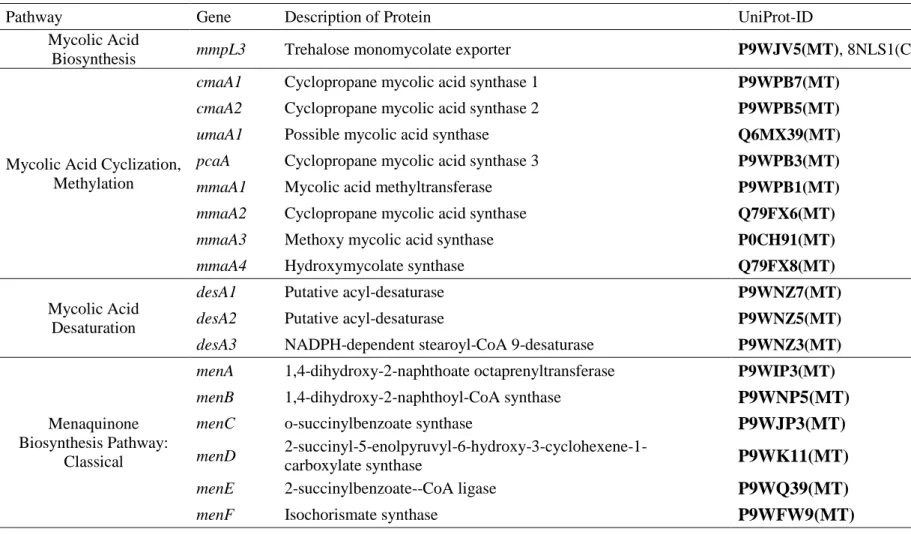
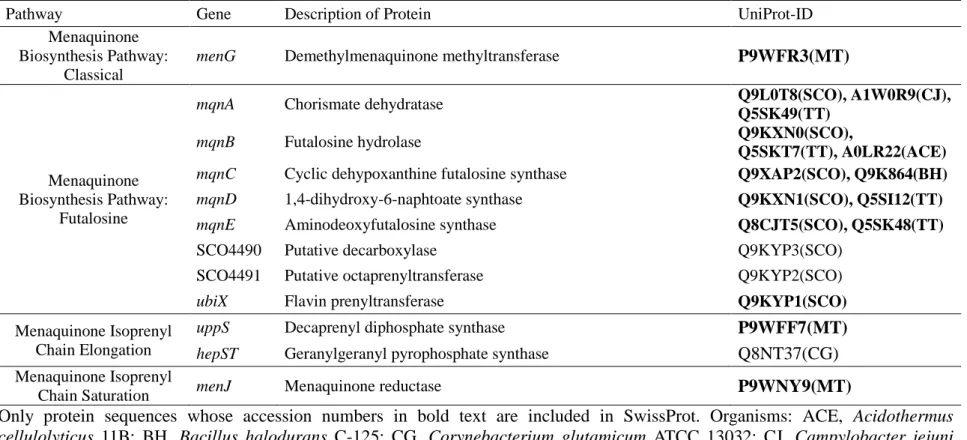
tuberculosis and Corynebacterium glutamicum were used as references (Gande et al., 2007; Ikeda and Nakagawa, 2003; Marrakchi et al., 2014; Takeno et al., 2013), and for MK biosynthesis genes, mainly M. tuberculosis and Streptomyces coelicolor (Seto et al., 2008), were used as references (Boutet et al., 2016). All the reference gene sequences were downloaded from UniProt (Universal Protein Resource; http://www.uniprot.org/) database (Apweiler et al., 2004), which are listed in Table 1.
Table 1. Reference genes used in the analysis
Pathway Gene Description of Protein UniProt-ID
Fatty Acid Synthesis-I fas 3-oxoacyl-ACP synthase P95029(MT), Q8NS46(CG)
Fatty Acid Synthesis-II
fabD Malonyl CoA-acyl carrier protein transacylase P9WNG5(MT)
fabH 3-oxoacyl-[acyl-carrier-protein] synthase 3 P9WNG3(MT)
kasA 3-oxoacyl-[acyl-carrier-protein] synthase 1 P9WQD9(MT)
kasB 3-oxoacyl-[acyl-carrier-protein] synthase 2 P9WQD7(MT)
mabA 3-oxoacyl-[acyl-carrier-protein] reductase P9WGT3(MT)
hadA (3R)-hydroxyacyl-ACP dehydratase subunit HadA P9WFK1(MT) hadB (3R)-hydroxyacyl-ACP dehydratase subunit HadB I6WYY7(MT) hadC (3R)-hydroxyacyl-ACP dehydratase subunit HadC P9WFJ9(MT)
inhA Enoyl-[acyl-carrier-protein] reductase P9WGR1(MT)
Mycolic Acid Carboxylation
accD6 Acetyl-CoA carboxylase beta subunit P9WQH5(MT)
accD4 Acyl-CoA carboxylase subunit beta 1 O53578(MT)
accD5 Acyl-CoA carboxylase subunit beta 2 P9WQH7(MT)
accA3 Acyl/Acetyl-CoA carboxylase subunit alpha P96890(MT) accE Acyl/Acetyl-CoA carboxylase subunit epsilon P96886(MT) Mycolic Acid
Biosynthesis
pks13 Polyketide synthase I6X8D2(MT), 8NLR7(CG)
fadD32 Long-chain-fatty-acid--AMP ligase O53580(MT), 8NLR6(CG)
cmrA Probable short-chain type dehydrogenase/reductase I6Y9I3(MT), 8NMU2(CG)
Table 1. Continued.
Pathway Gene Description of Protein UniProt-ID
Mycolic Acid
Biosynthesis mmpL3 Trehalose monomycolate exporter P9WJV5(MT), 8NLS1(CG)
Mycolic Acid Cyclization, Methylation
cmaA1 Cyclopropane mycolic acid synthase 1 P9WPB7(MT)
cmaA2 Cyclopropane mycolic acid synthase 2 P9WPB5(MT)
umaA1 Possible mycolic acid synthase Q6MX39(MT)
pcaA Cyclopropane mycolic acid synthase 3 P9WPB3(MT)
mmaA1 Mycolic acid methyltransferase P9WPB1(MT)
mmaA2 Cyclopropane mycolic acid synthase Q79FX6(MT)
mmaA3 Methoxy mycolic acid synthase P0CH91(MT)
mmaA4 Hydroxymycolate synthase Q79FX8(MT)
Mycolic Acid Desaturation
desA1 Putative acyl-desaturase P9WNZ7(MT)
desA2 Putative acyl-desaturase P9WNZ5(MT)
desA3 NADPH-dependent stearoyl-CoA 9-desaturase P9WNZ3(MT)
Menaquinone Biosynthesis Pathway:
Classical
menA 1,4-dihydroxy-2-naphthoate octaprenyltransferase P9WIP3(MT)
menB 1,4-dihydroxy-2-naphthoyl-CoA synthase P9WNP5(MT)
menC o-succinylbenzoate synthase P9WJP3(MT)
menD 2-succinyl-5-enolpyruvyl-6-hydroxy-3-cyclohexene-1-
carboxylate synthase P9WK11(MT)
menE 2-succinylbenzoate--CoA ligase P9WQ39(MT)
menF Isochorismate synthase P9WFW9(MT)
Table 1. Continued.
Pathway Gene Description of Protein UniProt-ID
Menaquinone Biosynthesis Pathway:
Classical
menG Demethylmenaquinone methyltransferase P9WFR3(MT)
Menaquinone Biosynthesis Pathway:
Futalosine
mqnA Chorismate dehydratase Q9L0T8(SCO), A1W0R9(CJ),
Q5SK49(TT)
mqnB Futalosine hydrolase Q9KXN0(SCO),
Q5SKT7(TT), A0LR22(ACE) mqnC Cyclic dehypoxanthine futalosine synthase Q9XAP2(SCO), Q9K864(BH)
mqnD 1,4-dihydroxy-6-naphtoate synthase Q9KXN1(SCO), Q5SI12(TT)
mqnE Aminodeoxyfutalosine synthase Q8CJT5(SCO), Q5SK48(TT)
SCO4490 Putative decarboxylase Q9KYP3(SCO)
SCO4491 Putative octaprenyltransferase Q9KYP2(SCO)
ubiX Flavin prenyltransferase Q9KYP1(SCO)
Menaquinone Isoprenyl Chain Elongation
uppS Decaprenyl diphosphate synthase P9WFF7(MT)
hepST Geranylgeranyl pyrophosphate synthase
Q8NT37(CG)
Menaquinone Isoprenyl
Chain Saturation menJ Menaquinone reductase P9WNY9(MT)
Only protein sequences whose accession numbers in bold text are included in SwissProt. Organisms: ACE,
Acidothermus cellulolyticus 11B; BH, Bacillus halodurans C-125; CG, Corynebacterium glutamicum ATCC 13032; CJ, Campylobacter jejunisubsp.
jejuni serotype O:23/36; MT, Mycobacterium tuberculosis H37Rv; SCO, Streptomyces coelicolor A3(2); TT, Thermus thermophilus HB82.2.2. Phylogenetic analysis
The bacterial ubiquitous gene-based phylogenetic analysis was executed by using the UBCG pipeline (Na et al., 2018). Based on the concatenated gene sequences extracted by UBCG, an ML phylogenetic tree was carried out by RAxML version 8.2.8 (Stamatakis, 2014) with applying the GTRGAMMA model and 100 bootstrap replications (Felsenstein, 1985). Another ubiquitous gene-based phylogenomic analysis was performed using PhyloPhlAn (Segata et al., 2013) based on CDS sequences of each genome downloaded in the previous step. The FastTree2 software implemented in this software was utilized to reconstruct an approximated ML tree (Liu et al., 2011; Price et al., 2010). The 16S rRNA gene sequences of those species were downloaded from the EzBioCloud database and aligned manually established on the secondary structure information by EzEditor2 software (Jeon et al., 2014). An ML phylogenetic tree based on 16S rRNA gene sequence was inferred by RAxML version 8.2.8 with applying the GTRGAMMA model and 1,000 bootstrap replications (Felsenstein, 1985).
A concatenated sequence alignment was generated from seven genes responsible for MK biosynthesis (menA ~ menG) to infer the evolutionary history of genes involved in the biosynthesis of MK as a chemotaxonomic marker. Then, the phylogenetic relationship of the pathway was elucidated using RAxML. Before concatenation, each gene was aligned separately using MAFFT software (v. 7.310;
Katoh and Standley, 2014). The Evolview web server (http://evolgenius.info/evolview/) was used to visualize the phylogenomic trees with information on the presence of genes (He et al., 2016).
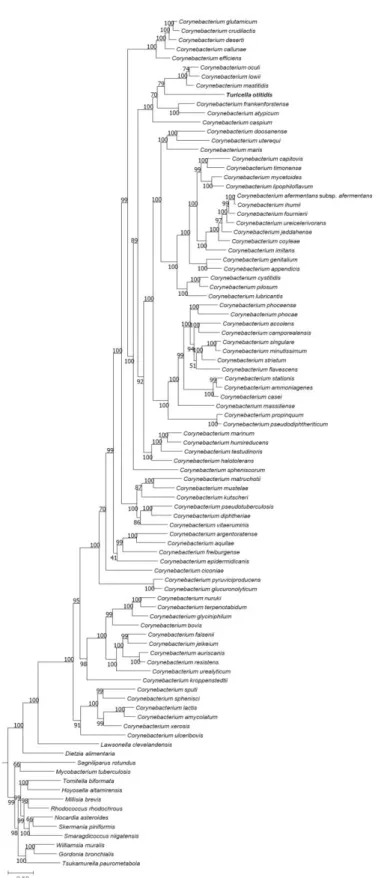
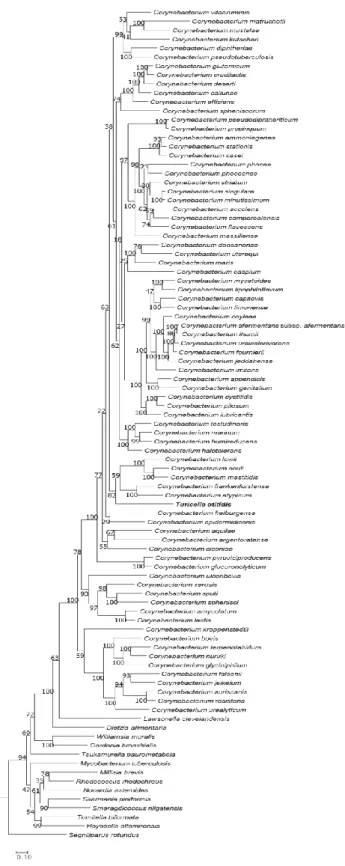
2.3. Results
The type strain of T. otitidis and Corynebacterium spp. shaped a monophyletic clade in the phylogenomic trees inferred by both UBCG (Figure 2) and PhyloPhlAn (Figure 3) pipelines. The topology and phylogenetic relationships exhibited in the trees agree with those from previous studies (Wu et al., 2013; Wu and Eisen, 2008), and also consistent with the analysis in this study based on 16S rRNA phylogeny (Figure 4). It is clear that, even though the ordinary study classified T. otitidis as an independent genus (Funke et al., 1994), the analysis in this study pointing that it is a bona fide member of Corynebacterium.
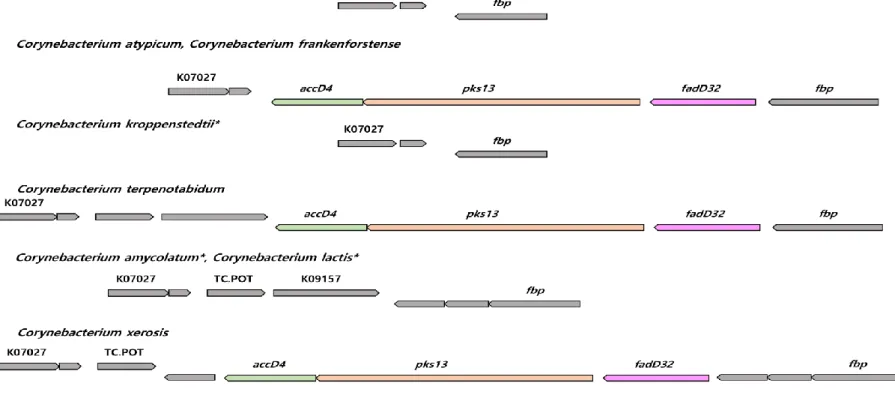
The type genomes of T. otitidis and those of 61 out of the 77 Corynebacterium spp. contain the fas gene, charged solely in FAS-I pathway. Four substantial genes in the FAS-II pathway (mabA, inhA, kasA and hadB) are lacked from the genomes of T. otitidis and the Corynebacterium spp. Dietzia alimentaria partially absent FAS-II pathway (lacked kasA and hadB), and L. clevelandensis lacks both FAS pathways in its genome. Comparative genomic analysis showed that T. otitidis and three MA lacked Corynebacterium species (Corynebacterium amycolatum, Corynebacterium kroppenstedtii, and Corynebacterium lactis) do not have the fadD32-pks13-accD4 operon. The loss of this operon is also confirmed by gene synteny, which normally located between PS1 protein and UPF0104 membrane protein (Figure 5). Another essential gene for MA biosynthesis, cmrA was also lacked in those species. In contrast, even MA lacked species contain other carboxylase subunits (accD2 and accD3). Among the MA modification genes, genes homologous to desA3 were found in 23 of the Corynebacterium species,
around 50% sequence identity compared to the reference.
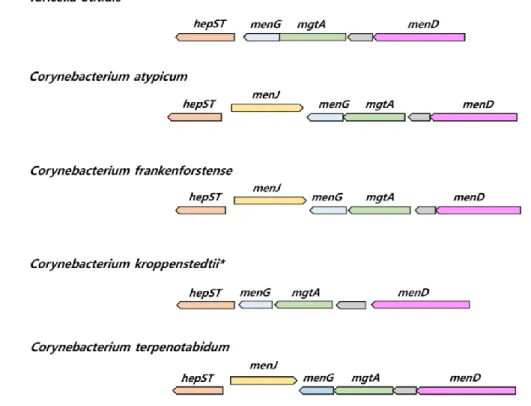
In case of menJ gene burden in the saturation of isoprenoid chain of MK, it is lacked in C. kroppenstedtii (MK-8), H. altamirensis (MK-8), L. clevelandensis (MK-9), Tsukamurella paurometabola (MK-9) and T. otitidis (MK-10, MK-11). All those species contain fully unsaturated MK. The gene synteny of corresponding species indicates that the original position of the menJ gene is located between hepST and menG gene, which is lost in the mentioned species (Figure 6).
All analyzed strains containing the isochorismate pathway as MK biosynthesis pathway, and no analyzed strains contain futalosine pathway. The phylogenetic trees based on the concatenation of seven genes (menA ~ menG) responsible for the isochorismate pathway of MK biosynthesis were generated (Figure 7). Lies with the phylogenetic trees analyzed in above, both nucleotide and amino acid gene concatenated trees support the involvement of T. otitidis within Corynebacterium genus, even though the detail evolutionary history between the member species differs.
Figure 2. Genome-based phylogenetic tree of T. otitidis and neighboring species, reconstructed by the UBCG phylogenomic pipeline. The bar in the below signifies substitution rate per site. Blocks in the column plots on the right side indicate the presence of each gene (or gene sets). Colored blocks indicate that the gene is present in the genome, and white blocks (with Δ sign) signify its absence. Numbers at the nodes indicate the bootstrap value of RAxML. Features and their corresponding genes: MA, mycolic acid biosynthetic genes; FAS1, fatty acid synthesis cycle 1 (fas); FAS2, fatty acid synthesis cycle 2 (mabA, inhA, kasA, and hadB); DesA3, NADPH-dependent stearoyl-CoA 9-desaturase; MenJ, menaquinone reductase.
Figure 3. Genome-based phylogenetic tree of T. otitidis and neighboring species, reconstructed by the PhyloPhlAn phylogenomic pipeline.
Figure 5. The synteny plot of gene families near fadD32-pks13-accD4 operon site of species whose mycolic acid is absent and their phylogenetically neighboring species. Mycolic acid lacked species are marked with an asterisk. accD4, acyl-CoA carboxylase subunit beta 1;
pks13, polyketide synthase; fadD32, long-chain-fatty-acid-AMP ligase; K07027, UPF0104 membrane protein; fbp, protein PS1; TC.POT, di/tripeptide transporter; K09157, UPF0210 protein.
Figure 6. The synteny plot of gene families near menJ gene site of T. otitidis and related species. Species who lacked menJ gene are marked with an asterisk. hepST, geranyl pyrophosphate synthase; menG, demethylmenaquinone methyltransferase; mgtA, GDP-mannose-dependent alpha-mannosyltransferase; menD, 2-succinyl-5-enolpyruvyl-6-hydroxy-3-cyclohexene-1-carboxylate synthase.
Figure 7. Phylogenetic tree reconstructed based on amino acid sequence of seven MK biosynthesis genes for T. otitidis and its close species.
2.4. Discussion
The application of chemotaxonomy influenced the improvements in prokaryotic systematics (Goodfellow et al., 2012), even though the following limitations. First, the experimental procedure to obtain chemotaxonomic characteristics can be altered by cultivation conditions. For instance, fatty acid profiles are known to be not consistent by changing temperature (Russell, 1984). Also, even some binary characteristics are prone to experimental error. The presence of MA of the order Corynebacteriales is one of such an example (Goodfellow and Jones, 2015).
Corynebacterium atypicum, Hoyosella altarmirensis, and Hoyosella subflava lacked mycolic acids according to the initial report (Hall et al., 2003; Jurado et al., 2009; Wang et al., 2010), but those were found to be misplaced in light of later studies (Hamada et al., 2016; Laneelle et al., 2012; Li et al., 2016; Tippelt et al., 2014). As an another case, the report that the type strain of Corynebacterium amycolatum contained major amounts of dihydrogenated MKs with eight and nine isoprenoid units (Collins et al., 1988) was overturned by the discovery that this organism was rich in fully unsaturated MKs with nine isoprene units (Jurado et al., 2009; Kampfer et al., 1999). In a broader insight, it has been picked out that the interpretation of polar lipid patterns based on two-dimensional thin-layer- chromatography is innately subjective (Sutcliffe et al., 2012; Sutcliffe et al., 2013) while evidence that MK composition can be significantly influenced when biomass is harvested at different stages of the growth cycle has generally been overlooked (Saddler et al., 1986).
Such problems are mixed with the loss of single gene or operon affects
chemotaxonomic features, as like the case of fatty acid biosynthesis gene loss in some Corynebacterium species (Figure 5, Figure 6), and hence chemotaxonomy does not reflect phylogeny. For example, only menJ gene present species have saturated site in isoprenyl chain in their MK (Figure 2). Furthermore, there are two completely different MK biosynthetic pathways exist; isochorismate and futalosine (Seto et al., 2008). Moreover, the evolutionary history of those pathways was revealed (Zhi et al., 2014). Experimental chemotaxonomy cannot reflect the phylogenetic history like this case. Genomic data at present can not predict the length of the isoprenyl chain in MK.
The current phylogenetic approaches can provide reasonable ways of founding whether Corynebacteriales strains can synthesis MA. It is focusable that the gene set essential for synthesizing MA is present in the genome of C. atypicum and Hoyosella strains which have a mixed experimental result of the presence of MA. This genomic examination supports that those strains contain MA. The genomes of the type strains of Corynebacterium caspium and Corynebacterium ciconiae also contain those gene sets, suggesting that they may synthesize MA (Figure 2), even though earlier experimental result told that they could not synthesize MA (Collins et al., 2004; Fernandez-Garayzabal et al., 2004). It is also appealing that the genes indispensable for the FAS-II fatty acid pathway (hadB, inhA, kasA and mabA) are absent from the genome of T. otitidis and Corynebacterium strains but present in the genome of Mycobacterium tuberculosis, Nocardia asteroides and Rhodococcus erythropolis. Those measurements propose that genes related to the same pathway evolve linked to one another. Moreover, those data backing the hypothesis that consecutive gene gain or loss in a pathway
such events.
At present, the majority of phylogenomic analysis is based on single-copy ubiquitous orthologous genes (Wu et al., 2013; Wu and Eisen, 2008). This attempt yields consistent results although ones that may be biased as many of the selected genes associated with ribosomal proteins. Nevertheless, genes encoding important metabolic pathways can be applied to supplement current genome-driven phylogenetics. In this study, a phylogenetic tree based on the concatenated sequence of seven MK biosynthesis genes was used, because the type of MK biosynthesis pathway differ among bacterial taxa and they evolve one another.
The genomic analysis in this study can provide information on microbial structural phenotypes, without data based on the wet-lab experiment. For instance, the MK profile of the type strain of C. kroppenstedtii is reported as MK-8 (Jurado et al., 2009), and the genomic data detected the absence of menJ in its genome, which tells fully unsaturated MK is its major type. It is important that the existence of genes derived from genomic information can provide critical clues about the phenotypes, even though this information cannot cover for predicting all phenotypes at present.
When the genus Turicella was initially proposed (Funke et al., 1994), only three 16S rRNA gene sequences of the genus Corynebacterium were included in the phylogenetic analysis, leading to classify this species as a new genus. The presence of fully unsaturated MK and lack of MA in T. otitidis also supports this proposal. In this study, we showed that both two distinct features of T. otitidis are not its feature, and they are not sufficient for the phylogenetic marker. Those facts indicate that Turicella is a genuine member of the genus Corynebacterium, combined with the phylogenomics provides more reliable data than
chemotaxonomy in describing their evolutionary history and natural relationships, or that phylogenomics trumps chemotaxonomy. Consequently, it is proposed that T.
otitidis be reclassified as Corynebacterium otitidis comb. nov.
Emended description of the genus Corynebacterium Lehmann and Neumann 1896
The description is given by Bernard et al., (2010) with the following changes. Most species produce MKs with partially saturated isoprenoid chains (mainly MK-8(H2) and MK-9(H2)), but for some species, the fully unsaturated MKs (MK-8, MK-9, MK-10 and MK-11) were found.
Description of Corynebacterium otitidis (Funke et al., 1994) comb. nov.
Corynebacterium otitidis (o.ti'ti.dis. L. gen. n. of otitis, inflammation of the ear).
Basonym: Turicella otitidis Funke et al., 1994. This description is the same as that given by Funke et al., (1994). The type strain is 234/92T (=DSM 8821T = ATCC 51513T).
CHAPTER 3.
Identifying Two Novel Species in
Burkholderia sensu lato
3.1. Introduction
The genus Burkholderia was initially identified from seven species of Pseudomonas homologous group II (Yabuuchi et al., 1992). After that, microbes belonging to Burkholderia were discovered in agricultural soil (Draghi et al., 2014), contaminated soil (Liu et al., 2014), a plant-associated environment (Tian et al., 2013), and a wastewater treatment system (Lu et al., 2012). Most strains in this genus are Gram-stain negative, aerobic, non-motile, rod-shaped, and catalase- positive (Sheu et al., 2013).
Among the Burkholderia species, Burkholderia cepacia complex (BCC) is the most widely studied group. This group is comprised of more than 20 different species (Lipuma, 2005). Species in BCC act as an opportunistic pathogen for the outbreak of lung diseases when the host is under the status of immunodeficiency (Mahenthiralingam et al., 2005).
The taxonomic boundaries between species in the genus Burkholderia and its neighboring genera are not clear. The preceding research revealed that plant- associated Burkholderia spp. have lower G+C contents than Burkholderia spp. that are opportunistic human pathogens (Gyaneshwar et al., 2011). Therefore, the nomenclatures which were the member of genus Burkholderia were changed aftermath. Some members initially identified as Burkholderia were re-identified as Paraburkholdera by detecting their unique conserved signature indels (CSIs) and phylogenetic tree based upon concatenated sequences of conserved proteins (Sawana et al., 2014). According to the result, Burkholderia is consist of mainly animal and plant pathogens, whereas Paraburkholderia is composed of
Bukrholderia sensu lato as three genera (Burkholderia, Caballeronia and Paraburkholderia) in the basis of CSIs and phylogenetic tree reconstruction, with including the isolated strains in the period between the effective and valid publications of description of the genus Paraburkholderia (Dobritsa and Samadpour, 2016). The phylogenomic analysises of Burkholderia sensu lato is consequently executed, by applying multilocus sequence analysis (MLSA) approach (Beukes et al., 2017; Peeters et al., 2016). Moreover, the succeeding phylogenomic studies utilizing conserved protein sequence based tree revealed that there are more distinct genera in the Burkholderia sensu lato, which are Mycetohabitans (Estrada-de Los Santos et al., 2018), Robbsia (Lopes-Santos et al., 2017) and Trinickia (Estrada-de Los Santos et al., 2018).
3.2. Materials and Methods
3.2.1. Isolation and identification of novel species candidate
Soil samples were isolated from Gwanak Mountain in Seoul, Republic of Korea.
The bacterial strains were isolated by standard dilution method of Nutrient agar (NA; Difco). Single colonies were picked and cultured on the aerobic condition for a day. Two isolated strains, designated as JC2948T and JC2949T, respectively, were subcultured on the same environment and stored at -80°C in Nutrient broth (NB;
Difco) with 40% (v/v) glycerol for the stock. Reference strains for the identification were also equipped and cultivated as the same procedure with the two novel strains. The almost full length of 16S rRNA sequences (1,463 bp for JC2948T and 1,464 bp for JC2949T) was obtained by PCR, using 27F and 1492R bacterial universal primers as described in the previously published article (Chun and Goodfellow 1995). The obtained sequences were identified against the EzTaxon database (http://www.ezbiocloud.net/eztaxon) to find the neighboring valid species (Kim et al., 2012).
3.2.2. Reconstructing 16S rRNA phylogenetic trees
Phylogenetic trees based on 16S rRNA sequences were inferred by three approaches after manually aligned the sequences using EzEditor 2 (Jeon et al., 2014); neighbor-joining (NJ; Saitou and Nei, 1987), maximum-likelihood (ML;
Felsenstein 1981), and Bayesian (Yang and Rannala, 1997). NJ was inferred by MEGA 6 (Tamura et al., 2013) with applying the Jukes-Cantor model of nucleotide substitution (Jukes and Cantor, 1969) and 1,000 times bootstrapping. ML tree was
computing general time reversible (GTR) model of nucleotide substitution with four discrete gamma categories (Lanave et al., 1984). The Bayesian tree was inferred by MrBayes 3 (Ronquist and Huelsenbeck, 2003; Ronquist et al., 2012), by executing four Markov chains for 5,000,000 generations under the GTR model.
3.2.3. Genome sequencing and calculating ANI
The draft genome sequence of JC2948T and JC2949T and some of the reference genomes were determined by Illumina Miseq sequencing machine. Genomic libraries were equipped by using Nextera DNA sample preparation kit. The genomes of reference species were downloaded from EzBioCloud database (Yoon et al., 2017a).
3.2.4. Polyphasic experiments of novel species
The two strains and their reference strains were grown on NA for two days at 25°C to identify morphology and chemotaxonomic characteristics. Cellular morphology was observed by light microscopy (Axioskop 40; Carl Zeiss) and transmission electron microscopy (TEM; LIBRA 120; Carl Zeiss). Cellular motility was investigated on the soft agar (0.4%). Catalase activity was examined by forming oxygen bubbles after the application of 3% (v/v) H2O2 solution. The biochemical characteristics were determined by the standard method as described (Smibert and Kreig 1994). Additional biochemical tests were held by using API 20NE and API ZYM kits (bioMerieux). Those tests were performed in triplicate. The API 20NE tests were translated after 24h of incubation at 30 °C and the API ZYM tests were translated after 4h of incubation at 37 °C. The fatty acid composition was revealed by extracting fatty acid as the standard FAME method of the Microbial
Identification System (MIDI) version 6.0 and carried out by using gas chromatography (GC) founded on the RTSBA6 database (Sasser 2001). Polar lipid extraction from 50mg of the freeze-dried cell was performed followed by two- dimensional TLC (Embley and Wait, 1994).
3.2.5. Phylogenomic analysis of Burkholderia sensu lato
Genomes identified as Burkholderia sensu lato in EzBioCloud database were downloaded (Yoon et al., 2017a), except for low-quality genomes. Based on the 92 downloaded genomes, the phylogenomic tree was reconstructed using UBCG software (https://www.ezbiocloud.net/tools/ubcg; Na et al., 2018), which are genome-based phylogenetic tree reconstruction software based on universal genes.
The reconstruction of the phylogenomic tree was executed with applying default parameters, except for applying RAxML software in tree reconstructing process (Stamatakis, 2014), to obtain more rigorous ML phylogenomic tree. Ralstonia pickettii ATCC 27511T was used as an outgroup in inferring the tree.
3.3. Results
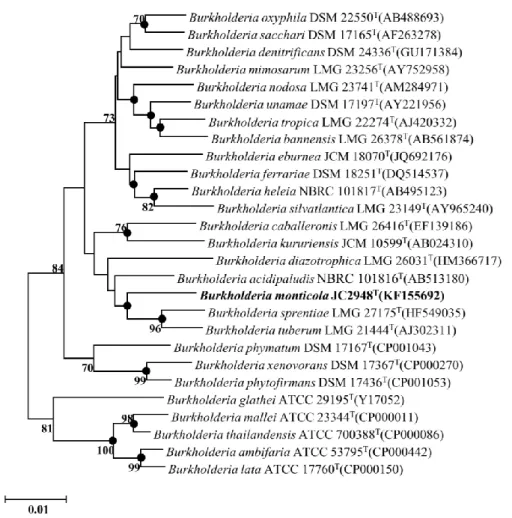
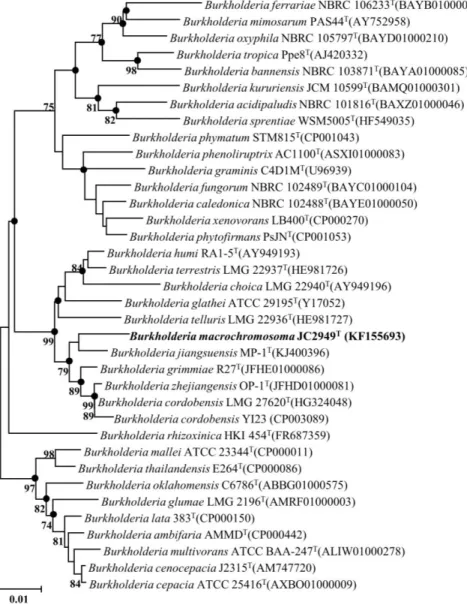
According to the EzTaxon database searching results, JC2948T showed the highest similarity to Burkholderia tropica LMG 22274T (97.6 %), Burkholderia acidipaludis NBRC 101816T (97.5 %), Burkholderia tuberum LMG 21444T (97.5 %), Burkholderia sprentiae LMG 27175T (97.4 %), Burkholderia terricola LMG 20594T (97.3 %) and Burkholderia diazotrophica LMG 26031T (97.1 %). On the other hand, JC2949T showed highest similarity to Burkholderia grimmiae R27T (98.8 %), Burkholderia cordobensis LMG 27620T (98.6 %), Burkholderia jiangsuensis MP-1TT (98.6 %), Burkholderia zhejiangensis OP-1T (98.5 %), Burkholderia humi LMG 22934T (97.5 %), Burkholderia terrestris LMG 22937T (97.3 %), Burkholderia telluris LMG 22936T (97.2 %) and Burkholderia glathei ATCC 29195T (97.0 %). For both JC2948T and JC2949T, the 16S rRNA sequence similarity was calculated with the reference sequences stored in EzTaxon database, and the phylogenetic relationship based on 16S rRNA gene can be shown as Figure 9 and 10, respectively.
Genome sequences of the two strains were acquired through Illumina Miseq platform. The 11.446 million paired-end reads and 3.729 million paired-end reads were generated after sequencing for JC2948T and JC2949T, respectively. The obtained reads were assembled into contigs using CLC Genomics Workbench 6.5 (CLCbio). The resultant draft genome sequence is 30 contigs and 7.85Mb for JC2948T, and 292 contigs and 9.5Mb for JC2949T. Based on the two genomic contigs and downloaded genomes of their neighboring species, The ANI value was calculated. The ANI values between strain JC2948T and the related type strains were calculated to be 89.7% (Burkholderia tuberum LMG 21444T), 89.2%
(Burkholderia sprentiae LMG 27175T), 78.0% (Burkholderia acidipaludis NBRC 101816T), and 78.0% (Burkholderia tropica LMG 22274T). Those pairwise calculated ANI values were visualized as a dendrogram (Figure 11). The ANI values between strain JC2949T and related type strains were calculated to be 90.4%
(Burkholderia jiangsuensis MP-1TT), 87.4% (Burkholderia zhejiangensis OP-1T), 86.2% (Burkholderia cordobensis YI23), 82.2% (Burkholderia grimmiae R27T), and 80.8% (Burkholderia glathei ATCC 29195T). Those pairwise calculated ANI values were visualized as a dendrogram (Figure 12).
Figure 9. Neighbor-Joining tree based on 16S rRNA gen