저작자표시-비영리-변경금지 2.0 대한민국 이용자는 아래의 조건을 따르는 경우에 한하여 자유롭게
l 이 저작물을 복제, 배포, 전송, 전시, 공연 및 방송할 수 있습니다. 다음과 같은 조건을 따라야 합니다:
l 귀하는, 이 저작물의 재이용이나 배포의 경우, 이 저작물에 적용된 이용허락조건 을 명확하게 나타내어야 합니다.
l 저작권자로부터 별도의 허가를 받으면 이러한 조건들은 적용되지 않습니다.
저작권법에 따른 이용자의 권리는 위의 내용에 의하여 영향을 받지 않습니다. 이것은 이용허락규약(Legal Code)을 이해하기 쉽게 요약한 것입니다.
Disclaimer
저작자표시. 귀하는 원저작자를 표시하여야 합니다.
비영리. 귀하는 이 저작물을 영리 목적으로 이용할 수 없습니다.
변경금지. 귀하는 이 저작물을 개작, 변형 또는 가공할 수 없습니다.
수의학 석사 학위논문
Different effects of Lace1 on white and brown adipogenic
differentiation in vitro.
Lactation elevated 1 (LACE1)이 in vitro 상에서 백색지방과 갈색지방의 분화에 끼치는 효과 연구
2017년 2 월
서울대학교 대학원
수의학과 수의생명과학전공
오 지 윤
ABSTRACT
Different effects of Lace1 on white and brown adipogenic
differentiation in vitro.
Lactation elevated 1 (LACE1)이 in vitro상에서 백색지방과 갈색지방의 분화에 끼치는 효과 연구
Ji Yun Oh Department of Veterinary Biomedical science College of Veterinary Medicine The Graduate School Seoul National University
The mammalian homologue of yeast Afg1, lactation elevated 1 (LACE1), has been known that regulates mitochondrial protein homeostasis, has an interaction with p53 and indicates pro-apoptotic activity in HEK293 cells. Functions of LACE1 in other cell types are
poorly understood. Thus, We measured the expression of LACE1 throughout adipogenic differentiation. Also, we knocked down the expression of LACE1 in 3T3-L1 white pre-adipocytes and HIB1B brown pre-adipocytes, and then induced differentiation. In present study, we report that LACE1 increases during white and brown adipogenesis using in vitro system. Knock-down of LACE1 leads
toincreases of mature white adipogenic marker (aP2), a main adipogenic transcription factors (C/ebpα, Pparγ) and exhibits down-regulations of brown adipocyte markers, mitochondrial biogenesis markers and mtDNA encoded complex Ⅳ subunits. Also, we observe that ablation of LACE1 induces reduction of p53 expression. We conclude that LACE1 inhibits white adipogenic differentiation and has a function in brown adipogenic differentiation.
keywords : Lactation elevated 1, LACE1, White adipogenesis, Brown adipogenesis
Student Number : 2014-22949
CONTENTS
Abstract...(ⅰ) Contents...(ⅱ) List of figures...(ⅲ) List of Table...(ⅳ) List of abbreviations...(ⅴ)
1. Introduction...(1)
2. Materials and Methods...(4)
3. Results...(9)
4. Discussion...(24)
Reference...(27)
Abstract in Korean...(31)
List of Figures
Figure 1. white and brown pre-adipocyte differentiation protocol.
Figure 2. Lace1 increases during white adipogenic differentiation.
Figure 3. Ablation of Lace1 leads to increased white adipogenic differentiation.
Figure 4. Lace1 increases during brown adipogenic differentiation.
Figure 5. Loss of Lace1 induces reduction of brown adipogenic markers.
Figure 6. Mitochondrial respiratory chain complex Ⅳ subunits decrease in LACE1 KD HIB1B cells.
Figure 7. Ablation of Lace1 leads to reduced p53 expression in white and brown adipogenesis.
Figure S1. mRNA expression of genes are involved in white adipogenesis throughout differentiation.
List of Table
Table 1. Primer sequences for quantitative RT-PCR
1. Introduction
There are two types of traditional adipose tissues in mammals: white adipose tissue (WAT) and brown adipose tissue (BAT). The balance of white and brown adipogenesis is crucial for an organism’s metabolic homeostasis. Disruption of the balance breaks the energy balance and it leads to not only obesity, type 2 diabetes but also various types of cancer. [13, 22, 24] Unilocular WAT have the ability to store excess energy in the forms of triglycerides. In contrast, multilocular BAT dissipate chemical energy as heat by non-shivering thermogenesis. BAT characterizes a high content of mitochondria and the expression of uncoupling protein 1 (UCP1). [11, 21] Functional definition of brown adipocytes is adipocytes that have the ability to express UCP1. [18]
Both white and brown adipocytes originate from mesenchymal stem cells (MSCs) in a course known as adipogenesis. However, in previous lineage-tracing studies, two types of adipocytes have been revealed that WAT are derived from the adipogenic lineage of myogenic factor 5 (Myf5)-negative cells and BAT are derived from the myogenic lineage of Myf5-positive cells. These previous studies indicate that BAT is closely related to skeletal muscle. [7, 19]
Nevertheless they are derived from different lineages, white and brown adipogenic differentiation share a common transcriptional cascade that regulates the late phase of adipogenesis. Peroxisome proliferator-activated receptor-g (PPARγ) , CCAAT/enhancer-binding
protein-a (C/EBPα) are crucial for adipogenesis and maintenance of mature adipocytes. PR domain containing 16 (PRDM16) has been known as key transcriptional factor in the brown adipogenic differentiation. BAT is differentiated form Myf5-positive cells under the signal of Prdm16. [10, 20, 23]
The tumor suppressor p53 has been already known to regulate cell cycle progression, apoptosis and to be inactivated or mutated in cancer. p53 is involved in development, differentiation and de-differentiation of various cell types to prevent cancer. [9, 26]
Although previous in vitro and in vivo studies show that p53 has a negative effect on white adipogenic differentiation, the role in brown adipogenic differentiation is poorly understood. [17] In V. Rotter study, they suggested that p53 is required for brown adipogenic differentiation. [16]
Lactation elevated 1 (LACE1) is a mammalian homologue of yeast mitochondrial Afg1 ATPase. Yeast Afg1 deletion strain revealed the decline of mitochondrially encoded complex Ⅳ subunits COX1 (Cytochrome c oxidase 1), COX2 and COX3. [12] However, in human embryonic kidney-293 (HEK293) cell line, LACE1 deletion induced up-regulation of nuclear encoded complex Ⅳ subunits COX4, COX5A and COX6A. Moreover, LACE1 has been known to be an inner mitochondrial membrane protein and it is essential for normal mitochondrial structure and mitochondrial protein homeostasis. [3] A recent study suggested that LACE1 was known to physically interact
with p53 in HEK293 cell line and its knockdown induced the increased resistance to apoptosis and reduced activity of the mitochondrial respiratory chain. [4] Very little is known about LACE1. Thus, it is unclear as respects the effects of LACE1 on other cell types including adipocytes. These data prompted us to study the roles of LACE1 in adipogenesis. In present study, we have examined expressions and effects of LACE1 throughout white and brown adipogenic differentiation via induction of differentiation in 3T3-L1 cell line and HIB1B cell line. And, we have investigated LACE1 expression in different types of wild-type mouse tissues and cold-challenged mouse iWAT.
2. Materials and Methods
Cell Culture and differentiation induction.
The mouse white pre-adipocyte cell line 3T3-L1 (purchased from the Korean Cell Line Bank) and the mouse brown pre-adipocyte cell line HIB1B (kindly provided by Kwang-Hee Bae) were maintained in Dulbecco’s modified Eagle’s medium (DMEM), (4.5 g/L glucose, 4 mM glutamine; #11965-092, Gibco, USA), supplemented with 10%
bovine calf serum (BCS) (Gibco, USA) at 37C in 5% CO2. Both cell lines were cultured to confluence and then induced differentiation after 2 days (Day 0). 3T3-L1 cell line was differentiated in DMEM with 10% fetal bovine serum (FBS) (Welgene, Korea) supplemented with 0.5 mM 3-isobutyl-1-methylxanthine (IBMX) (Sigma, USA), 1 μ M dexamethasone (Sigma, USA), and 5 μg/ml insulin (Sigma, USA).
After 48 h, cells were refed in DMEM with 10% FBS containing only insulin at the above concentrations. The media were refreshed every day for additional period of 6 days. For brown adipocyte differentiation, HIB1B cell line was exposed to the differentiation medium (DMEM with 10% BCS supplemented with 0.5mM IBMX, 1 μM dexamethasone, 5 μg/ml insulin and 1 nM triiodohyronin (T3) (Sigma, USA)). After 48 h, cells were cultured in DMEM supplemented 10% BCS containing insulin and T3 at the above concentrations with media renewal every day. On the Day 6, 1 μM isoproterenol (Sigma, USA) was added in the medium for 6 hours before harvest.
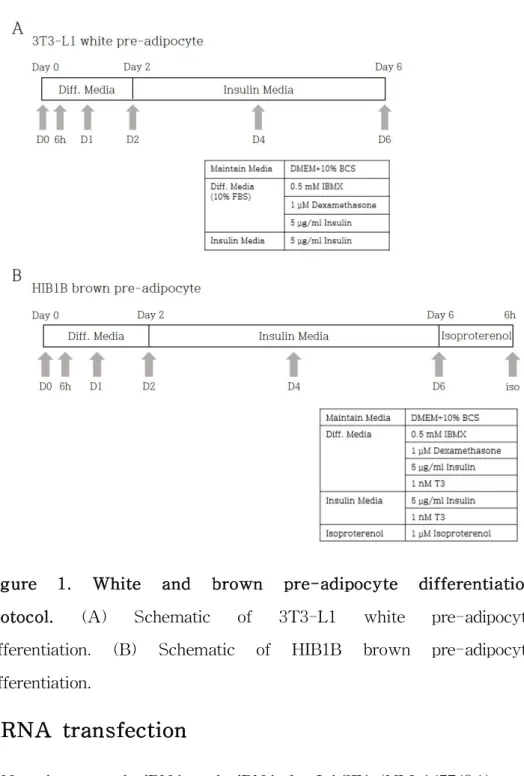
Figure 1. White and brown pre-adipocyte differentiation protocol. (A) Schematic of 3T3-L1 white pre-adipocyte differentiation. (B) Schematic of HIB1B brown pre-adipocyte differentiation.
siRNA transfection
Negative control siRNA and siRNA for LACE1 (NM_145743.1) were
obtained from Bioneer, Korea. Cell lines were transfected with siRNAs using Lipofectamine RNAiMAX (Invitrogen, USA) according to the manufacturer’s protocol.
RNA extraction and quantitative real time PCR.
Total RNA was extracted using TRIzol® (Invitrogen, USA) according to the manufacturer’s protocol. 1ug of total RNA was used for cDNA synthesis and reverse-transcribed using Accu-power®
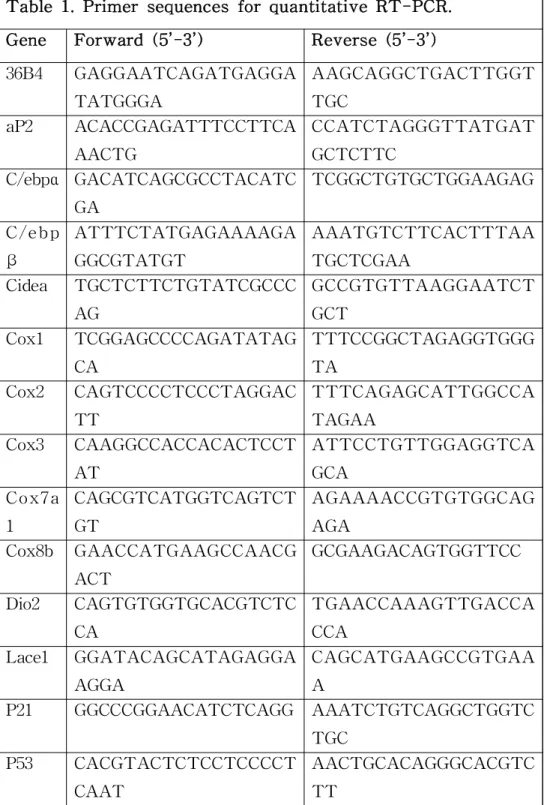
CycleScript RT PreMix (Bioneer, Korea). Quantitative RT-PCR was performed with SensiFAST SYBR® Lo-ROX Kit (Bioline, U.K.) using the AB 7500 RT-PCR system (Applied Biosystems, U.K.). For relative quantification of gene expression, we used the comparative Ct method (△△Ct). The housekeeping gene 36B4 was used as a control to normalize the variability in expression levels. qRT-PCR was performed in duplicates, and error bars in charts represent the corresponding standard deviations. The primer sequences used for qRT-PCR are listed in Table 1.
Table 1. Primer sequences for quantitative RT-PCR.
Gene Forward (5’-3’) Reverse (5’-3’) 36B4 GAGGAATCAGATGAGGA
TATGGGA
AAGCAGGCTGACTTGGT TGC
aP2 ACACCGAGATTTCCTTCA AACTG
CCATCTAGGGTTATGAT GCTCTTC
C/ebpα GACATCAGCGCCTACATC GA
TCGGCTGTGCTGGAAGAG C / e b p
β
ATTTCTATGAGAAAAGA GGCGTATGT
AAATGTCTTCACTTTAA TGCTCGAA
Cidea TGCTCTTCTGTATCGCCC AG
GCCGTGTTAAGGAATCT GCT
Cox1 TCGGAGCCCCAGATATAG CA
TTTCCGGCTAGAGGTGGG TA
Cox2 CAGTCCCCTCCCTAGGAC TT
TTTCAGAGCATTGGCCA TAGAA
Cox3 CAAGGCCACCACACTCCT AT
ATTCCTGTTGGAGGTCA GCA
Co x7 a 1
CAGCGTCATGGTCAGTCT GT
AGAAAACCGTGTGGCAG AGA
Cox8b GAACCATGAAGCCAACG ACT
GCGAAGACAGTGGTTCC Dio2 CAGTGTGGTGCACGTCTC
CA
TGAACCAAAGTTGACCA CCA
Lace1 GGATACAGCATAGAGGA AGGA
CAGCATGAAGCCGTGAA A
P21 GGCCCGGAACATCTCAGG AAATCTGTCAGGCTGGTC TGC
P53 CACGTACTCTCCTCCCCT CAAT
AACTGCACAGGGCACGTC TT
Pparγ TCAGGCTTCCACTATGGA GTTCA
GAAAAAACCCTTGCATCC TTCA
Prdm1 6
CAGCACGGTGAAGCCATT G
GCGTGCATCCGCTTGTG SDHA ACACAGACCTGGTGGAG
ACC
GGATGGGCTTGGAGTAA TCA
Tfam GTCCATAGGCACCGTATT GC
CCCATGCTGGAAAAACAC TT
Ucp1 ACTGCCACACCTCCAGTC ATT
CTTTGGCTCACTCAGGAT TGG
Statistics
Values were expressed as the means SEM of three duplicate runs.
Statistical analysis of gene expression differences was performed by the Student’s t-test between two groups in quantitative real-time PCR. P-value<0.05 was considered significant.
3. Results
Expression and role of Lace1 on white adipogenesis .
In previous studies, p53 has known to have a negative effect on white adipogenic differentiation. It prompted us to investigate the role of Lace1 during white adipogenic differentiation. We hypothesized that Lace1 could negatively affect to differentiation of white adipocytes.
First, to examine the expression pattern of Lace1 in the course of white adipogenic differentiation, we used 3T3-L1 cell line that serve white adipogenesis. The 3T3-L1 cell line is generally used as a model for differentiation of committed white pre-adipocytes into white adipocytes. [2] The 3T3-L1 cell line was induced to differentiate into white adipocytes as described under “Materials and Methods” (Fig.
1A). We analyzed mRNA expression of genes involved in white adipogenic differentiation were measured by qRT-PCR. The mature adipocyte marker (aP2) significantly increased from day 4 (Fig. 2).
Lace1 mRNA level was gradually increased during the differentiation of white adipocytes (Fig. 2).
Figure 2. Lace1 increases during white adipogenic differentiation. Relative mRNA expression levels of Lace1 and aP2 during white adipogenesis were measured by qRT-PCR. Values were normalized to 36B4. The data are presented as the means SEM of three duplicate runs.
Next, to test the effect of Lace1 on adipogenic differentiation of 3T3-L1 cells, we knocked down Lace1 by LACE1-specific siRNA (LACE1 KD) and compared with control siRNA transfected 3T3-L1 cells (siControl). Six days post-induction of differentiation, mRNA levels of adipogenic markers and Lace1 measured by qRT-PCR.
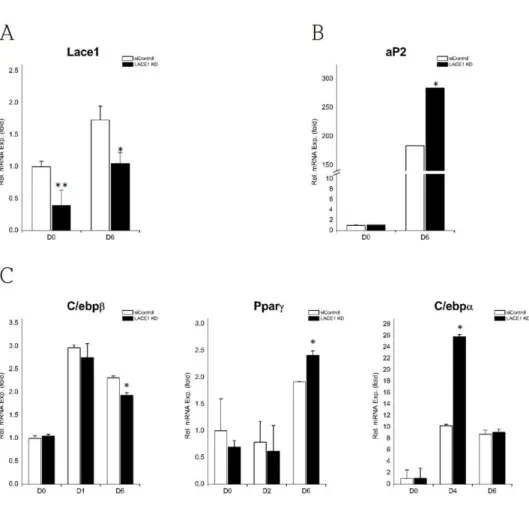
Lace1 mRNA expression was down-regulated in the LACE1 KD cells (Fig. 3A). Although basal mRNA level of aP2 was not affected by LACE1 KD, it was up-regulated following differentiation induction (Fig. 3B). Furthermore, we examined levels of other adipogenic markers (C/ebpβ, Pparγ, C/ebpα). The early adipogenic marker C/ebp β peaked at day 1 and then reduced (Fig. S1). In LACE1 KD cells, C/ebpβ mRNA level had no difference with siControl cells at day 1, but decreased further at day 6 (Fig. 3C). The intermediate adipogenic markers (Pparγ, C/ebpα) peaked each at day 2, day 4 and then declined (Fig.S1). Pparγ mRNA expression did not changed by LACE1 KD at day 2, however, it was increased at day 6. (Fig. 3C).
C/ebpα mRNA in LACE1 KD cells was highly expressed compared with that of siControl cells at day 4 (Fig. 3C).
Thus, loss of LACE1 leads to increased white adipogenic markers.
These results suggest that Lace1 has a negative effect on white adipogenic differentiation.
Figure 3. Ablation of Lace1 leads to increased white adipogenic differentiation. 3T3-L1 cells were transfected with control-siRNA (siControl) and LACE1-specific siRNA (LACE1 KD). (A) The effect of siRNA for LACE1 on Lace1 mRNA expression of white adipogenesis. (B) Relative mRNA expression level of mature white adipocyte marker (aP2,). (C) Relative mRNA expression levels of genes which are involved in white adipogenesis (C/ebpβ, Pparγ, C/ebpα). Relative mRNA expression levels were measured by
qRT-PCR and values were normalized to 36B4. The data are presented as the means SEM of three duplicate runs. *P<0.05,
**P<0.01**P<0.01 compared with siControl at same day.
Expression and role of Lace1 on brown adipogenesis .
In GEO data, Lace1 is highly expressed in BAT compared with in WAT. It prompted us to study whether Lace1 has a relation with brown adipogenesis. We evaluated Lace1 mRNA expression in brown adipogenic differentiation by qRT-PCR. The HIB1B cell line, a committed brown pre-adipocyte cell line, represents a model for the study of brown adipogenic. [14] The HIB1B cell line was also induced to differentiate into brown adipocytes as described under
“Materials and Methods” (Fig. 1B). Brown adipocyte markers (Ucp1, Dio2, Prdm16, Cidea) progressively increased (Fig. 4B). Brown adipogenic differentiation is accompanied by mitochondrial biogenesis.
[21] In agreement, the mRNA expression of genes involved in mitochondrial biogenesis (Cox7a1, Cox8b, Tfam) up-regulated gradually during brown adipogenesis (Fig. 4C). We found that mRNA level of Lace1 changed slightly, and a ~6-fold increase rapidly occurred after isoproterenol treatment (Fig. 4A). The degree of increase in brown adipogenesis was higher than that in white adipogenesis(~3.5-fold).
Figure 4. Lace1 increases during brown adipogenic differentiation. (A) Relative mRNA expression levels of Lace1 (B, C) Relative mRNA expression patterns of brown adipocyte markers (Ucp1, Dio2, Prdm16, Cidea) and mitochondrial biogenesis markers (Cox7a1, Cox8b, Tfam). Relative mRNA expression levels were measured by qRT-PC. Values were normalized to 36B4. The data are presented as the means SEM of three duplicate runs.
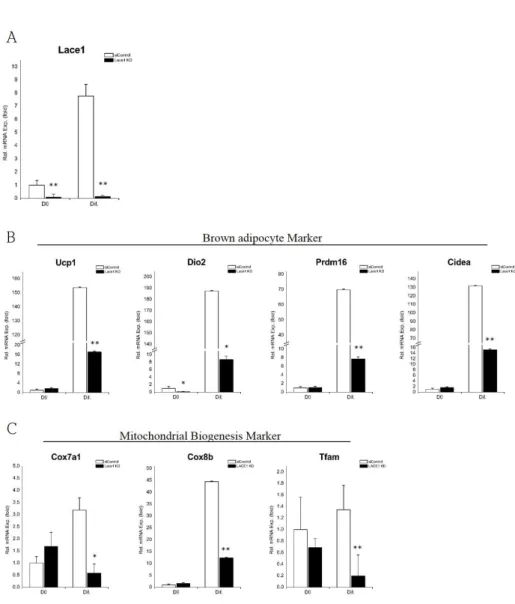
Then, to determine whether Lace1 has a role in brown adipocytes differentiation, we transfected HIB1B cells with siRNA for Lace1 (LACE1 KD) or control siRNA (siControl). The efficacy of LACE1-specific siRNA for knockdown was shown in Fig. 5A. Next, we measured mRNA expression levels of genes involved in brown adipocyte differentiation to investigate the effect of Lace1 on brown adipogenic differentiation. Levels of brown adipocyte markers (Ucp1, Dio2, Prdm16, Cidea) were decreased in LACE1 KD cells after induced differentiation (Fig. 5B). LACE1 KD featured the reduction of mitochondrial biogenesis markers (Cox7a1, Cox8b, Tfam) after differentiation (Fig. 5C). Most basal mRNA levels of markers were not affected by LACE1 KD. Furthermore, we determined the expression of mitochodnrial respiratory chain complex Ⅳ subunits.
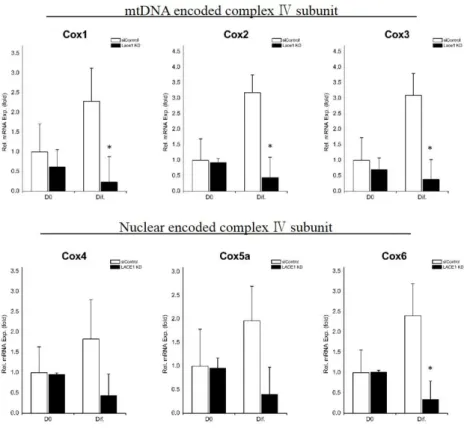
mtDNA encoded complex Ⅳ subunits (Cox1, Cox2, Cox3) in LACE1 KD were also decreased compared with those of siControl (Fig. 6) while almost nuclear encoded complex Ⅳ subunits (Cox4, Cox5a, Cox6) did not changed (Fig. 6). These data suggest that Lace1 is involved in brown adipogenic differentiation and related with mitochondrial respiratory chain complex Ⅳ subunits.
Figure 5. Loss of Lace1 induces reduction of brown adipogenic markers. HIB1B cells were transfected with control-siRNA (siControl) and LACE1-specific siRNA (LACE1 KD). (A) The effect of siRNA for LACE1 on Lace1 mRNA expression of brown adipogenesis. (B) Relative mRNA expression levels of brown adipocyte markers (Ucp1, Dio2, Prdm16, Cidea). (C) Relative mRNA expression levels of mitochondrial biogenesis markers (Cox7a1, Cox8b,
Tfam). Relative mRNA expression levels were measured by qRT-PCR and values were normalized to 36B4. The data are presented as the means SEM of three duplicate runs. *P<0.05,
**P<0.01**P<0.01 compared with siControl at same day.
Figure 6. Mitochondrial respiratory chain complex Ⅳ subunits decrease in LACE1 KD HIB1B cells. HIB1B cells were transfected with control-siRNA (siControl) and LACE1-specific siRNA (LACE1 KD). Relative mRNA expression levels of genes which are mtDNA encoded complex Ⅳ subunits (Cox1, Cox2, Cox3) and nuclear encoded complex Ⅳ subunits (Cox4, Cox5a, Cox6). Relative mRNA expression levels were measured by qRT-PCR and values were normalized to 36B4. The data are presented as the means SEM of three duplicate runs. *P<0.05, **P<0.01**P<0.01 compared with siControl at same day.
Lace1 KD leads to reduced p53 mRNA expression.
To test whether LACE1 knockdown affects p53 expression in adipocyte cell lines, we determined p53 mRNA level.
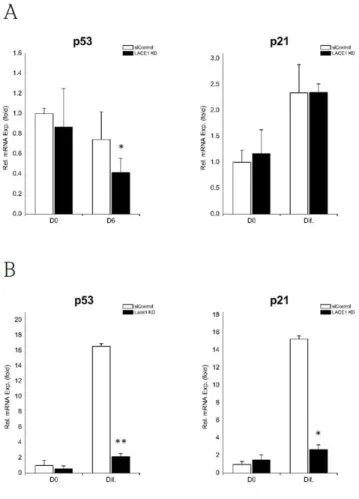
In 3T3-L1, we observed that LACE1 KD cells exhibited reduction in p53 only at day 6, not day 0 (Fig. 7A). But, p21, the target gene of p53, did not change throughout differentiation in LACE1 KD cells (Fig. 7A).
In HIB1B, LACE1 KD induced down-regulation of p53 level and reduction of its target gene, p21 expression following differentiation induction (Fig, 7B).
Figure 7. Ablation of Lace1 leads to reduced p53 expression in white and brown adipogenesis. Relative mRNA expression levels of p53 and p21 in (A)3T3-L1 at day 0, day 6 and (B) HIB1B at day 0, after differentiation. Relative mRNA expression levels were measured by qRT-PCR and values were normalized to 36B4. The data are presented as the means SEM of three duplicate runs.
*P<0.05, **P<0.01**P<0.01 compared with siControl at same day.
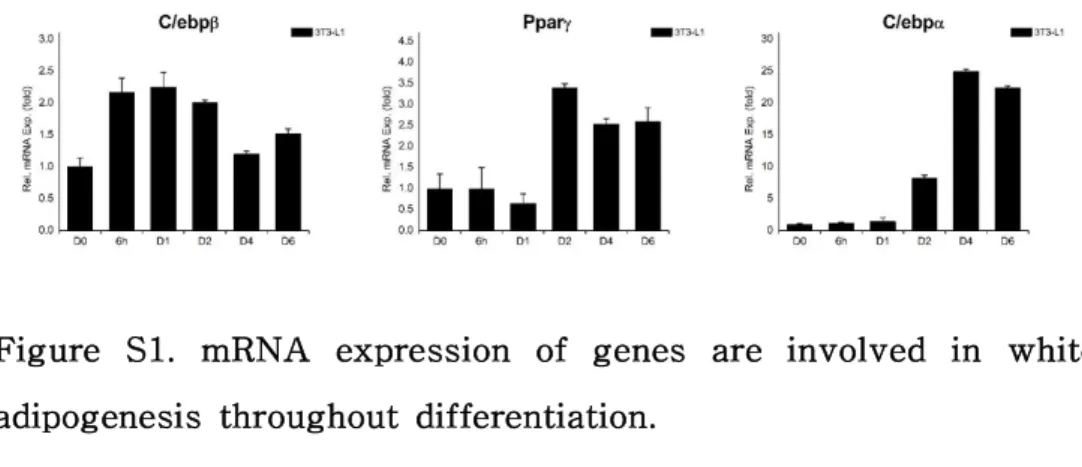
Figure S1. mRNA expression of genes are involved in white adipogenesis throughout differentiation.
3T3-L1 white pre-adipocytes were differentiated into white adipocytes as described under “Materials and Methods”. Relative mRNA expression patterns of genes which are main factors in white adipogenesis. Early adipogenic marker (C/ebpβ), Intermediate adipogenic marker (Pparγ, C/ebpα). Relative mRNA expression levels were measured by qRT-PCR and values were normalized to 36B4.
The data are presented as the means SEM of three duplicate runs.
4. Discussion
Obesity has raised a metabolic threat in the modern society. Many recent studies has investigated about development and treatment for obesity. Energy imbalance leads to be overweight and obesity.
Obesity is associated with the increased rate of severe diseases such as type 2 diabetes, cardiovascular disease, hypertriglyceridemia, and several types of cancer. Two type of adipose tissues, WAT and BAT, regulate energy balance in mammal. Thus, proper regulation of WAT, BAT has a therapeutic potential. [8, 15]
p53, the tumor suppressor, is important for the regulation of cell cycle progression and apoptosis. It has been also known to be associated with differentiation of other cell types including white and brown adipocytes. p53 affects negatively in white adipogenic differentiation, in contrast, it is required for brown adipogenic differentiation. [9, 16, 17, 26] The mammalian homologue of yeast mitochondrial Afg1 ATPase, LACE1, is located on inner mitochondrial membrane. LACE1 is involved in mitochondrial structure and mitochondrial protein homeostasis. [3] In L. Stiburek study, data demonstrate that LACE1 interacts with p53 and is engaged in its mitochondrial translocation and apoptosis. [4] It had not yet been studied for the role of LACE1 in white and brown adipocytes. We assume that LACE1 also physically interacts with p53 in adipocytes, and it potentiates to have effects on adipogenesis.
The present study is the first to test expression and effect of
LACE1 during white and brown adipogenic differentiation. We induced differentiation of 3T3-L1 white pre-adipocyte and HIB1B brown pre-adipocyte into mature white and brown adipocytes. LACE1 mRNA expression of both cell lines were increased throughout differentiation. Next, we transfected LACE1-specific siRNA to investigate the effect of LACE1 on adipogenesis. In white adipogenic differentiation, LACE1 KD cells revealed that the white adipocyte marker (aP2) was increased following induction differentiation.
Moreover, the intermediate adipogenic marker (C/ebpα) was significantly up-regulated at day 4 and Pparγ was increased at day 6.
However, the early adipogenic marker (C/ebpβ) was slightly down-regulated at day 6. Adipogenic markers were not affected by LACE1 KD at early stage. These data suggest that Lace1 has a function at intermediate/late stage on white adipogenesis. We also determined p53 expression and its target gene p21 expression.
Although p53 mRNA expression in LACE1 KD cells was decreased at day 6, p21 mRNA expression did not alter.
In brown adipogenic differentiation, loss of LACE1 induced down-regulation of brown adipocyte markers (Ucp1, Dio2, Prdm16, Cidea). Brown adipogenesis is included the mitochondrial biogenesis.
In accordance with the results of brown adipocytes markers, mitochondrial biogenesis markers (Cox7a1, Cox8b, Tfam) were decreased. Furthermore, expression of mtDNA encoded complex Ⅳ subunits (Cox1, Cox2, Cox3) down-regulated by LACE1 KD.
However, most of nuclear encoded complex Ⅳ subunits (Cox4, Cox5a,
Cox6) did not changed significantly. p53 level was also decreased in LACE1 KD brown adipocytes. Interestingly, p21 level was considerably declined unlike that of 3T3-L1 cells.
The limitation of the study is that we only measured expression levels of genes by qRT-PCR and identified the loss of function.
Further study is needed to investigate gain of function and the mechanism how LACE1 regulates white and brown adipogenesis and to corroborate whether the mechanism is related with p53. Moreover, there is a distinct type of cells from both white and brown adipocytes called ‘Beige adipocytes’ (also called brite adipocytes).
Beige adipocytes are developmented by transdifferentiating of white adipocytes (named ‘Browning’ of white adipocytes). [1, 5, 6, 25] Here, the data indicate that LACE1 is increased during white and brown adipogenesis, has a negative effect on white adipogenic differentiation and is involved in brown adipogenic differentiation. So, we will research whether LACE1 has relation to browning of white adipocytes in further study.
Reference
1. Bartelt A, and Heeren J. Adipose tissue browning and metabolic health. Nat Rev Endocrinol 2014, 10, 24-36.
2. Bowers RR, and Lane MD. A role for bone morphogenetic protein-4 in adipocyte development. Cell Cycle 2007, 6, 385-389.
3. Cesnekova J, Rodinova M, Hansikova H, Houstek J, Zeman J, and Stiburek L. The mammalian homologue of yeast Afg1 ATPase (lactation elevated 1) mediates degradation of nuclear-encoded complex IV subunits. Biochem J 2016, 473, 797-804.
4. Cesnekova J, Spacilova J, Hansikova H, Houstek J, Zeman J, and Stiburek L. LACE1 interacts with p53 and mediates its mitochondrial translocation and apoptosis.
Oncotarget 2016.
5. Cinti S. Transdifferentiation properties of adipocytes in the adipose organ. Am J Physiol Endocrinol Metab 2009, 297, E977-986.
6. Cohen P, and Spiegelman BM. Brown and Beige Fat:
Molecular Parts of a Thermogenic Machine. Diabetes 2015, 64, 2346-2351.
7. Cristancho AG, and Lazar MA. Forming functional fat: a growing understanding of adipocyte differentiation. Nat Rev Mol Cell Biol 2011, 12, 722-734.
8. Greenberg AS, and Obin MS. Obesity and the role of adipose tissue in inflammation and metabolism. The American Journal of Clinical Nutrition 2006, 83, 461S-465S.
9. Hallenborg P, Feddersen S, Madsen L, and Kristiansen K. The tumor suppressors pRB and p53 as regulators of adipocyte differentiation and function. Expert Opin Ther Targets 2009, 13, 235-246.
10. Hansen JB, and Kristiansen K. Regulatory circuits controlling white versus brown adipocyte differentiation.
Biochem J 2006, 398, 153-168.
11. Harms M, and Seale P. Brown and beige fat: development, function and therapeutic potential. Nat Med 2013, 19, 1252-1263.
12. Khalimonchuk O, Bird A, and Winge DR. Evidence for a pro-oxidant intermediate in the assembly of cytochrome oxidase. J Biol Chem 2007, 282, 17442-17449.
13. Kim SH, and Plutzky J. Brown Fat and Browning for the Treatment of Obesity and Related Metabolic Disorders.
Diabetes Metab J 2016, 40, 12-21.
14. Klaus S, Choy L, Champigny O, Cassard-Doulcier AM, Ross S, Spiegelman B, and Ricquier D. Characterization of the novel brown adipocyte cell line HIB 1B. Adrenergic pathways involved in regulation of uncoupling protein gene expression. J Cell Sci 1994, 107, 313-319.
15. Kusminski CM, Bickel PE, and Scherer PE. Targeting
adipose tissue in the treatment of obesity-associated diabetes.
Nat Rev Drug Discov 2016, 15, 639-660.
16. Molchadsky A, Ezra O, Amendola PG, Krantz D, Kogan-Sakin I, Buganim Y, Rivlin N, Goldfinger N, Folgiero V, Falcioni R, Sarig R, and Rotter V. p53 is required for brown adipogenic differentiation and has a protective role against diet-induced obesity. Cell Death Differ 2013, 20, 774-783.
17. Molchadsky A, Shats I, Goldfinger N, Pevsner-Fischer M, Olson M, Rinon A, Tzahor E, Lozano G, Zipori D, Sarig R, and Rotter V. p53 plays a role in mesenchymal differentiation programs, in a cell fate dependent manner.
PLoS One 2008, 3, e3707.
18. Nedergaard J, Golozoubova V, Matthias A, Asadi A, Jacobsson A, and Cannon B. UCP1: the only protein able to mediate adaptive non-shivering thermogenesis and metabolic inefficiency. Biochim Biophys Acta 2001, 1504, 82-106.
19. Park A, Kim WK, and Bae KH. Distinction of white, beige and brown adipocytes derived from mesenchymal stem cells.
World J Stem Cells 2014, 6, 33-42.
20. Peirce V, Carobbio S, and Vidal-Puig A. The different shades of fat. Nature 2014, 510, 76-83.
21. Rosen ED, and MacDougald OA. Adipocyte differentiation from the inside out. Nat Rev Mol Cell Biol 2006, 7, 885-896.
22. Rosen ED, and Spiegelman BM. Adipocytes as regulators
of energy balance and glucose homeostasis. Nature 2006, 444, 847-853.
23. Seale P, Bjork B, Yang W, Kajimura S, Chin S, Kuang S, Scime A, Devarakonda S, Conroe HM, Erdjument-Bromage H, Tempst P, Rudnicki MA, Beier DR, and Spiegelman BM. PRDM16 controls a brown fat/skeletal muscle switch. Nature 2008, 454, 961-967.
24. van Kruijsdijk RC, van der Wall E, and Visseren FL.
Obesity and cancer: the role of dysfunctional adipose tissue.
Cancer Epidemiol Biomarkers Prev 2009, 18, 2569-2578.
25. Wu J, Bostrom P, Sparks LM, Ye L, Choi JH, Giang AH, Khandekar M, Virtanen KA, Nuutila P, Schaart G, Huang K, Tu H, van Marken Lichtenbelt WD, Hoeks J, Enerback S, Schrauwen P, and Spiegelman BM. Beige adipocytes are a distinct type of thermogenic fat cell in mouse and human.
Cell 2012, 150, 366-376.
26. Yahagi N, Shimano H, Matsuzaka T, Najima Y, Sekiya M, Nakagawa Y, Ide T, Tomita S, Okazaki H, Tamura Y, Iizuka Y, Ohashi K, Gotoda T, Nagai R, Kimura S, Ishibashi S, Osuga J, and Yamada N. p53 Activation in adipocytes of obese mice. J Biol Chem 2003, 278, 25395-25400.
국문 초록
Lactation elevated 1 (LACE1)은 효모 Afg1의 포유동물 상동유전자이다.
LACE1은 HEK293 세포에서 미토콘드리아 단백질 항상성을 조절하고, p53과 같이 작용하며, 세포사멸을 유도하는 작용을 한다고 알려져 있다.
p53은 지방세포의 분화 과정에서 백색 지방 분화는 억제 작용을 하며, 갈색 지방 분화에는 필요한 것이라는 이전 연구 결과가 있다.
HEK293 세포를 제외한 다른 종류 세포들에서 LACE1의 기능에 대해 연구된 바가 없다. 따라서, 이 논문에서는 LACE1이 지방세포 분화에서 기능을 할 것이라고 가설을 세우고, 처음으로 지방세포가 분화되는 과정 에서 LACE1의 발현과 효과에 관한 실험을 진행하였다.
백색 지방 세포 분화 과정을 실험하기 위해 3T3-L1 세포주를 사용했고, 갈색 지방 세포 분화 과정을 실험하기 위해 HIB1B 세포주를 사용했다.
두 세포주는 각각의 분화 유도 과정을 통해 예정된 세포의 형태로 분화 한다.
3T3-L1과 HIB1B 두 세포주의 분화 과정에서 Lace1은 분화가 진행될수 록 증가하는 양상을 보인다. Lace1의 기능을 보기위해 발현 감소를 유도 하면, 백색 지방 세포에서는 대표유전자들이 증가하게 되고 갈색 지방 세포에서는 대표유전자들이 감소한다. 또한 갈색 지방 세포 발생은 미토 콘드리아의 발생 증가를 동반하게 되는데, 이 결과와 일치하게 Lace1의 감소는 미토콘드리아의 발생을 감소시킨다. HEK293 세포에서 LACE1과 단백질-단백질 상호작용을 하는 p53은 지방세포들에서 Lace1이 감소함 에 따라 함께 감소한다.
결론적으로 이 논문에서는 Lace1이 백색 지방 세포 분화 과정을 억제하
고, 갈색 지방 세포 분화에서는 분화 과정에 관여함으로써 기능을 갖는 다는 것을 보여준다.
주요 단어 : Lactation elevated 1, LACE1, White adipogenesis, Brown adipogenesis,
학번 : 2014-22949