- 23 -
KISEP Original Articles J Rhinol 4((((1)))), 1997
Nasal Patency Assessed by Acoustic Rhinometry after Endoscopic Sinus Surgery for Chronic Sinusitis
Chong Nahm Kim, M.D.
1, Soon Kwan Hong, M.D.
1, Ji Ae Lee, M.D.
1, Ok Kyung Jung, M.D.
1, Moon Hee Chang, M.D.
1, Moon Jung Kim, M.D.
1and Yang-gi Min, M.D.
2ABSTRACT
Nasal obstruction is one of the most frequent symptoms of chronic sinusitis. Since 1989, acoustic rhinometry has proven to be relatively accurate in evaluating the severity of nasal obstruction in a clinical setting. This study was conducted to evaluate the efficacy of acoustic rhinometry before and after endoscopic surgery in relieving nasal obstruction in patients with chronic sinusitis. Nasal airway patency was measured by acoustic rhinometry, preoperatively and postoperatively, in 48 patients with chronic sinusitis. Total volume (TV), distances and areas of the first and second notches, and areas at 3.3 cm (A
3.3), 4.0 cm (A
4.0) and 6.4 cm (A
6.4) from nose pieces were measured. The patients were divided into 4 groups according to the duration of their postoperative follow-up period. Group 1 had a postoperative follow-up period less than 1 year;group 2, between 1 and 2 years;
group 3, between 2 and 3 years;group 4, between 3 and 4 years. There was a significant increase in TV, A
4.0, and A
6.4posto- peratively (p<0.05, paired t-test). Postoperative values including TV, A
4.0, and A
6.4increased significantly in group 1, group 2, and group 3, but decreased in group 4 (p<0.05, ANOVA). However, there was no significant difference between groups in di- stances and areas of the first and second notches. These results suggest that endoscopic sinus surgery is effective in relieving nasal obstruction of patients with chronic sinusitis and that acoustic rhinometry may be a useful tool in objectifying symptomatic improvement in patients with nasal obstruction following endoscopic sinus surgery.
KEY WORDS:Acoustic rhinometry·Endoscopic sinus surgery.
INTRODUCTION
Nasal obstruction is one of the most frequent symptoms in chronic sinusitis. The first measurement of nasal obstruction was done by Donders in 1859 by measuring the pressure in the nasopharynx and was followed by Zwaardemaker in 1889 with the mirror method and then, by Glatzel in 1901 who used the plato method as well as other subjective methods. With the advance of technology in the 1960s, a method of measur- ing the difference in the pressure and speed of air between the pressure transducer and the pneumotachograph was int- roduced and acoustic rhinometry, computerized tomography and magnetic resonance imaging is now used for rhinometric tests.
Acoustic rhinometry was first put into practice by Hilberg et al
1)in 1989 and is known to be relatively accurate. Acoustic signals reflected off the nasal cavity measure the volume of the nasal cavity starting from the nostril and are used in resear- ching structural problems of the nasal cavity and physiological phenomena occuring therein.
This study was conducted to evaluate the efficacy of ac- oustic rhinometry, before and after endoscopic surgery, in re- lieving nasal obstruction in patients with chronic sinusitis.
SUBJECTS AND METHODS Subjects
The subjects consisted of 48 patients ranging in age from 7 to 72, with an average age of 33, all of who were suffering from chronic sinusitis and had undergone endoscopic sinus surgery at Ewha Women’s University Hospital between April 1992 and April 1996. Out of the 48 patients, there were 31 males and 17 females, all suffering from nasal obstruction, rhinorrhea, postnasal drip, hyposmia and amosmia and he- adaches. The time between surgery and this study constituted the postoperative follow-up period, which ranged from 6 mo-
1
Department of Otolaryngology, College of Medicine, Ewha Wo- men’s University, Seoul,
2Department of Otorhinolayngology, Seoul National University College of Medicine, Seoul, Korea Address correspondence and reprint requests to Chong Nahm Kim M.D., Department of Otolaryngology, Dongdaemun Hos- pital, Ewha Womans University, 70 Chongro 6-ka, Dongdaemun- ku, Seoul 110-126, Korea
Tel:82-2-760-5135, Fax:82-2-763-5719
Accepted for publication May 7, 1997
24 / J Rhinol 4(1), 1997
nths to 4 years. The patients were divided into 4 groups ac- cording to the duration of their postoperative follow-up per- iods. The postoperative follow-up period for group 1 was less than 1 year;for group 2, between 1 and 2 years;for group 3, between 2 and 3 years;for group 4, between 3 and 4 years.
Methods
The Model ARS-1003 Acoustic rhinometer made by Hood Laboratories was used. It includes a rhinometer processing unit, power cord, wave tube calibration tube and four separate nose pieces.
Acoustic rhinometry was conducted with the patient in a sitting position, where crust within the nasal cavity had been removed. A nose piece which was of the same size as the anterior nares was then inserted through the nostril and the measurements were taken with the patient holding their breath.
Total volume (TV), distances and areas of the first and second notches and areas at 3.3 cm (A
3.3), 4.0 cm (A
4.0) and 6.4 cm (A
6.4) from the nosepiece were measured. Areas at the midportion of the inferior turbinate were measured at 4.0 cm, making the total volume measured from the nosepiece to 7 cm distance.
Student t-test and ANOVA were used for statistical proofs and only p values below 0.05 were considered as statistical significance.
RESULTS
The areas of right and left nasal cavities at both the first and second notches had enlarged after surgery, however, the enlargement was statistically insignificant (Table 1). Similarly, the enlargement of areas at 3.3 cm in both naal cavities were statistically insignificant. Only A
4.0and A
6.4had enlarged to a statistically significant degree. Total volume increased signif- icantly in both nasal cavities postoperatively (p<0.05, paired t-test;Table 2).
A
4.0, A
6.4, and TV increased sequentially in group 1, 2, 3, however, they were significantly reduced in group 4 when
compared to group 3 (p<0.05, ANOVA;Table 3).
A survey was conducted among 40 patients who had und- ergone endoscopic sinus surgery. According to the condition of nasal obstruction, rhinorrhea, postnasal drip, hyposmia or anosma, and headache, they were divided into four classes:
cured;improved;unchanged;worsened. Changes were ob- served within each class and on the whole, significant impro- vement were found (Table 4).
DISCUSSION
One of the most common symptoms of patients visiting the otolaryngology department is nasal obstruction. This can
Table 1. Distances and areas of the first and second notch be- fore and after endoscopic sinus surgery
Parameters Before After
Rt 0.93±0.17 0.92±0.26 Distance (cm)
Lt 0.88±0.15 0.91±0.27 Rt 0.55±0.13 0.58±0.15 1st notch
Area (cm2)
Lt 0.55±0.14 0.56±0.23 Rt 2.40±0.57 2.97±0.67 Distance (cm)
Lt 2.48±0.54 2.49±0.57 Rt 0.64±0.13 0.66±0.20 2nd notch
Area (cm2)
Lt 0.68±0.12 0.68±0.25 Values are expressed as means±SD
Rt:Right, Lt:Left
Table 2. Comparison of cross-sectional areas and volumes of the nasal cavity before and after endoscopic sinus surgery
Parameters Preoperative Postoperative Rt 1.16 ±0.33 1.20 ±0.46
A3.3 (cm2)
Lt 1.18 ±0.25 1.18 ±0.56 Rt 1.34*±0.24 1.67*±0.31 A4.0 (cm2)
Lt 1.34*±0.33 1.68*±0.29 Rt 1.63*±0.63 2.19*±0.20 A6.4 (cm2)
Lt 1.56*±0.43 2.26*±0.31 Rt 9.38*±1.0 13.55*±4.16 TV (cm3)
Lt 10.15*±0.94 13.46*±4.15 Values are expressed as means±SD
A3.3:area at 3.3 cm, A4.0:area at 4.0 cm, A6.4:area at 6.4 cm, TV:total
volume within 7 cm distance from the nostril
*p<0.05 (paired, t-test)
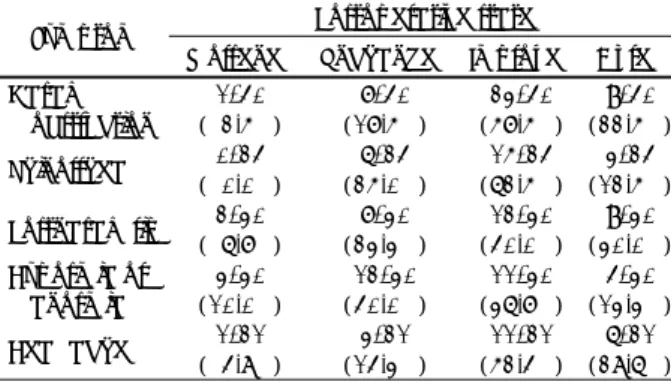
Table 3. Comparison of the cross-sectional area and volume of the nasal cavity between groups
Group 1 Group 2 Group 3 Group 4*
Rt 1.42±0.28 1.51±0.27 1.60±0.28 1.45±0.29 A4.0
(cm2) Lt 1.45±0.33 1.54±0.25 1.62±0.20 1.57±0.30 Rt 2.11±0.34 2.22±0.11 2.24±0.48 2.22±0.28 A6.4
(cm2) Lt 2.41±0.26 2.29±0.37 2.30±0.26 2.20±0.30 Rt 13.24±1.29 13.55±1.11 13.62±1.16 13.40±0.90 TV
(cm2) Lt 13.18±0.59 13.31±1.27 13.35±1.14 13.30±0.90 Values are expressed as means±SD p<0.05
Table 4. Improvement rate of the subjective symptoms before and after endoscopic sinus surgery:Queationnnaire analysis
Postoperative state Symptom
Worsened Unchanged Improved Cured Nasal
obstruction
1/40 ( 2.5%)
7/40 (17.5%)
23/40 (57.5%)
9/40 (22.5%) Rhinorrhea 0/24
( 0.0%)
6/24 (25.0%)
15/24 (62.5%)
3/24 (12.5%) Postnasal drip 2/30
( 6.7%)
7/30 (23.3%)
12/30 (40.0%)
9/30 (30.0%) Hyposmia or
anosmia
3/30 (10.0%)
12/30 (40.0%)
11/30 (36.7%)
4/30 (13.3%) Headache 1/21
( 4.8%)
3/21 (14.3%)
11/21 (52.4%)
6/21 (28.6%)
Kim et al.:Acoustic Rhinometry and Endoscopic Sinus Surgery / 25
be the result of anatomical variation and nasal mucosal sw- elling which both cause breathing difficulties. However, it is somewhat difficult to measure the severity of nasal obstruc- tion.
2)3)4)Measurement of patency in the nasal cavity was first done by Donders
5)6)in 1859 and was accomplished by blocking one nostril with a mercury pressure gauge while measurements from the nasopharynx were taken. In 1889, Zwaardermarker
1)used the mirror method and Glatzel
1)used the plate method in 1901. In 1906, Spiess
1)introduced a method of measuring the severity of nasal obstruction by measuring the nasal so- unds made while the mouth was closed. However, these ki- nds of subjective measurements were of limited use.
With the advance of technology such as pressure transd- ucer and the pneumotachograph in the 1960s, a method of measuring the pressure difference and velocity of the air allowed more objective and quantifiable measurements of nasal obstructions to be made. With these improve-ments in measuring methods, rhinomanometry was considered the most quantifiable and objective method of taking measurements.
However, using this method alone makes it difficult to obtain functional information on the nasopharynx, and co-operation from the patient is relatively hard to obtain, limiting its cli- nical effectiveness.
3)Recently, acoustic rhinometry, computerized tomography and magnetic resonance imaging have been combined in car- rying out rhinometric tests. While radiologic tests have limited effectiveness in obtaining dynamic changes, acoustic rhin- ometry is more useful in showing treatment effectiveness ob- jectively, since measurements are presented numerically.
3)8)Through acoustic rhinometry, normal distances and areas of the first and second notches can be observed. According to Lender et al,
3)the first notch belongs to the isthmus nasi and is referred to as the isthmus nasi notch while the second notch, situated 3.3 cm (3.0-4.0 cm) from the nostrils, corre- spondss to the anterior end of inferior turbinate and is referred to as the concha inferior notch.
6)9)10)Cross-sectional areas at 4.0 cm from the nostrils belong to the midportion of inferior turbinate and areas at 6.4 cm from the nostrils belong to the posterior part of nasal cavity.
The data obtained through acoustic rhinometry from patients is stored in a computer, making it possible to check patency before and after surgery, thus allowing convenient evaluative observation of the surgical outcome of the endoscopic sinus surgery.
6)11)Acoustic rhinometry carried out before and after endosc- opic sinus surgery has proven that there are differences in the distances and areas of the first and second notches, though the differences are not statistically significant;areas at 3.3 cm from the nostrils showed no significant changes, while areas at 4.0 cm, 6.4 cm from the nostrils and total volume showed significant increases. In groups 1, 2 and 3, there was
an increase in the aeras and total volume with an increase in the length of the follow-up period when compared to measu- rements taken before the operation, while in group 4, a dec- rease was observed when compared to group 3. These results suggest that there are improvements in nasal obstruction after endoscopic sinus surgery. There might be some reasons for the increase in area and total volume with the increase in the length of the follow-up period. One of these reasons is res- olution of the preoperative swelling of the inferior turbinate after sinus surgery. Another is the cavity created by by intr- anasal ethmoidectomy and widening of natural ostium of the maxillary sinus. The cause of the decrease in group 4 is pr- obably due to the regrowth of polyps, likely the result of a lack of surgical skill, since endoscopic sinus surgery had only recently been introduced at the time of operation.
CONCLUSION
The results from the 48 patients who had been suffering from chronic sinusitis and had undergone acoustic rhinometry before and after endoscopic sinus surgery suggest that endo- scopic sinus surgery is effective in relieving nasal obstruction and that acoustic rhinometry can be a useful tool to object- ively evaluate changes in nasal obstruction.
REFERENCES
1)
Hilberg O, Jackson AC, Swift DL, Pedersen OF. Acoustic rhino- metry: Evaluation of nasal cavity geometry by acoustic reflection.J App Physiol 1989;66:295-303.
2)
Kortekangas AE. Significance of anterior and posterior technique in rhinomanometry. Acta Otolaryngol 1972;73:218-21.3)
Lim HJ. Rhinomanometry. In: Seoul symposium, 3, 1989:109-22.4)
Yoon JH, Park IY, Lee JG, Jang YJ, Kim YH. Clinical study of nasal resistance-evaluation by rhinomanometry. Korean J Otola- ryngol 1998;31:596-601.5)
Min YG, Lee CH, Lee JW, Jang YJ, Choi YS, Jeong PS. acoustic rhinometry in normal korean adults. Korean J Otolaryngol 1994;37:51-6.
6)
Grymer LF, Hilberg O, Elbrond OF, et al. Acoustic rhinometry:Evaluation of nasal cavity with septal deviation, before and after septoplasty. Laryngoscope 1989;99:1180-7.
7)
Grymer LF, Hilberg O, Pedersen OF, et al. Acoustic rhinometry:Values from adults with subjective normal nasal patency. Rhino- logy 1991;29:35-9.
8)
Choi C, Kim HJ, Rho YS, Moon SA, Lim HJ. A study of the rh- inomanometry in normal persons. Korean J Otolaryngol 1989;32:832-40.