The recent advent of multidetector-row CT (MDCT) provides several benefits for clinical practice: thinner slices, a high speed of acquisition and nearly isotropic
voxels that allow the reformation of images in any planes without significant artifacts and with excellent anatomic detail (1, 2). Several recent investigations have reported that preoperatively performing MDCT in pa- tients with renal cell carcinoma (RCC) demonstrated a high diagnostic performance for the staging (3-6).
Of the several prognostic factors for RCC, the staging is considered as the most crucial one and the TNM stag- ing system is a widely used as a method of communicat- ing between medical professionals (7). The patient’s
Diagnostic Performance of Multidetector-Row CT for Predicting the Preoperative Staging of Renal Cell Carcinoma
1Chan Kyo Kim, M.D., Dongil Choi, M.D., Byung Kwan Park, M.D., Tae Wook Kang, M.D., Ji Hye Kim, M.D.
1Department of Radiology and the Center for Imaging Science, Samsung Medical Center, Sungkyunkwan University School of Medicine, Seoul, Korea
Received July 23, 2008 ; Accepted October 16, 2008
Address reprint requests to : Chan Kyo Kim, M.D., Department of Radiology, Samsung Medical Center, Sungkyunkwan University, School of Medicine, 50 Irwon-dong, Kangnam-gu, Seoul 135-710, Korea Tel. 82-2-3410-0516 Fax. 82-2-3410-2559
E-mail: [email protected]
Purpose: We assessed the diagnostic performance of multidetector-row computed tomography (MDCT) for preoperatively predicting the T-staging of renal cell carcino- ma (RCC).
Materials and Methods: All the MDCT studies were performed using a 16- or 40-slice MDCT scanner and the three-phase CT images, including unenhanced, corti- comedullary and delayed nephrographic phase images. For the differentiation be- tween ≤ T2 disease and ≥ T3 disease, a four-point scale was used and a score of more than three was considered indicative of ≥ T3 disease. The imaging findings were com- pared with the surgical specimens with using the 2002 TNM staging system. Statistical analysis was performed using McNemar’s test, κstatistics and receiver operating char- acteristic (ROC) analysis.
Results: The 144 RCCs consisted of 72 T1a, 31 T1b, 16 T2, 13 T3a and 12 T3b. For all the T-staging, the accuracies of MDCT were excellent (≥ 87%) for both readers. For predicting ≥ T3 disease on MDCT, the area under the receiver operating characteris- tics curve (Az) for both readers was 0.898 and 0.896, respectively. The interreader agreement was almost perfect (κ= 0.853).
Conclusion: MDCT was accurate for preoperatively predicting the T-staging of RCCs, with almost perfect interreader agreement.
Index words :Carcinoma, renal cell Neoplasm stage
Tomography, X-ray computed Image processing
ROC curve
overall disease stage is determined by the grouping of the American Joint Committee on Cancer Staging (8).
The cancer-specific survival of patients treated with par- tial or radical nephrectomy is highly correlated with the tumor stage (9). Thus, the preoperative accurate staging of RCC is important for planning appropriate treatment strategies and determining the prognosis.
The most recent revision (2002) of the TNM staging system for RCC has been widely used in clinical prac- tice (8). However, to the best of our knowledge, no in- vestigation concerned with the diagnostic performance of MDCT has been reported for evaluating the revised TNM staging system. Therefore, the purpose of this study was to prospectively assess the diagnostic perfor- mance of MDCT for predicting the T-staging of RCC, as assesed by two radiologists.
Materials and Methods
Patients
Our institutional review board approved this prospec- tive study, and written informed consents were ob- tained from all the patients.
From January 2005 to September 2006, a total of 292 patients with suspected RCC underwent radical or par- tial nephrectomy at our institution. Of them, 137 pa- tients were excluded from this study for the following reasons: their CT was done outside our institution with unknown protocols (n = 112), single phase CT was done in our institution (n = 17) or the liver or pancreas CT protocol was used in our institution (n = 8). The remain- ing 155 patients with suspected RCC and who under- went kidney CT in our institution underwent radical or partial nephrectomy: there were 145 patients with 145 RCCs and 4 patients with angiomyolipoma, 2 patients with urothelial adenocarcinoma, 1 patient with leiomy- oma, 1 patient with synovial sarcoma, 1 patient with leiomyosarcoma and 1 patient with oncocytoma. Of the 145 patients with 145 RCCs, one patient had T4 stage disease and this patient was excluded from the analysis of this study due to low number of T4 cases. Therefore, a total of 144 patients with RCCs (101 men and 43 women; age range: 24-83 years; mean age: 55.8 years) who underwent kidney CT scanning at our institution were included in the study group. Five patients had a history of prior surgery: advanced stomach cancer (n = 3), rectal cancer (n = 1) and urinary bladder cancer (n = 1). One patient had a history of Von-Hippel-Lindau dis- ease.
MDCT Technique
Helical CT was performed using a MDCT scanner (Lightspeed 16, GE Medical Systems, Milwaukee, Wis;
Brilliance 40, Philips Medical Systems, Cleveland, OH) with 16 or 40 detectors. For all 144 patients with RCCs, a three-phase CT scan was obtained with a single- breath-hold: this included the unenhanced, corti- comedullary and delayed nephrographic phases. The unenhanced and corticomedullary phases were ac- quired from the hepatic dome to the lower pole of the kidney, and the delayed nephrographic phase was ob- tained from the diaphragm to the pelvis. About 30 min- utes before the CT scanning, all the patients were in- structed to drink 700-1000 mL of water. The scanning parameters were 120 kVp, 180 mAs, 16×0.625 collima- tion and 17.5 mm/sec (a pitch of 0.875) with using 16 de- tectors, and 120 kVp, 200 effective mAs, 40×0.625 col- limation and 23.15 mm/sec (a pitch of 0.926) with using 40 detectors. The images were obtained in the cranio- caudal direction and they were reconstructed every 2.5 mm for the corticomedullary phase, every 2.5-3 mm for the delayed nephrographic phase and every 5 mm for the unenhanced phase to provide contiguous sections.
For all the patients, multiplanar reformatted images were obtained from all the data sets of corticomedullary and delayed nephrographic phases, and these consisted of coronal and sagittal images with a 2.5-3 mm slice thickness.
All the patients received an injection of a standard dose of 120 mL of iomeprol 300 (Iomeron 300; Bracco, Milan, Italy) through an 18-gauge peripheral venous ac- cess (generally an antecubital vein) at a flow rate of 3 mL/sec; the start delay was 30 sec for the corti- comedullary phase and 180 sec for the delayed nephro- graphic phase. The bolus injection technique was used to administer contrast material with an automated injec- tor (EnVision CT; Medrad, Indianola, PA) and this pro- cedure was carefully monitored by a physician or nurse.
Imaging Analysis
All the reconstructed and reformatted images were transferred to a picture archiving and communication system (PACS, Centricity 2.0, General Electric Medical Systems, Milwaukee, Wis). All the transferred images were independently analyzed by two radiologists on a 2048×1536 PACS monitor (Totoku Electric, Japan).
Imaging analysis was performed as follows. Two radi- ologists (D. Choi and C.K. Kim with 8 and 4 years of ex- perience in CT body imaging, respectively), and who
were “blinded” to the patients’ clinical information, evaluated the CT imaging for determining the T-staging of the RCC and the images were scored for the presence or absence of ≥ T3 disease. The two readers subjective- ly expressed their professional opinion of finding ≥ T3 disease on a four-point confidence level scale (1, defi- nitely absent; 2, probably absent; 3, probably present; 4, definitely present). A score more than three was consid- ered indicative of ≥ T3 disease. For the evaluation of the RCC tumor extent (the T-staging), the most recently revised TNM staging system (2002) was used (Table 1).
The diagnostic criteria for MDCT T-staging were as follows: T1a for tumor ≤ 4 cm in the greatest dimen- sion, T1b for tumor > 4 cm in the greatest dimension but ≤ 7 cm in the greatest dimension, and T2 for tumor
> 7 cm in the greatest dimension. Perirenal fat invasion of T3a was tumor that showed irregular nodular strand- ing (Fig. 1) or a soft-tissue nodule in the perirenal space.
Sinus fat invasion of T3a was a tumor demonstrating a protrusion with an indistinct margin or irregular spicula-
tions into the sinus fat. Adrenal gland invasion of T3a was nonvisualization of the adrenal gland or loss of the soft-tissue between the primary tumor and the adrenal gland. Renal vein thrombosis of T3b was a filling defect within a distended vein or direct continuity of a throm- bus with the primary tumor, and T4 was obliteration of the normal soft-tissue planes between the tumor and the adjacent organs. Fine perinephric stranding or minimal Gerota’s fascia thickening on the CT imaging was not considered as perirenal fat invasion of T3a.
Statistical Analysis
For predicting the T-staging in patients with RCC, the sensitivity, specificity, positive predictive value (PPV), negative predictive value (NPV) and accuracy of CT be- tween the two readers were calculated with using the histopathologic results as a standard of reference. The sensitivity, specificity and accuracy of CT for both read- ers were compared using the McNemar test.
The inter-reader agreement for both readers for pre- dicting the T-staging for patients with RCC was calculat- ed with using non-weighted κstatistics. The following qualitative terms were used to describe the strength of various κvalues: 0 - 0.20, poor agreement; 0.21 - 0.40, fair agreement; 0.41- 0.60, moderate agreement; 0.61 - 0.80, substantial agreement; and 0.81- 1.00, almost per- fect agreement (10).
The area under the receiver operating characteristic curve (ROC) (Az) for both readers was calculated by us- ing the scores of predicting ≥ T3 disease in patients with RCC. Statistical analysis was performed with Rockit 0.9B (Department of Radiology, University of Chicago, Chicago, III) and SPSS for Windows (version 10.0; SPSS, Chicago, IL). Two-tailed tests were used to calculate all the p values. P values < 0.05 were consid- ered to be significant.
Fig. 1. Renal cell carcinoma in the right kidney. Irregularly nodular strandings (arrows) are noted, and they represent the perirenal fat invasion of tumor.
Table 1. T-staging of Renal Cell Carcinoma (According to the 2002 TNM Staging System)
Classification Description
T1 Tumor < 7 cm, limited to kidney
T1a Tumor ≤ 4 cm
T1b Tumor > 4 and ≤ 7 cm
T2 Tumor > 7 cm, limited to kidney
T3 Tumor extends into major veins or it invades the adrenal or perinephric tissues, but not beyond Gerota’s fascia T3a Perinephric or sinus fat or adrenal extension
T3b Tumor extends to the renal vein or its segmental (muscle-containing) branches, or vena-cava involvement below the diaphragm
T3c Vena-cava involvement above the diaphragm or it invades the wall of the vena-cava T4 Tumor extends outside Gerota’s fascia
Results
A total of 144 RCCs were identified in the surgical
specimens: 72 T1a RCCs, 31 T1b RCCs, 16 T2 RCCs, 13 T3a RCCS and 12 T3b RCCs. For the histopathologic findings, the tumor size ranged from 0.8 to 14 cm (mean size: 4.8 ± 3.3 cm). The subtypes consisted of 125 of the
A B
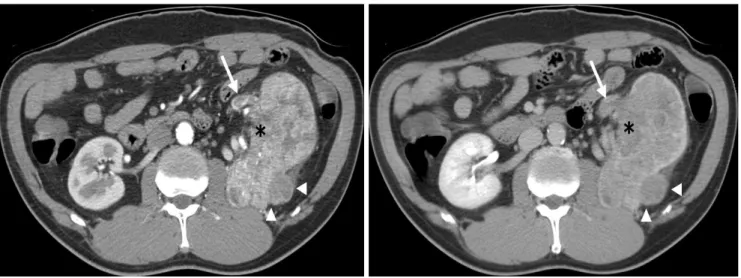
Fig. 2. Renal cell carcinoma with tumor extension into the left renal vein, the perirenal fat and the renal sinus fat (TNM stage T3b).
(A, B) The axial contrast-enhanced CT scan obtained during the corticomedullary (A) and delayed nephrographic (B) phases show a heterogeneously enhancing mass in the left kidney, with tumor thrombus in the left renal vein (arrow), perirenal fat invasion (ar- rowheads) and sinus fat invasion (asterisk).
Table 2. The CT T-staging Results for Both Readers
Stage CT results (reader 1/2)
T1a T1b T2 T3a T3b T3c T4
pT1a (n = 72) 69/67 1/2 2/3
pT1b (n = 31) 28/25 0/1 3/5
pT2 (n = 16) 12/13 4/2 0/1
pT3a (n = 13) 1/2 1/1 2/2 8/6 0/1 1/1
pT3b (n = 12) 1/2 2/2 9/8
pT3c (n = 0)
Total (n = 144) 70/69 30/28 15/18 19/18 9/10 1/1
Note: The p value refers to the pathologic results. The bold numbers are the counts of the correctly staged tumors by both readers.
Table 3. MDCT Diagnostic Performance of the Two Readers for Predicting the T-staging of 144 Renal Cell Carcinomas
Stage Reader 1
T1a T1b T2 T3a T3b
Sensitivity (%) 96 (69/72) 90 (28/31) 75 (12/16) 62 (8/13) 075 (9/12)
Specificity (%) 99 (71/72) 98 (111/113) 98 (125/128) 92 (120/131) 100 (132/132)
PPV (%) 99 (69/70) 93 (28/30) 80 (12/15) 42 (8/19) 100 (9/9)
NPV (%) 96 (71/74) 97 (111/114) 97 (125/129) 96 (120/125) 098 (132/135)
Accuracy (%) 97 (140/144) 97 (139/144) 95 (137/144) 89 (128/144) 098 (141/144)
Reader 2
Sensitivity (%) 93 (67/72) 80 (25/31) 81 (13/16) 46 (6/13) 067 (8/12)
Specificity (%) 97 (70/72) 97 (110/113) 96 (123/128) 91 (119/131) 098 (130/132)
PPV (%) 97 (67/69) 89 (25/28) 72 (13/18) 33 (6/18) 080 (8/10)
NPV (%) 93 (70/75) 95 (110/116) 98 (123/126) 94 (119/126) 097 (130/134)
Accuracy (%) 95 (137/144) 94 (135/144) 94 (136/144) 87 (125/144) 096 (138/144)
Note: The numbers in parentheses are the raw data. PPV = positive predictive value, NPV = negative predictive value.
clear cell type, 10 of the chromophobe type, eight of the papillary type and one of the collecting duct type. The Furhman nuclear grade was as follows: grade I (n = 3), grade II (n = 78), grade III (n = 53) and grade IV (n = 10). The maximal size of tumors measured on the CT images ranged from 0.9 to 15.0 cm (mean size: 5.2 ± 3.5 cm).
Table 2 presents the 2 readers’ T-staging results of MDCT as correlated with the histopathologic results, ac- cording to the latest TNM (2002) staging system.
Table 3 presents the MDCT diagnostic performance of the two readers for predicting the T-staging in the 144 RCCs. The accuracy of predicting T1a, T1b and T2 was excellent (≥ 95%) for both readers, and there was no significant differences between the two readers (p >
0.05). For predicting T3a and T3b, the sensitivities of reader 1 were superior to those of reader 2 (p > 0.05), but the accuracy by both readers was similar (89% and 87%, respectively, for T3a; 98% and 96%, respectively, for T3b) (Fig. 2).
For the prediction of T3a (n = 13), the two readers cor- rectly diagnosed 50% (3/6) versus 50% (3/6) for perirenal fat invasion, 57% (4/7) versus 43% (3/7) for sinus fat in- filtration and 100% (1/1) versus 100% (1/1) for adrenal
involvement, respectively. Of the 13 patients with histopathologically proven T3a disease, one patient had both perirenal fat invasion and sinus fat infiltration.
For predicting the T-staging of RCC, the analysis of in- terreader variability showed almost perfect agreement (κ= 0.853).
A B
C
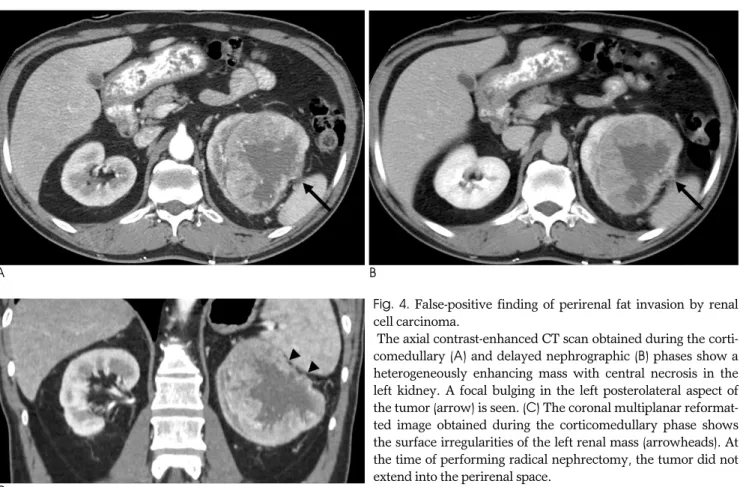
Fig. 4. False-positive finding of perirenal fat invasion by renal cell carcinoma.
The axial contrast-enhanced CT scan obtained during the corti- comedullary (A) and delayed nephrographic (B) phases show a heterogeneously enhancing mass with central necrosis in the left kidney. A focal bulging in the left posterolateral aspect of the tumor (arrow) is seen. (C) The coronal multiplanar reformat- ted image obtained during the corticomedullary phase shows the surface irregularities of the left renal mass (arrowheads). At the time of performing radical nephrectomy, the tumor did not extend into the perirenal space.
Fig. 3. The receiver operating characteristic curves show the MDCT results for predicting ≥ T3 renal cell carcinomas by the two readers. No statistical difference was found for the two readers (p > 0.05).
For differentiating of tumor ≤ T2 and tumor ≥ T3, the area under the receiver operating characteristics curve (Az) of the two readers was similar (0.898 for read- er 1 versus 0.896 for reader 2, p > 0.05) (Fig. 3).
For the false-positive findings (Fig. 4, 5), reader 1 had 18 cases: one histologically confirmed T1a (from one pT3a), two histologically confirmed T1b (from one pT1a and one pT3a), three histologically confirmed T2 (from two pT3a and one pT3b), 11 histologically confirmed T3a (from two pT1a, three pT1b, four pT2 and two pT3b) and one histologically confirmed T4 (from one pT3a). Reader 2 had 25 false-positive cases: two histolog- ically confirmed T1a (from two pT3a), three histological- ly confirmed T1b (from two pT1a and one pT3a), five histologically confirmed T2 (from one pT1b, two pT3a and two pT3b), 12 histologically confirmed T3a (from three pT1a, five T1b, two histologically confirmed pT2 and two pT3b), two histologically confirmed T3b (from one pT2 and one pT3a) and one histologically confirmed T4 (from one pT3a).
Discussion
Accurate staging at the time of diagnosis is crucial for determining the patient’s prognosis and the treatment planning. The overall accuracy of the RCC staging has been reported to be 91% on CT, with the false-positive findings of most of the staging related to the diagnosis of perirenal tumor extension (11). Until now, there has been no reliable indicator for diagnosing perirenal fat in- vasion of RCC on CT (12). The perirenal fat invasion of RCC may have a crucial impact on the treatment plan- ning. In fact, an infiltration of perirenal fat tissue may modify the surgical approach from conservative to radi- cal nephrectomy. MDCT has recently been introduced and this has improved the diagnostic accuracy of CT in several anatomic areas because of the use of thin collim- ination and the ability of this modality to reveal data with multiplanar reformation, as well as to reveal data in the axial plane (3-6). Thus, these benefits of MDCT may improve the staging accuracy of RCC with less variability of interreader interpretation. Catalano et al.
A B
C
Fig. 5. False-positive finding of renal sinus fat invasion by renal cell carcinoma. (A, B) The axial contrast-enhanced CT scan ob- tained during the corticomedullary (A) and delayed nephro- graphic (B) phases show a heterogeneously enhancing mass in the left kidney. Focal bulging of the tumor into the renal sinus is associated with an indistinct margin (arrow), which raises the possibility of sinus fat invasion of the tumor. The coronal multi- planar reformatted image (C) obtained during the corti- comedullary phase shows focal bulging of the tumor into the re- nal sinus, with an indistinct margin of the tumor (arrowheads).
At the time of performing radical nephrectomy, the tumor did not extend into the renal sinus.
(3) reported the usefulness of MDCT for investigating RCC that is less than 5 cm at the greatest dimension, and the sensitivity, specificity and accuracy were 96%, 93% and 95%, respectively, on 1 mm scans for evaluat- ing perirenal fat invasion. However, a recent study that used MDCT with 2 mm scans demonstrated that the overall staging accuracy was 80-83% (4). In our study, for the assessment of perirenal fat or sinus fat or adrenal invasion (T3a), the overall accuracy was 89% for reader 1 and 87% for reader 2, respectively. The sensitivity for both readers was 62% and 46%, while the specificity for both readers was 92% and 91%, respectively. On the ROC analysis for predicting ≥ T3, both readers showed Az values of more than 0.896.
In terms of the sinus fat invasion of RCC, no investiga- tion using CT has yet been reported because the sinus fat invasion of RCC was newly included in the revised 2002 TNM staging system. It has been shown that tu- mor invasion into the renal sinus fat has a worse progno- sis than perirenal fat invasion because the renal sinus has a large number of veins and lymphatic vessels and this might be associated with a higher proportion of dis- seminated tumor cells compared with tumor extension into the perirenal fat (13). Our results using MDCT showed 57% (4/7) for reader 1 and 43% (3/7) for reader 2 for predicting sinus fat invasion. These results were sim- ilar to those for detecting perirenal fat invasion of RCC in our study. As a possible reason, we might suggest the poor soft-tissue resolution of CT between the tumor and the adjacent renal sinus fat, although the CT technology has been improved.
As for detecting the involvement of the ipsilateral adrenal gland by RCC, visualization of the normal adrenal gland on CT showed a 100% NPV for tumor spread to the gland, whereas adrenal enlargement, dis- placement or nonvisualization was associated with tu- mor involvement of the adrenal gland in 24% of the cas- es (14). Our MDCT results showed 100% accuracy for both readers, even if there was only one case of adrenal gland involvement according to the histopathologic re- sults.
For the evaluation of venous involvement by RCC, a previous study reported that CT had 78% sensitivity, 96% specificity and 91% accuracy (15). Welch and LeRoy demonstrated that the diagnostic performance of spiral and electron-beam CT was 85% sensitivity, 98%
specificity and 96% accuracy for preoperatively evaluat- ing the existence of venous thrombus (16). A recent study reported that MDCT had 93% sensitivity and 80%
specificity for delineating the upper extent of the throm- bus (6). In our study, for the evaluation of T3b, the accu- racy of MDCT was more than 96% for both readers.
Detecting direct extension of RCC beyond Gerota’s fascia into the adjacent organs may be challenging un- less a definite focal change in attenuation within an or- gan is demonstrated. On CT, the loss of tissue planes and irregular margins between the tumor and the sur- rounding structures may raise the possibility of direct invasion of RCC (15, 17). In particular, the sagittal or coronal reformatted images may be helpful for the pre- diction of T4 stage disease. In our study, there was only one T4 stage case, which was excluded from the analy- sis.
The 2002 TNM T1 category was amended to T1a and T1b to reflect the amenability of tumors less than 4 cm to be suitable for treatment by partial nephrectomy. The 5-year cancer-specific survival rates based on the 2002 TNM staging system are excellent (97% for T1a and 87% for T1b) (9). For differentiating T1a from T1b in our study, reader 1 and reader 2 had one and two false-posi- tive findings of T1a (from T1a to T1b), respectively. The possible reasons for the false-positive findings of both readers might have been a measurement error at CT or the shrinkage of the surgical specimen after fixing it in formaldehyde.
The limitation of our study was the relatively small number of T3 cases. For obtaining higher statistical power, enrolling more subjects would further strength- en the results. Additionally, we did not separately ana- lyze the axial images and the multiplanar reformatted images. This might have had an effect on the results of this study.
In conclusion, MDCT was accurate for preoperatively predicting the T-staging of RCCs, with almost perfect in- terreader agreement.
References
1. Hu H, He HD, Foley WD, Fox SH. Four multidetector-row helical CT: image quality and volume coverage speed. Radiology 2000;215:55-62
2. Blum A, Walter F, Ludig T, Zhu X, Roland J. Multislice CT: princi- ples and new CT-scan applications. J Radiol 2000;81:1597-1614 3. Catalano C, Fraioli F, Laghi A, Napoli A, Pediconi F, Danti M, et
al. High-resolution multidetector CT in the preoperative evalua- tion of patients with renal cell carcinoma. AJR Am J Roentgenol 2003;180:1271-1277
4. Hallscheidt PJ, Bock M, Riedasch G, Zuna I, Schoenberg SO, Autschbach F, et al. Diagnostic accuracy of staging renal cell carci- nomas using multidetector-row computed tomography and mag- netic resonance imaging: a prospective study with histopathologic
correlation. J Comput Assist Tomogr 2004;28:333-339
5. Hallscheidt PJ, Fink C, Haferkamp A, Bock M, Luburic A, Zuna I, et al. Preoperative staging of renal cell carcinoma with inferior ve- na cava thrombus using multidetector CT and MRI: prospective study with histopathological correlation. J Comput Assist Tomogr 2005;29:64-68
6. Stern Padovan R, Perkov D, Smiljanic R, Oberman B, Potocki K.
Venous spread of renal cell carcinoma: MDCT. Abdom Imaging 2007;32:530-537
7. Shuch BM, Lam JS, Belldegrun AS, Figlin RA. Prognostic factors in renal cell carcinoma. Semin Oncol 2006;33:563-575
8. American Joint Committee on Cancer. AJCC Cancer Staging Manual. 6th ed. New York: Springer, 2002:323-325
9. Frank I, Blute ML, Leibovich BC, Cheville JC, Lohse CM, Zincke H. Independent validation of the 2002 American Joint Committee on cancer primary tumor classification for renal cell carcinoma us- ing a large, single institution cohort. J Urol 2005;173:1889-1892 10. Landis JR, Koch GG. The measurement of observer agreement for
categorical data. Biometrics 1977;33:159-174
11. Kopka L, Fischer U, Zoeller G, Schmidt C, Ringert RH, Grabbe E.
Dual-phase helical CT of the kidney: value of the corticomedullary and nephrographic phase for evaluation of renal lesions and preop-
erative staging of renal cell carcinoma. AJR Am J Roentgenol 1997;169:1573-1578
12. Mueller-Lisse UG, Mueller-Lisse UL, Meindl T, Coppenrath E, Degenhart C, Graser A, et al. Staging of renal cell carcinoma. Eur Radiol 2007;17:2268-2277
13. Thompson RH, Leibovich BC, Cheville JC, Webster WS, Lohse CM, Kwon ED, et al. Is renal sinus fat invasion the same as per- inephric fat invasion for pT3a renal cell carcinoma? J Urol 2005;174:1218-1221
14. Gill IS, McClennan BL, Kerbl K, Carbone JM, Wick M, Clayman RV. Adrenal involvement from renal cell carcinoma: predictive value of computerized tomography. J Urol 1994;152:1082-1085 15. Johnson CD, Dunnick NR, Cohan RH, Illescas FF. Renal adeno-
carcinoma: CT staging of 100 tumors. AJR Am J Roentgenol 1987;148:59-63
16. Welch TJ, LeRoy AJ. Helical and electron beam CT scanning in the evaluation of renal vein involvement in patients with renal cell carcinoma. J Comput Assist Tomogr 1997;21:467-471
17. Sheth S, Scatarige JC, Horton KM, Corl FM, Fishman EK. Current concepts in the diagnosis and management of renal cell carcinoma:
role of multidetector ct and three-dimensional CT. Radiographics 2001;21 Spec No:S237-S254
대한영상의학회지 2009;60:109-116
다검출기 전산화단층촬영법을 이용한 수술 전 신장암 병기 결정의 진단적 수행능력1
1성균관대학교 의과대학 삼성서울병원 영상의학과 김찬교∙최동일∙박병관∙강태욱∙김지혜
목적: 다검출기 전산화단층촬영을 이용한 신장암의 수술 전 병기 결정의 진단적 수행 능력에 대해 알아보고자 하였 다.
대상과 방법: 모든 연구는 16 또는 40 절편의 다검출기 전산화단층촬영 스캐너를 사용하였으며 삼중시기 (조영 전, 피질수질, 그리고 지연 신장시기) 영상을 이용하였다. T2와 T3 병기의 구별을 위하여 4점 척도를 이용하였고, 점수 가 3점 이상일 경우 T3 이상의 단계로 정하였다. 2002년 TNM 병기 결정법을 이용하여 각각의 영상 소견들을 수술 검체와 비교하였다. 통계적인 분석으로는 McNemar 테스트, κ-통계 그리고 ROC 분석법을 이용하였다.
결과: 모두 144예의 신장암은 72개의 T1a, 31개의 T1b, 16개의 T2, 13개의 T3a, 그리고 12개의 T3b 병기로 구 성되었다. 모든 T-병기 결정에 관하여 다검출기 전산화단층촬영의 정확도(≥ 87%)는 두 판독자 모두 우수하였다.
T3 병기 결정에 관해서 두 판독자의 ROC 곡선 아래 면적은 각각 0.898과 0.896이었다. 두 판독자간의 일치도도 매우 우수하였다(κ= 0.853).
결론: 다검출기 전산화단층촬영을 이용한 수술 전 신장암의 T-병기 결정은 정확하며, 판독자간의 일치도도 매우 우 수하였다.