Current MR Imaging of Renal Cell Carcinoma 신세포암의 최신 자기공명영상
Saelin Oh, MD, Deuk Jae Sung, MD*
Department of Radiology, Anam Hospital, Korea University College of Medicine, Seoul, Korea
서론
신세포암(renal cell carcinoma)은 모든 신장 악성 종양의 약 90%를 차지하며, 미국 내에서 모든 성인 악성 종양의 4% 정 도에 이르고 있다(1). 이 종양의 치사율은 약 25% 정도로 비뇨 기 종양 중 가장 높은 편이다. 진단할 당시에 환자의 약 30%에 서 전이가 동반되어 있다(2). 임상에서 전산화단층촬영(com- puted tomography; 이하 CT)이 영상 진단에 많이 사용되면서 신세포암이 우연히 발견되고, 크기가 작은 신세포암이 급격히 증가하였다. 조기 진단과 치료에 따라 신세포암의 장기 생존율 이 개선되고 있다. 신세포암에서 영상 진단의 역할은 크게 진단, 치료, 그리고 추적 관찰로 구분할 수 있다. 최근 신세포암에 대한 표적 치료의 반응 평가에 영상 진단이 중요하게 이용되고 있다.
전통적으로 신세포암의 진단에는 CT가 가장 널리 사용되고 있다. 미국영상의학협회(American College of Radiology)는 자 기공명영상(magnetic resonance imaging; 이하 MRI)을 불명확 한 신장 종괴의 진단에 있어서 CT에 필적하는 방법으로 인정하
고 있다(3). 특히 MRI는 CT에 비해 이온화 방사선(ionized ra- diation)이 없고, 대조도 분해능(contrast resolution)이 높으며, 기능적 영상 기법이 가능한 장점들이 있다. 또한 최근 들어 초음 파검사나 CT에서 악성과 양성의 구분이 어려운 2 cm 미만 크기 의 작은 신장 종괴의 정확한 진단을 MRI가 가능하게 한다(4).
신장 종양의 진단에 있어 이전에 사용되어 왔던 고식적인 MRI 의 프로토콜(protocol)은 T2 강조 영상, 화학전이영상(che- mical-shift imaging)을 포함한 T1 강조 영상, 조영제 투여 전과 투여 후의 지방 억제(fat suppression) T1 강조 영상이었다. 이 프로토콜에 역동적 조영 증강(dynamic contrast enhancement) T1 강조 영상과 확산 강조 영상(diffusion weighted imaging)이 포함된 다중매개변수(multiparametric) MRI (이하 mp-MRI)가 최근 들어 신장 종양의 감별 진단과 표적 치료의 임상 반응을 평 가하는 데 사용되면서, 점차 표준화된 프로토콜로 자리 잡고 있다.
본 연구에서는 mp-MRI를 포함한 최신 MRI 기법을 이용한 신세포암의 진단 및 치료 반응의 평가와 그 외 다양한 임상 적 용에 대하여 알아보고자 한다.
Renal cell carcinoma (RCC) consists of approximately 85–90% of renal masses, and its incidence is increasing due to widespread use of modern imaging modalities such as ultrasonography or computed tomography. Computed tomography has served an important role in the diagnosis and staging of RCC; however, recent advances in magnetic resonance imaging (MRI) techniques have considerably improved our abil- ity to predict tumor biology beyond the morphologic assessment. Multiparametric MRI protocols include standard sequences tailored for the morphologic evaluation and acquisitions that provide information about the tumor microenvironment such as diffusion-weighted imaging and dynamic contrast-enhanced MRI. The role of multiparametric MRI in the evaluation of RCC now extends to preoperative charac- terization of RCC subtypes, histologic grade, and quantitative assessment of tumor response to targeted therapies in patients with metastatic disease. Herein, the clinical applications and recent advances in MRI applied to RCC are reviewed along with its merits and demerits. We aimed to review MRI techniques and image analysis that can improve the management of patients with RCC. Familiarity with the advanced MRI techniques and various imaging findings of RCC would also facilitate optimal clinical recommendations for patients.
Index terms Renal Cell Carcinoma Magnetic Resonance Imaging
Received January 19, 2016 Revised March 15, 2016 Accepted March 30, 2016
*Corresponding author: Deuk Jae Sung, MD Department of Radiology, Anam Hospital, Korea University College of Medicine, 73 Inchon-ro, Seongbuk-gu, Seoul 02841, Korea.
Tel. 82-2-920-5578 Fax. 82-2-929-3796 E-mail: [email protected]
This is an Open Access article distributed under the terms of the Creative Commons Attribution Non-Commercial License (http://creativecommons.org/licenses/by-nc/3.0) which permits unrestricted non-commercial use, distri- bution, and reproduction in any medium, provided the original work is properly cited.
J Korean Soc Radiol 2016;75(2):77-91 http://dx.doi.org/10.3348/jksr.2016.75.2.77
자기공명영상 기법
T2 강조 영상
T2 강조 영상은 단발 스핀 에코(spin echo) 또는 다중 스핀 에코 기법을 이용한다. 단발 스핀 에코 기법에는 주로 호흡 정지 half-Fourier single-shot turbo spin-echo (이하 HASTE) 기법 이 많이 사용되는데, HASTE 기법은 고식적인 고속 스핀 에코 기법에 비해 높은 대조도(contrast)와 공간 분해능(spatial res- olution)을 보이고, 인공물이 적다(5). 다중 스핀 에코 기법은 단 발 스핀 에코 기법에 비해 영상 대조도와 신호 대 잡음(signal to noise ratio), 그리고 공간 분해능이 높은 장점이 있는 반면에, 영상 획득 시간이 길어 호흡 등 움직임에 의한 인공물에 영향을 잘 받는다. 호흡과 관련된 인공물을 줄이기 위해 MRI 장비 제 조 회사에 따라 다양한 기법들[예를 들면, Blade (Siemens Healthcare, Erlangen, Germany), Propeller (GE Healthcare, Waukesha, WI, USA), MultiVane (Philips Healthcare, Best, the Netherlands)]이 사용되고 있다. T2 강조 영상에서 지방 억 제 기법은 일부에서 사용되고 있고, 영상 대조도를 개선하는 데
도움을 줄 수 있다. 최근 논문에서는 지방 억제 T2 강조 영상이 지방이 없는 혈관근지방종(angiomyolipoma)과 신세포암의 감 별에 도움이 되는 것으로 알려졌다(6).
T2 강조 영상은 낭성 신장 종괴와 고형 신장 종괴의 구분에 필수적이며, CT에서 조영 증강 여부가 불분명한 종괴의 특성을 확인하는 데 도움이 된다. 투명 세포(clear cell) 신세포암은 가 장 흔한 신세포암의 아형(subtype)으로, T2 강조 영상에서 일 반적으로 신피질에 비해 비균질한 고신호 강도를 보인다(Fig.
1)(7). 두번째로 흔한 유두상(papillary) 신세포암은 T2 강조 영상에서 흔히 저신호 강도를 보이는데, 이 T2 저신호 강도는 지방이 없는 혈관근지방종에서 전형적으로 보이는 소견이기 때 문에, 조직학적 확진을 위해서는 생검이 필요할 수 있다(Figs.
2, 3)(8). 출혈성 낭종도 낮은 T2 신호 강도를 보이는데, 조영 증강이 되지 않고 T1 강조 영상에서 고신호 강도를 보이므로 유두상 신세포암과의 감별은 쉽게 가능하다(9). 좀 더 드문 아 형인 혐색소(chromophobe) 세포 신세포암은 비균질한(hetero- geneous) T2 신호 강도를 보인다(10).
Fig. 1. 61-year-old woman with clear cell renal cell carcinoma in right kidney.
A. On T2-weighted MR image, the tumor (arrow) in right kidney shows heterogeneous hyperintensity, as compared to the normal cortex.
B. Fat-suppressed axial T1-weighted image shows the tumor (arrow) as slightly hypointense.
C, D. Contrast-enhanced fat-suppressed axial T1-weighted images show heterogeneous enhancement in the tumor (arrow) at corticomedullary phase (C) and wash-out in the tumor at nephrographic phase (D).
A
C
B
D
T1 강조 영상
복부에서의 T1 강조 영상은 빠른 영상 획득과 적절한 신호 대 잡음비를 위해 주로 경사 회복 에코(gradient recalled echo;
이하 GRE) 기법을 사용한다. 복셀(voxel) 내 지질(lipid)을 확인 하기 위해서 in-phase 영상과 out-of-phase 영상으로 구성된 화학전이영상이 이용된다. 최근에는 3차원 듀얼 에코(dual echo) Dixon 기법이 개발되었다. 이 기법을 사용하면 한 번의 호 흡 조절로 얇고 연속적인 영상을 얻으면서 물, 지방, in-phase, out-of-phase 영상 자료를 만들 수 있고, 좀 더 소량의 종양 내 부 지질을 발견할 수 있다. 다수의 에코를 사용한 Dixon 기법을
이용하면 병변 내부의 지질을 정량화할 수 있어, 종양 생물학 (tumor biology)에 대한 정보를 얻을 수 있다(11).
신세포암 내부에 육안적 지방이 보이는 경우는 매우 드물기 때문에, 종양 내부에 육안적인 지방이 지방 억제 T1 강조 영상 에서 보이면 혈관근지방종을 쉽게 진단할 수 있다(Fig. 4)(12).
세포 내 지질은 세포질(cytoplasm) 내부의 지방 분자로 육안적 으로 보이는 지방 세포의 존재와는 다르다. 화학전이영상에서 신호 강도의 감소는 많은 양의 세포 내 지질 또는 소량의 현미경 적 지방이 존재하는 신세포암에서도 보일 수 있다(Fig. 5)(13).
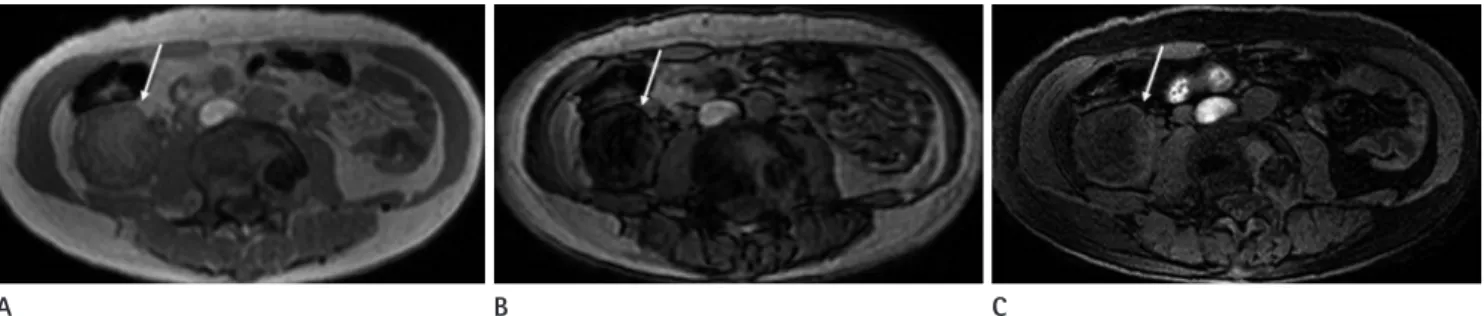
따라서 화학전이영상에서 신호 강도의 감소를 보이더라도, 지 Fig. 2. 56-year-old man with papillary cell renal cell carcinoma in right kidney.
A. Axial T2-weighted image shows a small hypointense tumor (arrow) in right kidney.
B. Fat-suppressed axial T1-weighted image also shows the tumor (arrow) as isointense.
C. Contrast-enhanced fat-suppressed axial T1-weighted image shows poor enhancement in the tumor (arrow) at corticomedullary phase.
A B C
Fig. 3. 76-year-old woman with angiomyolipoma in left kidney.
A. On T2-weighted MR image, the tumor (arrow) in left kidney shows hypointensity, as compared to the normal cortex.
B. Fat-suppressed axial T1-weighted image also shows the tumor (arrow) as isointense.
C. Contrast-enhanced fat-suppressed axial T1-weighted image shows heterogeneous enhancement in the tumor at corticomedullary phase.
D. Diffusion-weighted image acquired at b = 800 sec/mm2 shows the tumor (arrow) as slightly hyperintense.
E. Apparent diffusion coefficient map shows obvious diffusion restriction in the tumor (arrow).
A
D
B
E
C
방 억제 T1 강조 영상에서 육안적 지방이 보이지 않으면서 T2 강 조 영상에서 비균질한 고신호 강도를 보이고 조영 증강이 잘 되 는 경우는 투명 세포 신세포암에 보다 특징적이다(14). 반대로 화학전이영상에서 신호 강도의 감소를 보이고 T2 강조 영상에 서 균질한 저신호 강도를 보이는 경우는 현미경적 지방이 있는 혈
관근지방종의 가능성이 높다(15). 지방이 전혀 없는 혈관근지방 종은 화학전이영상에서 신호 강도의 감소를 보이지 않는다(16).
조영 증강 T1 강조 영상
조영제 투여 전과 투여 후, 지방 억제 T1 강조 GRE 기법이 주 Fig. 4. 44-year-old woman with angiomyolipoma in right kidney.
A, B. In-phase MR image (A) shows the tumor (arrow) as slightly hyperintense and out-of-phase MR image (B) shows obvious signal intensity drop in the tumor (arrow).
C. Fat-suppressed axial T1-weighted image shows the tumor (arrow) as hypointense.
A B C
Fig. 5. 82-year-old man with clear cell renal cell carcinoma in left kidney.
A. Axial T2-weighted image shows a heterogeneously hyperintense tumor (arrow) in left kidney.
B. Contrast-enhanced fat-suppressed axial T1-weighted image shows a heterogeneously enhancing tumor (arrow) in left kidney at corticomedul- lary phase.
C, D. In-phase MR image (C) shows the tumor (arrow) as isointense and out-of-phase MR image (D) shows focal signal intensity drop (arrow) in the tumor.
A
C
B
D
로 이용되며, 공간 분해능을 향상시키기 위해 3D interpolated 기법을 사용한다. 3D GRE 기법은 움직임에 의한 인공물이 잘 생기기 때문에 호흡 정지(breath hold)가 필요하며, 대개 호기말 (end-expiratory) 호흡 정지로 신장을 포함하는 영상을 충분히 얻을 수 있다. 2D나 호흡 유발(respiratory-triggered) 기법은 움 직임에 의한 인공물을 줄일 수 있는 반면에, 해상도가 떨어지고 영상 획득 시간이 길어진다(17).
신호강도비[signal intensity ration = (조영제 투여 후 신호 강 도 - 조영제 투여 전 신호 강도) / 조영제 투여 전 신호 강도 × 100%]를 이용한 정량적 측정은 조영 증강 여부를 확인하는 데 도움이 된다. 또한 조영제 투여 2~4분 후 측정한 신호강도비가 15~20% 이상을 보일 경우, 신장의 낭성 병변과 고형 종괴를 구 분하는 데 있어 높은 민감도와 특이도를 보인다(18). 미세한 조 영 증강 여부를 확인하기 위해 감산 영상(subtraction imaging) 기법을 사용하기도 한다. 그러나 이 기법은 호흡 정지가 잘 이 루어지지 않는 경우 영상 자료의 오등록(misregistration)으로 인해 조영 증강의 정량적 측정이 어렵다. 최근 들어 높은 시간 해상도(temporal resolution)를 보이는 역동적 조영 증강 검사 를 이용하여 약동학적 모델(pharmacokinetic model)을 평가하 는 연구들이 진행되고 있어, 가까운 미래에는 신장 종괴의 평가 를 위한 영상 프로토콜에 사용될 가능성이 높다(7).
역동적 조영 증강과 다중 시기 조영 증강(multiphasic con- trast enhancement)의 용어가 혼용되는 경우가 있지만, 신장의 검사에서 주로 이용되는 MRI의 역동적 조영 증강 검사는 엄밀 하게 볼 때 후자를 말한다. 다중 시기 조영 증강 검사로 피질기 (corticomedullary phase), 수질기(nephrographic phase), 그리 고 배설기(excretory phase)의 세 시기에 얻어지는 영상이 신장 병변의 조영 증강 특성을 정성적으로 분석하는 데 사용된다. 투 명 세포 신세포암은 피질기에서 정상 신피질에 비해 강한 조영 증강을 보이고, 수질기에는 조영 증강의 유실(wash-out)을 보 인다(Fig. 1). 반면에 유두상 신세포암은 피질기와 수질기에 걸
쳐 점차적인 조영 증강을 보이나, 정상 신피질에 비해서는 낮은 조영 증강을 보인다(Fig. 2)(7). 조영 증강 검사는 유두상 신세 포암과 지방이 없는 혈관근지방종과의 감별에 도움을 준다. 유 두상 세포암이 혈관근지방종에 비해 더 느리게 조영 증강되기 때문에, T2 강조 영상에서 균질한 저신호 강도를 보이고 동맥 기에 해당하는 피질기에 비교적 조영 증강이 잘되는 신종괴는 혈관근지방종을 더욱 시사한다(Fig. 3)(7, 16). 혐색소 세포 신 세포암은 80% 이상에서 피질기, 수질기 모두에서 정상 신피질 에 비해 낮거나 같은 조영 증강을 보이고, 2/3에서 비균질적인 조영 증강을 보이므로, 신장에서 발생하는 호산성 과립세포종 (on-cocytoma)과의 감별이 어렵다(Fig. 6)(10, 19).
조영 증강 검사에는 가돌리늄(gadolinium) 기반 조영제가 주 로 사용된다. 추정 사구체 여과율(estimated glomerular filtration rate)이 40 mL/min 이하인 신기능 장애로 신원성 전신 섬유화 증(nephrogenic systemic fibrosis)의 위험이 있는 환자에서는 가돌리늄 기반 조영제의 사용에 세심한 주의가 요구된다. 특히 다수의 신원성 전신 섬유화증 증례와 연관된 조영제인 gado- pentetate dimeglumine (MagnevistⓇ, Bayer, Leverkusen, Germany), gadodiamide (OmniscanⓇ, GE Healthcare, Oslo, Nor- way), gadoversetamide (OptimarkⓇ, Covidien, St. Louis, MO, USA)의 사용은 피해야 한다(20).
확산 강조 영상
고속 스핀 에코(fast spin-echo), 경사 에코(gradient-echo)와 echo-planar imaging, 호흡 정지, 호흡 유발, 자유 호흡(free- breathing) 영상, 그리고 적절한 수의 b값(b values) 등 확산 강 조 영상을 위한 여러 기술적인 매개변수(parameter)들은 체내 해부학적 관심부위에 따라 다양하며, 일반적으로 화학 전이 인 공물을 피하기 위해 지방 억제 기법이 사용된다. 복부영상에서 확산 강조 영상은 주로 지방 억제 단발 스핀 에코 echo-planar imaging 기법을 이용하며(21), 영상의 질을 높이고 다수의 b값
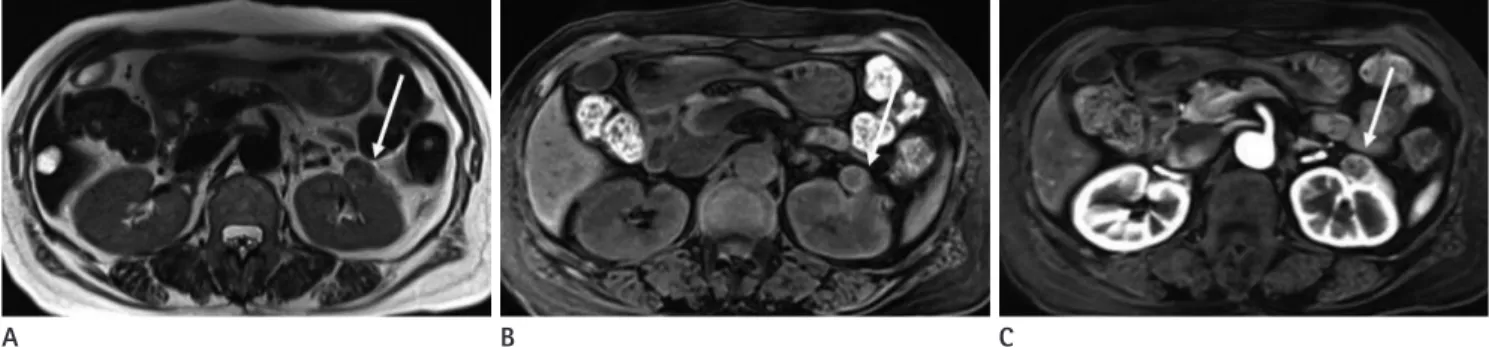
Fig. 6. 71-year-old woman with chromophobe renal cell carcinoma in left kidney.
A. Axial T2-weighted image shows a small and heterogeneously hypointense tumor (arrow) in left kidney.
B. Fat-suppressed axial T1-weighted image shows the tumor (arrow) as isointense.
C. Contrast-enhanced fat-suppressed axial T1-weighted image shows poor enhancement in the tumor (arrow) at corticomedullary phase.
A B C
을 얻기 위해 자유 호흡이나 호흡 유발 기법을 사용한다(22, 23). 확산 강조 영상에서 신호 강도는 얼마나 많은 확산 강조가 이루어졌는지를 나타내는, 장비 특이적인 요소인 b값과 조직 특 이적인 요소인 현성 확산 계수(apparent diffusion coefficient) 에 의해 결정된다. 작은 b값은 고신호 강도와 연관이 되며, 큰 b값은 높은 수준의 조직 대조도와 연관이 된다. 따라서 작은 b 값은 병변의 발견에 좋고, 큰 b값은 높은 조직 대조도와 종양 의 특성화(characterization)에 좋다. 확산 제한(diffusion re- striction)을 보이는 대부분의 병변은 확산 강조 영상에서 고신 호 강도를 보이고, 현성 확산 계수 지도에서 저신호 강도를 보인 다. 현성 확산 계수를 구하기 위해서는 최소 두 개의 b값이 필 요하기 때문에 일반적으로 세 개 이상의 b값을 사용하여 확산 강조 영상을 얻으며, b값은 다양하게 선택할 수 있다. 저자들은 신장 종괴를 평가하는 확산 강조 영상에 0, 400, 그리고 800 sec/mm2의 세 개의 b값을 사용한, 호흡 유발 단발 echo-pla- nar imaging 기법을 사용한다. 하지만 병원마다 다른 기종의 장 비와 다양한 b값의 사용으로 인해, 현성 확산 계수값의 표준화 는 아직까지 어려운 상황이다.
신세포암의 진단에서 확산 강조 영상은 다양하게 이용되고 있다. 호산성 과립세포종이나 다른 양성 병변들에 비해 신세포 암에서 현성 확산 계수값이 뚜렷이 낮게 관찰이 된다(Fig. 7) (24). 하지만 확산 제한을 보이는 양상 병변들이 있기 때문에, 악성 종양과 양성 종양의 구분은 확산 강조 영상만으로는 제한 이 있다. 대표적으로 혈관근지방종은 뚜렷한 확산 제한을 보일 수 있고, 유두상 신세포암과 비슷한 낮은 현성 확산 계수값을 보이기도 한다(Figs. 3, 8)(25). 신농양과 신우신염과 같은 염 증성 질환도 확산 제한을 보일 수 있다(26).
신세포암 아형을 구분하는 데 확산 강조 영상이 연구되어 왔 는데, 일부 연구에서는 투명 세포 신세포암이 유두상 신세포암 이나 혐색소 세포 신세포암에 비해 의미 있게 높은 현성 확산 계 수값을 보였다(27, 28). 하지만 다른 연구에서는 투명 세포 신 세포암과 다른 아형의 신세포암 사이에서 현성 확산 계수값의 의미 있는 차이를 보이지 않거나(29), 투명 세포 신세포암의 현 성 확산 계수값이 다른 아형의 신세포암에 비해 오히려 낮게 측 정되었다(30). 이러한 불일치는 아마도 신세포암 내부의 괴사 부분을 현성 확산 계수값 측정에 포함하였는지 여부에 따른 결
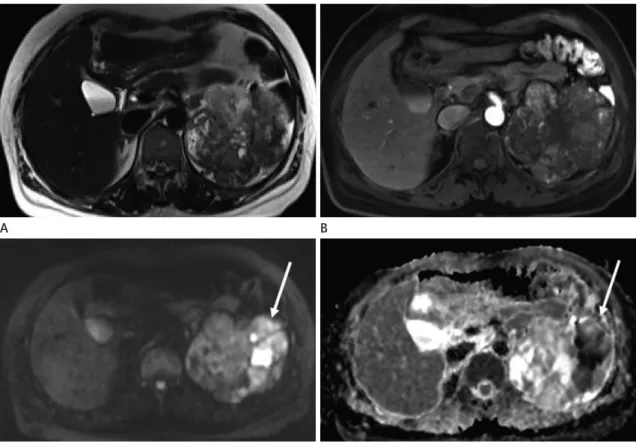
Fig. 7. 47-year-old woman with clear cell renal cell carcinoma in left kidney.
A. Axial T2-weighted image shows a heterogeneously hyperintense tumor in left kidney.
B. Contrast-enhanced fat-suppressed axial T1-weighted image shows heterogeneous enhancement in the tumor at corticomedullary phase.
C. Diffusion-weighted image acquired at b = 800 sec/mm2 shows the tumor (arrow) as heterogeneously hyperintense.
D. Apparent diffusion coefficient map shows obvious diffusion restriction in the tumor (arrow).
A
C
B
D
과일 수도 있다. 확산 강조 영상은 종양의 악성도를 평가하는 데 이용되기도 하는데, 높은 Fuhrman 등급의 투명 세포 신세 포암은 낮은 Fuhrman 등급의 투명 세포 신세포암에 비해 낮은 현성 확산 계수값을 보인다(Fig. 9)(31). 따라서 확산 강조 영 상은 작은 신종양에서 적극적 감시(active surveillance)의 적용 이 가능한 환자를 선정하는 데 유용할 수 있다. 하지만 전술한 바와 같이, MRI 장비 자체의 다양성과 영상 획득 파라미터의 차 이들로 인해 신세포암의 진단에 있어서 현성 확산 계수 역치값 (threshold value)의 이용에는 아직까지 제한점이 있다.
관류 자기공영명상(Perfusion MRI)
관류 MRI에는 역동적 조영 증강, 역동적 자화 조영(dynamic susceptibility contrast), 그리고 동맥 스핀 표지(arterial spin labeling)의 세 가지 기법이 있다. 역동적 조영 증강과 역동적 자 화 조영 기법은 가돌리늄 기반 조영제를 정맥 내 투여 후 신호
강도의 변화를 관류 파라미터의 측정에 사용한다. 역동적 조영 증강 기법의 관류 MRI는 조영제 투여 후 T1 강조 gradient echo sequence를 사용하며, 고신호 강도 병변의 영상을 약동학(ph- armacokinetic) 모델 바탕으로 후처리하여 관류 변수 지도[per- fusion parametric map; Ktrans (volume transfer constant be- tween the blood plasma and extravascular extracellular sp- ace)]를 만든다. 역동적 자화 조영 기법의 관류 MRI는 조영제 투여 후 급속 스핀 에코나 echo planar imaging 같은 T2 강조 fast sequence를 사용한다. 저신호 강도 병변의 MRI는 표시기 희석 이론(indicator dilution theory)에 따라 후처리하여 관류 혈류와 혈액량으로 구성되는 변수 지도를 만든다. 동맥 스핀 표 지 기법은 조영제가 필요 없고, 혈액 내 물 분자의 양성자를 추 적자(tracer)로 사용하며, inversion pulses로 표지를 하고, 급속 스핀 에코나 echo planar imaging으로 영상을 얻는다. 따라서 동맥 스핀 표지 관류 영상은 조영제를 사용할 수 없는 신장 기 Fig. 8. 71-year-old man with papillary cell renal cell carcinoma in right kidney.
A. On T2-weighted MR image, the tumor (arrow) in right kidney shows hypointensity, as compared to the normal cortex.
B. Contrast-enhanced fat-suppressed axial T1-weighted image shows poor enhancement in the tumor (arrow) at corticomedullary phase.
C. Diffusion-weighted image acquired at b = 800 sec/mm2 shows the tumor (arrow) as hyperintense.
D. Apparent diffusion coefficient map shows diffusion restriction in the tumor (arrow).
A
C
B
D
능이 좋지 않은 환자에서 사용이 가능하지만, 신호 대 잡음비 가 상대적으로 낮고 영상 획득 시간이 길다.
일부 예비 연구들에서 관류 MRI로 신장 종괴의 조직학적 구 분이 가능하다는 보고가 있다. 동맥 스핀 표지 관류 MRI에서 호산성 과립세포종은 신세포암에 비해 높은 관류를 보이고, 유 두상 신세포암은 다른 아형의 신세포암에 비해 낮은 관류를 보 인다(31). 역동적 조영 증강 MRI에서는 혐색소 세포 신세포암 이 다른 아형의 신세포암에 비해 높은 Ktrans 값을 보인다(32).
하지만 관류 MRI를 임상에서 효과적으로 사용하기 위해서는 영상 기법, 영상 파라미터, 호흡 조절 방법, 조영제 투여 속도 및 후처리 방법 등에 표준화가 필요하고, 아직까지 임상에서 신장 종괴의 검사에 일반적으로 사용되는 프로토콜에는 포함되지 않고 있다.
다양한 임상 적용
병기 결정
신세포암의 병기는 기본적으로 신장 밖으로 종양의 침범 정 도를 바탕으로 결정하며, 현재는 대부분 American Joint Com- mittee on Cancer에 의해 개발된 TNM 병기 체계를 따르고 있 다(Table 1).
신장 주위 지방으로 신세포암의 침윤을 진단하는 데 있어 MRI 는 약 80~91%의 정확도를 보이는데, CT에서와 마찬가지로 신장 주변 지방으로의 현미경적 종양 침윤의 확인 및 종양 침윤 과 염증 변화의 감별에 어려움이 있다(33-35). 신세포암에서 종양을 감싸는 가성 피막이 온전히 존재하는 경우 신장 주위 지방으로 종양의 침범이 없는 것을 시사한다. MRI는 신세포암 의 가성 피막을 확인하는 가장 효과적인 영상 기법이며, 가성피 막은 T2 강조 영상에서 종양과 정상 신실질 사이에서 저신호 Fig. 9. 42-year-old woman with Fuhrman grade II clear cell renal cell carcinoma in left kidney and 66-year-old man with Fuhrman grade IV clear cell renal cell carcinoma in left kidney.
A, B. The tumor (arrows) confirmed as Fuhrman grade II clear cell renal cell carcinoma shows subtle hyperintensity on diffusion-weighted image acquired at b = 800 sec/mm2 (A) and diffusion restriction on apparent diffusion coefficient map (B). The calculated apparent diffusion coefficient value of the Fuhrman grade II clear cell renal cell carcinoma is 1.15 × 10⁻³ mm2/sec.
C, D. The tumor (arrows) confirmed as Fuhrman grade IV clear cell renal cell carcinoma shows heterogeneous hyperintensity on diffusion- weighted image acquired at b = 800 sec/mm2 (C) and prominent diffusion restriction on apparent diffusion coefficient map (D). The calculated apparent diffusion coefficient value of the Fuhrman grade IV clear cell renal cell carcinoma is 0.91 × 10⁻³ mm2/sec.
A
C
B
D
강도의 띠로 보인다(34).
신정맥과 하대정맥으로 종양의 파급 범위를 확인하는 것은 수술 방법을 결정하는 데 매우 중요하다. 신정맥 내 종양 혈전 (tumor thrombus)과 단순 혈전(bland thrombus)의 구분 또한 중요한데, 조영 증강이 없는 경우는 단순 혈전을 시사하며 종양
혈전은 대개 조영 증강이 된다(Fig. 10)(36). 초창기 CT에 비 해 MRI는 정맥 내 종양 혈전을 평가하는 데 우수한 영상 기법 이었다. 그러나 다중 검출기(multidetector) 전산화단층촬영이 도입된 이후에는 종양 혈전의 진단에 있어서 MRI와 CT의 정확 도에 차이는 없다(37, 38). 신세포암이 근육층이 있는 신정맥 Table 1. TNM Classification for Renal Cell Carcinoma (UICC/AJCC, 2010)
Primary tumors (T)
TX: primary tumor cannot be assessed T0: no evidence of primary tumor
T1: tumor ≤ 7 cm in greatest dimension, limited to the kidney T1a: tumor ≤ 4 cm in greatest dimension, limited to the kidney
T1b: tumor > 4 cm but ≤ 7 cm in greatest dimension, limited to the kidney T2: tumor > 7 cm in greatest dimension, limited to the kidney
T2a: tumor > 7 cm but ≤ 10 cm in greatest dimension, limited to the kidney T2b: tumor > 10 cm, limited to the kidney
T3: tumor extends into major veins or perinephric tissues but not into the ipsilateral adrenal gland and not beyond the Gerota fascia
T3a: tumor grossly extends into the renal vein or its segmental (muscle-containing) branches, or tumor invades perirenal and/or renal sinus fat but not beyond the Gerota fascia
T3b: tumor grossly extends into the vena cava below the diaphragm
T3c: tumor grossly extends into the vena cava above the diaphragm or invades the wall of the vena cava T4: tumor invades beyond the Gerota fascia (including contiguous extension into the ipsilateral adrenal gland) Regional lymph node (N)
NX: regional lymph nodes cannot be assessed N0: no regional lymph node metastasis N1: metastasis in regional lymph node(s) Distant metastasis (M)
M0: no distant metastasis M1: distant metastasis
AJCC = American Joint Committee on Cancer, UICC = Union International Contra la Cancrum
Fig. 10. 48-year-old man with clear cell renal cell carcinoma in left kidney.
A. Coronal T2-weighted image shows a heterogeneously hyperintense tumor in left kidney with thrombus (arrow) in left renal vein.
B. Contrast-enhanced fat-suppressed coronal T1-weighted image shows heterogeneous enhancement in the thrombus (arrow) in left renal vein.
The enhancing thrombus was confirmed as tumor thrombus at surgery.
A B
분지를 침범하는 것도 환자의 예후에 좋지 않은 영향을 미치 며, 국소 병기를 결정하는 기준으로도 작용한다. 최근 연구에서 MRI에서 신동 지방(renal sinus)으로 종양의 침범이 있거나 종 양과 신동과의 거리가 0 mm인 경우 근육층이 있는 신정맥 분 지로 종양의 침범이 있음을 보고하였다(39).
림프절 전이를 진단하는 데 있어서 MRI는 CT와 마찬가지로 특이도가 낮은 편이고, 현미경적 전이의 진단에는 민감도가 낮 은 편이다. 신세포암에 적용된 적은 아직 없지만, 다양한 종양 에 의한 림프절 전이의 진단 정확도를 높이기 위해 산화철 기반 의 초상자성 나노 입자(iron oxide-based superparamagnetic nanoparticles)가 조영제로 연구되고 있다(40). MRI는 골 전이 의 진단에 있어 골 주사(bone scan)에 비해 민감도와 특이도가 높은 것으로 알려져 있다(41).
고주파 열 치료(Radiofrequency Ablation)와 냉동 치료 (Cryoablation) 후 추적 관찰
최근 영상 검사가 증가하면서 증상이 없이 우연히 발견되는 신세포암이 증가하고 있으며, 이들 신세포암은 크기가 작고 주 로 노년층에서 많이 발견되고 있다. 따라서 수술이 부담스러운 노년층 환자에서 크기가 작은 신세포암의 치료에 고주파 열 치 료나 냉동 치료가 활발하게 시행되고 있다. CT나 MRI가 이들 국소 치료의 결과를 확인하는 데 이용되고 있다. 고주파 열 치료 와 냉동 치료는 치료 후 MRI에서 비슷한 변화를 보인다. 치료 부위가 치료 직후에는 일반적으로 치료 전 종양보다 크기가 크 고 시간이 지남에 따라 크기가 점차 감소한다. 고주파 열 치료 가 시행된 직후 치료 부위는 응고괴사(coagulation necrosis)에 의해 T2 강조 영상에서 저신호 강도의 둥근, 또는 타원형 병변 으로 보인다. T1 강조 영상에서는 대부분 인접 신피질에 비해 고신호 강도를 보이나, 일부에서는 등신호 또는 저신호 강도를 보이기도 한다(42, 43). In-phase 영상과 out-of-phase 영상 에서는 열 치료된 부위의 경계를 따라 저신호 강도의 얇은 띠가 보일 수 있다(42, 43). 냉동 치료 직후 치료 부위에 iceball이 남 아 있는 경우에는 T1, T2 강조 영상에서 경계가 좋은 신호 소 실(signal void)이 보인다(44). 냉동 치료가 시행된 종양은 T2 강조 영상에서 정상 신실질에 비해 상대적으로 저신호 강도를 보이고, T1 강조 영상에서는 고신호 또는 등신호 강도를 보인 다(45, 46).
고주파 열 치료 후 3개월까지 치료된 종양 주변으로 띠 모양 의 조영 증강이 관찰될 수 있으며(42), 냉동 치료 후에는 6개월 까지 띠 모양의 주변부 조영 증강이 보일 수 있다. 이 주변부 띠 모양의 조영 증강은 조직의 괴사 손상이 완전하게 이루어지지 않은 부분에서 발생하는 반응성 변화와 조직 사이에 생긴 출혈
에 의한 것으로 여겨진다(47). 고주파 열 치료 또는 냉동 치료 로 성공적으로 치료된 종양은 T2 강조 영상에서 일반적으로 저 신호 강도를 보이지만, 일부에서는 괴사가 진전되면서 비균질적 인 신호 강도를 보이기도 하며, T1 강조 영상에서는 등신호 또는 고신호 강도를 보인다(48, 49). 고주파 열 치료가 시행된 종양 은 6개월 후 약 30% 정도의 크기 감소를 보이지만, 그 이후에 는 종양의 크기 감소가 미미하다(42, 50). 냉동 치료가 시행된 종양은 고주파 열 치료에 비해 크기가 더 감소된다(47, 51, 52).
한 보고에 의하면, 냉동 치료 6개월 후에 39%, 1년 후에 56%, 3년 후에 75%의 크기 감소를 보인다(47). 따라서 추적 관찰 도중 종양의 크기가 증가하는 경우에는, 종양의 국소 재발이나 잔존하였던 종양이 커지는 경우를 반드시 고려하여야 한다.
성공적으로 치료된 종양의 가장 중요한 특징적 소견은 조영 증강이 없는 것이다. 추적 검사에서 결절 또는 초승달 모양의 조영 증강이 계속 지속되거나 새롭게 보이면, 종양이 남아 있거 나 재발을 한 것으로 판단할 수 있다(Fig. 11)(44, 49). 치료된 종양은 T1 강조 영상에서 흔히 고신호 강도로 보이기 때문에, 미세한 조영 증강을 확인하기 위해서는 감산 영상이 필요할 수 있다(48). 조영 증강 여부를 확인하기 어렵거나 신기능 장애로 조영제를 사용할 수 없는 경우, 확산 강조 영상이 남아 있거나 재발한 종양을 찾는 데 도움이 될 수 있다(44).
표적 치료(Targeted Therapy) 후 치료 반응의 평가
전이 신세포암은 기존 항암제나 방사선 치료 또는 interfer- on-alpha나 interleukin-2를 사용하는 면역 치료에 대체로 낮 은 치료 반응을 보였다. 그러나 최근 들어 신생 혈관 형성 억제 제(antiangiogenetic drugs)를 사용하는 표적 치료가 시행되면 서 좀 더 좋은 치료 반응을 보이고 있다. 항암제나 방사선 또는 면역 치료에서는 일반적으로 Response Evaluation Criteria in Solid Tumors에 따른 종양 크기의 변화로 치료 반응을 평가한 다. 하지만 표적 치료는 종양 크기의 감소보다는 질병의 안정화 (disease stabilization)를 유도하기 때문에, 기능적 MRI에서는 치료 반응의 생리적 측정이 종양의 크기 변화보다 우선한다 (53, 54). 한 연구에 의하면, 표적 치료에 대한 반응이 있는 경 우 치료 후 시행한 T1 강조 영상에서 치료 전에 비해 종양의 신 호 강도가 증가하고 조영 증강이 감소한다(Fig. 12)(53).
신생 혈관 형성 억제제에 대한 치료 반응을 평가하는 데 있어 종양 혈관성(tumor vascularity)과 미세혈관 투과성(microvessel permeability)과 관련된 변수들을 측정하기 위해 역동적 조영 증강 MRI가 주로 연구되어 왔다(55, 56). 몇몇 연구에 따르면 치 료 전 높은 Ktrans 값과 치료 후 Ktrans 값의 상당한 감소는 종양 의 진행이 없이 생존 기간의 연장과 연관이 있었다(55, 57). 표
적 치료의 반응을 평가하기 위한 기능적 MRI로 확산 강조 영 상, blood oxygen level-dependent 영상, 동맥 스핀 표지 영상 등 이 또한 연구되어 왔다(58). 확산 강조 영상에서는 표적 치료 전에 비해 치료 3일째에는 종양의 현성 확산 계수값이 증가하
고, 치료 10일째에는 현성 확산 계수값이 감소하였다(59). 표 적 치료 4개월째 종양이 안정화되었거나 부분 반응을 보이는 환자에서 치료 1개월에 시행한 동맥 스핀 표지 기법을 이용한 관류 MRI에서는 종양 내 혈류가 상당히 감소되었다. 그러나 치
Fig. 11. 54-year-old man with clear cell renal cell carcinoma treated initially by renal cryoablation.
A, B. Two years after cryoablation, the treated tumor (arrows) shows hypointensity on axial T2-weighted image (A) and no enhancement on contrast-enhanced axial T1-weighted image (B).
C, D. Four years after cryoablation, a focal and subtle hyperintensity (arrow) is newly seen at the treated tumor on axial T2-weighted image (C), and a distinct nodular enhancement (arrow) is demonstrated at the newly developed, focal hyperintensity on contrast-enhanced fat-suppressed axial T1-weighted image (D). The nodular enhancement was confirmed as recurred clear cell renal cell carcinoma, which was treated again by ra- diofrequency ablation.
A
C
B
D
Fig. 12. 54-year-old woman with tuberous sclerosis and clear cell renal cell carcinoma treated initially by radical nephrectomy.
A. Contrast-enhanced axial CT image shows a heterogeneously enhancing mass suggesting tumor recurrence at previous left nephrectomy site.
B, C. Three months after targeted therapy with antiangiogenetic agent, the recurred tumor shows heterogeneous hyperintensity on fat-sup- pressed axial T1-weighted image (B) and poor enhancement on contrast-enhanced fat-suppressed axial T1-weighted image (C). Angiomyolipo- ma showing heterogeneous enhancement is seen in upper pole of right kidney.
A B C
료 4개월 안에 종양이 악화된 환자에서는 관류 MRI에서 종양 내 혈류가 증가하였다(60). 하지만 전술한 바와 같이, 기능적 MRI로 표적 치료의 반응을 보다 객관적으로 평가하기 위해서 는, 영상 기법과 측정하는 영상 파라미터, 후처리 방법 등에 대 한 표준화와 합의가 필요할 것이다.
결론
신세포암의 진단과 병기 결정, 그리고 치료 후 추적 관찰 등 임상적인 영역에서는 아직까지 CT가 일반적으로 사용되고 있 다. 그러나 병변의 크기가 작아 종양의 특성을 확인하기 어려운 경우나 신기능 장애 또는 과민 반응으로 CT 조영제를 사용할 수 없는 경우에, MRI는 CT를 대체하는 유용한 영상 진단법이 다. 최근 들어 확산 강조 영상을 포함한 mp-MRI가 보편적으 로 사용되고 관류 MRI 등이 연구되면서, 신세포암의 아형 및 혈관근지방종 등 양성 종양의 감별 진단, 신세포암의 조직 등 급에 따른 예후, 그리고 표적 치료 후 치료 반응을 예측하는 데 있어, MRI가 중요한 생체 표지자(biomarker)의 역할을 할 것으 로 판단된다. 이를 위해서는, 현재 개발되고 있는 다양한 영상 기법에 대한 이해와 함께, 신세포암의 중요한 영상 소견에 대한 지식 습득이 필요하다. 아울러 신세포암의 진단과 생물학적 특 성을 파악할 수 있는 필수적인 정보를 제공하면서, 검사 시간을 줄일 수 있는 새로운 영상 기법에 대한 연구가 지속되어야 할 것이다.
REFERENCES
1. Jemal A, Siegel R, Xu J, Ward E. Cancer statistics, 2010. CA
Cancer J Clin 2010;60:277-300
2. Sacco E, Pinto F, Totaro A, D’Addessi A, Racioppi M, Gulino G, et al. Imaging of renal cell carcinoma: state of the art and recent advances. Urol Int 2011;86:125-139
3. Heilbrun ME, Casalino DD, Beland MD, Bishoff JT, Blaufox MD, Coursey CA, et al. ACR Appropriateness Criteria® in-
determinate renal mass [online publication]. Reston, VA:
American College of Radiology, 2014:11
4. Willatt JM, Hussain HK, Chong S, Kappil M, Azar SF, Liu PS, et al. MR imaging in the characterization of small renal masses. Abdom Imaging 2014;39:761-769
5. Nakayama Y, Yamashita Y, Matsuno Y, Tang Y, Namimoto T, Kadota M, et al. Fast breath-hold T2-weighted MRI of the kidney by means of half-Fourier single-shot turbo spin echo:
comparison with high resolution turbo spin echo sequence.
J Comput Assist Tomogr 2001;25:55-60
6. Chung MS, Choi HJ, Kim MH, Cho KS. Comparison of T2- weighted MRI with and without fat suppression for dif- ferentiating renal angiomyolipomas without visible fat from other renal tumors. AJR Am J Roentgenol 2014;202:
765-771
7. Campbell N, Rosenkrantz AB, Pedrosa I. MRI phenotype in renal cancer: is it clinically relevant? Top Magn Reson Im-
aging 2014;23:95-115
8. Pedrosa I, Sun MR, Spencer M, Genega EM, Olumi AF, De- wolf WC, et al. MR imaging of renal masses: correlation with findings at surgery and pathologic analysis. Radio-
graphics 2008;28:985-1003
9. Israel GM, Bosniak MA. Pitfalls in renal mass evaluation and how to avoid them. Radiographics 2008;28:1325-1338 10. Rosenkrantz AB, Hindman N, Fitzgerald EF, Niver BE, Me- lamed J, Babb JS. MRI features of renal oncocytoma and chromophobe renal cell carcinoma. AJR Am J Roentgenol 2010;195:W421-W427
11. de Leon AD, Costa D, Pedrosa I. Role of multiparametric MR imaging in malignancies of the urogenital tract. Magn
Reson Imaging Clin N Am 2016;24:187-204
12. Israel GM, Hindman N, Hecht E, Krinsky G. The use of op- posed-phase chemical shift MRI in the diagnosis of renal angiomyolipomas. AJR Am J Roentgenol 2005;184:1868- 1872
13. Hindman N, Ngo L, Genega EM, Melamed J, Wei J, Braza JM, et al. Angiomyolipoma with minimal fat: can it be dif- ferentiated from clear cell renal cell carcinoma by using standard MR techniques? Radiology 2012;265:468-477 14. Cornelis F, Tricaud E, Lasserre AS, Petitpierre F, Bernhard JC,
Le Bras Y, et al. Routinely performed multiparametric mag- netic resonance imaging helps to differentiate common subtypes of renal tumours. Eur Radiol 2014;24:1068-1080 15. Sasiwimonphan K, Takahashi N, Leibovich BC, Carter RE,
Atwell TD, Kawashima A. Small (<4 cm) renal mass: differ- entiation of angiomyolipoma without visible fat from renal cell carcinoma utilizing MR imaging. Radiology 2012;263:
160-168
16. Jinzaki M, Silverman SG, Akita H, Nagashima Y, Mikami S, Oya M. Renal angiomyolipoma: a radiological classification
and update on recent developments in diagnosis and man- agement. Abdom Imaging 2014;39:588-604
17. Kim BS, Angthong W, Jeon YH, Semelka RC. Body MR imag- ing: fast, efficient, and comprehensive. Radiol Clin North Am 2014;52:623-636
18. Ho VB, Allen SF, Hood MN, Choyke PL. Renal masses: quanti- tative assessment of enhancement with dynamic MR imag- ing. Radiology 2002;224:695-700
19. Schieda N, Al-Subhi M, Flood TA, El-Khodary M, McInnes MD. Diagnostic accuracy of segmental enhancement inver- sion for the diagnosis of renal oncocytoma using biphasic computed tomography (CT) and multiphase contrast-en- hanced magnetic resonance imaging (MRI). Eur Radiol 2014;24:2787-2794
20. ACR Committee on Drugs and Contrast Media. ACR manual on contrast media, version 10.1 2015. Available at: http://
www.acr.org/Quality-Safety/Resources/Contrast-Manual.
Accessed December 23, 2015
21. Schieda N, Al-Dandan O, El-Khodary M, Shabana W. Low b-value (black blood) respiratory-triggered fat-suppressed single-shot spin-echo echo-planar imaging (EPI) of the liv- er: comparison of image quality at 1.5 and 3 T. Clin Radiol 2014;69:1136-1141
22. Choi JS, Kim MJ, Chung YE, Kim KA, Choi JY, Lim JS, et al.
Comparison of breathhold, navigator-triggered, and free- breathing diffusion-weighted MRI for focal hepatic lesions.
J Magn Reson Imaging 2013;38:109-118
23. Kandpal H, Sharma R, Madhusudhan KS, Kapoor KS. Respi- ratory-triggered versus breath-hold diffusion-weighted MRI of liver lesions: comparison of image quality and ap- parent diffusion coefficient values. AJR Am J Roentgenol 2009;192:915-922
24. Lassel EA, Rao R, Schwenke C, Schoenberg SO, Michaely HJ.
Diffusion-weighted imaging of focal renal lesions: a me- ta-analysis. Eur Radiol 2014;24:241-249
25. Agnello F, Roy C, Bazille G, Galia M, Midiri M, Charles T, et al. Small solid renal masses: characterization by diffusion- weighted MRI at 3 T. Clin Radiol 2013;68:e301-e308 26. Verswijvel G, Vandecaveye V, Gelin G, Vandevenne J, Grieten
M, Horvath M, et al. Diffusion-weighted MR imaging in the evaluation of renal infection: preliminary results. JBR-BTR 2002;85:100-103
27. Wang H, Cheng L, Zhang X, Wang D, Guo A, Gao Y, et al.
Renal cell carcinoma: diffusion-weighted MR imaging for subtype differentiation at 3.0 T. Radiology 2010;257:135- 143
28. Taouli B, Thakur RK, Mannelli L, Babb JS, Kim S, Hecht EM, et al. Renal lesions: characterization with diffusion-weight- ed imaging versus contrast-enhanced MR imaging. Radiol-
ogy 2009;251:398-407
29. Sandrasegaran K, Sundaram CP, Ramaswamy R, Akisik FM, Rydberg MP, Lin C, et al. Usefulness of diffusion-weighted imaging in the evaluation of renal masses. AJR Am J Roent-
genol 2010;194:438-445
30. Paudyal B, Paudyal P, Tsushima Y, Oriuchi N, Amanuma M, Miyazaki M, et al. The role of the ADC value in the charac- terisation of renal carcinoma by diffusion-weighted MRI. Br
J Radiol 2010;83:336-343
31. Lanzman RS, Robson PM, Sun MR, Patel AD, Mentore K, Wagner AA, et al. Arterial spin-labeling MR imaging of re- nal masses: correlation with histopathologic findings. Radi-
ology 2012;265:799-808
32. Chandarana H, Amarosa A, Huang WC, Kang SK, Taneja S, Melamed J, et al. High temporal resolution 3D gadolinium- enhanced dynamic MR imaging of renal tumors with phar- macokinetic modeling: preliminary observations. J Magn
Reson Imaging 2013;38:802-808
33. Ergen FB, Hussain HK, Caoili EM, Korobkin M, Carlos RC, Weadock WJ, et al. MRI for preoperative staging of renal cell carcinoma using the 1997 TNM classification: compari- son with surgical and pathologic staging. AJR Am J Roent-
genol 2004;182:217-225
34. Roy C Sr, El Ghali S, Buy X, Lindner V, Lang H, Saussine C, et al. Significance of the pseudocapsule on MRI of renal neo- plasms and its potential application for local staging: a ret- rospective study. AJR Am J Roentgenol 2005;184:113-120 35. Kamel IR, Hochman MG, Keogan MT, Eng J, Longmaid HE
3rd, DeWolf W, et al. Accuracy of breath-hold magnetic resonance imaging in preoperative staging of organ-con- fined renal cell carcinoma. J Comput Assist Tomogr 2004;
28:327-332
36. Laissy JP, Menegazzo D, Debray MP, Toublanc M, Ravery V, Dumont E, et al. Renal carcinoma: diagnosis of venous in- vasion with Gd-enhanced MR venography. Eur Radiol 2000;
10:1138-1143
37. Lawrentschuk N, Gani J, Riordan R, Esler S, Bolton DM.
Multidetector computed tomography vs magnetic reso- nance imaging for defining the upper limit of tumour throm- bus in renal cell carcinoma: a study and review. BJU Int 2005;
96:291-295
38. Hallscheidt PJ, Fink C, Haferkamp A, Bock M, Luburic A, Zuna I, et al. Preoperative staging of renal cell carcinoma with inferior vena cava thrombus using multidetector CT and MRI: prospective study with histopathological correla- tion. J Comput Assist Tomogr 2005;29:64-68
39. Karlo CA, Di Paolo PL, Donati OF, Russo P, Tickoo S, Hricak H, et al. Renal cell carcinoma: role of MR imaging in the as- sessment of muscular venous branch invasion. Radiology 2013;267:454-459
40. Will O, Purkayastha S, Chan C, Athanasiou T, Darzi AW, Ge- droyc W, et al. Diagnostic precision of nanoparticle-en- hanced MRI for lymph-node metastases: a meta-analysis.
Lancet Oncol 2006;7:52-60
41. Griffin N, Gore ME, Sohaib SA. Imaging in metastatic renal cell carcinoma. AJR Am J Roentgenol 2007;189:360-370 42. Merkle EM, Nour SG, Lewin JS. MR imaging follow-up after
percutaneous radiofrequency ablation of renal cell carcino- ma: findings in 18 patients during first 6 months. Radiology 2005;235:1065-1071
43. Boss A, Clasen S, Kuczyk M, Anastasiadis A, Schmidt D, Graf H, et al. Magnetic resonance-guided percutaneous ra- diofrequency ablation of renal cell carcinomas: a pilot clini- cal study. Invest Radiol 2005;40:583-590
44. Iannuccilli JD, Grand DJ, Dupuy DE, Mayo-Smith WW. Per- cutaneous ablation for small renal masses-imaging follow- up. Semin Intervent Radiol 2014;31:50-63
45. Silverman SG, Tuncali K, Morrison PR. MR Imaging-guided percutaneous tumor ablation. Acad Radiol 2005;12:1100- 1109
46. Gill IS, Novick AC, Meraney AM, Chen RN, Hobart MG, Sung GT, et al. Laparoscopic renal cryoablation in 32 patients. Urol-
ogy 2000;56:748-753
47. Gill IS, Remer EM, Hasan WA, Strzempkowski B, Spaliviero M, Steinberg AP, et al. Renal cryoablation: outcome at 3 years. J Urol 2005;173:1903-1907
48. Wile GE, Leyendecker JR, Krehbiel KA, Dyer RB, Zagoria RJ.
CT and MR imaging after imaging-guided thermal ablation of renal neoplasms. Radiographics 2007;27:325-339; discus- sion 339-340
49. Kawamoto S, Permpongkosol S, Bluemke DA, Fishman EK, Solomon SB. Sequential changes after radiofrequency ab- lation and cryoablation of renal neoplasms: role of CT and MR imaging. Radiographics 2007;27:343-355
50. Ganguli S, Brennan DD, Faintuch S, Rayan ME, Goldberg SN. Immediate renal tumor involution after radiofrequen- cy thermal ablation. J Vasc Interv Radiol 2008;19:412-418 51. Allen BC, Remer EM. Percutaneous cryoablation of renal
tumors: patient selection, technique, and postprocedural imaging. Radiographics 2010;30:887-900
52. Kawamoto S, Solomon SB, Bluemke DA, Fishman EK. Com- puted tomography and magnetic resonance imaging ap- pearance of renal neoplasms after radiofrequency ablation and cryoablation. Semin Ultrasound CT MR 2009;30:67-77 53. Kang HC, Tan KS, Keefe SM, Heitjan DF, Siegelman ES, Fla-
herty KT, et al. MRI assessment of early tumor response in metastatic renal cell carcinoma patients treated with sora- fenib. AJR Am J Roentgenol 2013;200:120-126
54. Smith AD, Shah SN, Rini BI, Lieber ML, Remer EM. Morpholo- gy, Attenuation, Size, and Structure (MASS) criteria: assess- ing response and predicting clinical outcome in metastatic renal cell carcinoma on antiangiogenic targeted therapy. AJR
Am J Roentgenol 2010;194:1470-1478
55. Hahn OM, Yang C, Medved M, Karczmar G, Kistner E, Kar- rison T, et al. Dynamic contrast-enhanced magnetic reso- nance imaging pharmacodynamic biomarker study of sora- fenib in metastatic renal carcinoma. J Clin Oncol 2008;26:
4572-4578
56. Rosen MA, Schnall MD. Dynamic contrast-enhanced mag- netic resonance imaging for assessing tumor vascularity and vascular effects of targeted therapies in renal cell car- cinoma. Clin Cancer Res 2007;13(2 Pt 2):770s-776s 57. Flaherty KT, Rosen MA, Heitjan DF, Gallagher ML, Schwartz
B, Schnall MD, et al. Pilot study of DCE-MRI to predict pro- gression-free survival with sorafenib therapy in renal cell carcinoma. Cancer Biol Ther 2008;7:496-501
58. Braunagel M, Graser A, Reiser M, Notohamiprodjo M. The role of functional imaging in the era of targeted therapy of renal cell carcinoma. World J Urol 2014;32:47-58
59. Desar IM, ter Voert EG, Hambrock T, van Asten JJ, van Spronsen DJ, Mulders PF, et al. Functional MRI techniques demonstrate early vascular changes in renal cell cancer pa- tients treated with sunitinib: a pilot study. Cancer Imaging 2012;11:259-265
60. de Bazelaire C, Alsop DC, George D, Pedrosa I, Wang Y, Mi- chaelson MD, et al. Magnetic resonance imaging-measured blood flow change after antiangiogenic therapy with PTK787/
ZK 222584 correlates with clinical outcome in metastatic renal cell carcinoma. Clin Cancer Res 2008;14:5548-5554
신세포암의 최신 자기공명영상
오세린 · 성득제*
신세포암은 신장에서 발생하는 가장 흔한 종양으로 신종양 전체의 약 85~90%를 차지하며, 영상 진단으로 초음파검사나 전산화단층촬영이 광범위하게 사용되면서 발생 빈도가 증가하고 있다. 신세포암의 진단과 병기 결정에는 아직까지 전산 화단층촬영이 중요한 역할을 하고 있지만, 자기공명영상 기법의 발달로 인하여 종양의 단순한 형태학적 분석을 넘어 종양 생물학의 특징을 예측할 수 있게 되었다. 다중매개변수 자기공명영상 프로토콜은 형태적 분석을 위한 기존의 고식적인 기 법과 함께, 종양의 미세 환경에 대한 정보를 제공하는 확산 강조 영상과 역동적 조영 증강 기법을 포함한다. 다중매개변 수 자기공명영상에서는 수술 전 신세포암의 아형과 조직학적 등급에 대한 정보를 얻을 수 있으며, 신세포암의 전이가 있는 환자에서 표적 치료에 대한 치료 반응의 정량적 분석이 가능하다. 이 논문에서는 신세포암 환자의 진단과 치료에 도움을 줄 수 있는 다양한 자기공명영상 기법과 영상 분석에 대해 논의하고자 한다. 영상의학과 의사가 환자를 위해 적절한 권고 를 할 수 있기 위해서는 최신 자기공명영상 기법과 신세포암의 다양한 영상 소견에 대해 숙지하여야 한다.
고려대학교 의과대학 안암병원 영상의학과