www.krei.re.kr 전라남도 나주시 빛가람로 601 T. 1833-5500 F. 061) 820-2211 2019년 한국농촌경제연구원 기본연구보고서 R868 공공급식 식재료 공급 실태와 개선과제 R869 글로벌시대 농산물 물류 및 상품 표준화 실태와 과제 R870 남북한 경협 재개 국면의 농업교류협력 구상과 추진 방안 R871 농업 분야 북방경제협력 활성화를 위한 민간투자 촉진 방안 R872 농업여건 변화에 대응한 농업보험정책 발전 방안 R873 농촌 활성화를 위한 창조계층 활용 방안 R874 농촌지역 저소득가구의 아동복지 실태와 정책과제 R875 보호무역주의 확산에 따른 농식품 통상분쟁 실태와 정책과제 R876 산림자원 순환경제 기반 마련을 위한 산림관리 효율화 방향 R877 산림휴양인프라 수급 실태와 정책과제 R878 수입 과일 품목 다양화에 따른 과일·과채 부문 영향 분석과 대응과제 R879 식품산업의 푸드테크 적용 실태와 과제 - 대체축산식품과 3D 식품 프린팅을 중심으로 R880 신선편이 과일·채소 시장 변화와 대응과제 R881 이상기후가 농업부문에 미치는 경제적 영향 분석 R882 저밀도 경제 기반의 농촌산업 활성화 방안 R883 지방자치단체의 농가 소득지원 실태와 정책과제 R884 지역 푸드플랜 실태와 정책과제 R885 토지공개념에 기초한 농지관리 제도 개선 방안 R886 포용성장을 위한 농업인 경영이양 지원 방안 R887 해외 곡물 도입 정책 진단과 개선 방안 R888 환경서비스를 고려한 효율적 농지자원 관리 방안 R889 농림업 분야 중점 협력국별 국제개발협력 전략 수립(2차년도) : 종합보고서 R890 농업·농촌 정책 고도화를 위한 정보지원체계 구축 방안 (2/5차년도) R891 농업구조 변화 전망과 대응과제(1/2차년도) R892 농업 혁신성장을 위한 농업기술 및 혁신성과 확산체계 개선 방안(1/2차년도) R893 미래 국토 전망과 농촌의 계획적 정비방안 연구(3/3차년도) R894 제4차산업혁명 시대의 농업·농촌 대응전략 연구(2/2차년도) R895 지방분권을 위한 농정 추진 체제 개편 방안(2/3차년도) R896 축산업의 사회적 책임 이행 실태와 정책과제(2/2차년도) R897 한국 농어촌 마을의 변화 실태와 중장기 발전 방향(5/5차년도)
신
선
편
이
과
일
· 채
소
시
장
변
화
와
대
응
과
제
신선편이 과일·채소 시장 변화와 대응과제Research on Fresh-cut Fruits and Vegetables
R
880
2019
신선편이 과일·채소
시장 변화와 대응과제
Research on Fresh-cut Fruits and Vegetables
김상효 이계임 허성윤 이욱직 R 880 l 2019. 10. l | 연구책임자 | 김상효 skim@krei.re.kr 한국농촌경제연구원 부연구위원 오하이오주립대학교 농업경제학 박사 | 연구참여자 | 이계임 lkilki@krei.re.kr 한국농촌경제연구원 선임연구위원 연세대학교 경제학 박사 허성윤 heo0411@krei.re.kr 한국농촌경제연구원 전문연구원 중앙대학교 산업경제학 석사 이욱직 jik267@krei.re.kr 한국농촌경제연구원 연구조원 부경대학교 양식학과 학사
R 880 | 2019. 10. |
신선편이 과일·채소
시장 변화와 대응과제
Research on Fresh-cut Fruits and Vegetables
연구 담당 김상효︱부연구위원︱연구총괄 이계임︱선임연구위원︱시사점 및 대응과제 도출 허성윤︱전문연구원︱자료 수집 및 통계분석 이욱직︱연구조원︱업체조사 전담 연구보고 R880 신선편이 과일·채소 시장 변화와 대응과제 등 록︱제6-0007호(1979. 5. 25.) 발 행︱2019. 10. 발 행 인︱김홍상 발 행 처︱한국농촌경제연구원 우) 58321 전라남도 나주시 빛가람로 601 대표전화 1833-5500 인 쇄 처︱크리커뮤니케이션 I S B N︱979-11-6149-326-8 ∙ 이 책에 실린 내용은 출처를 명시하면 자유롭게 인용할 수 있습니다. 무단 전재하거나 복사하면 법에 저촉됩니다.
i 건강에 대한 관심이 높아지고, 편리성을 추구하는 소비트렌드가 확산됨에 따라 섭취가 용이한 컵과일, 샐러드 등 즉석섭취용 신선편이 과일·채소에 대한 소비자의 관심이 높아지고 있다. 한편, 1인 가구나 맞벌이 가구가 확대되면서 급식/외식에 대 한 수요가 증가하는 가운데 최저임금이 가파르게 인상되어 급식/외식업체에서도 조리인력을 고용하는 대신 바로 조리할 수 있도록 처리된 즉석조리용 신선편이 채 소 이용이 늘어나고 있다. 이처럼 시장은 빠르게 변화하고 있는 데 반해, 수요자 (처)의 특성, 제품을 생산하는 업체, 제품 생산에 사용되는 원물의 생산·조달에 대 해서는 알려진 정보가 거의 없는 실정이다. 이는 빠르게 변화하는 신선편이 시장에 대응하여 관련 정책을 설계하고 실행함에 있어 장애요인으로 작용하고 있다. 이 연구는 신선편이 과일·채소를 생산하는 업체들의 실태를 파악하는 것으로부 터 시작하였다. 원물의 조달부터 제품의 판매와 경영 전반에 대한 기초정보를 정 확하고 심도 있게 생산하기 위해 모든 제조업체를 직접 방문하는 등 ‘발로 뛰는 연 구’를 추진하였다. 한편, 가구 내 주구매자와 일반소비자, 급식업체 영양사, 외식 업과 식품제조업체 등 다양한 신선편이 과일·채소의 수요자(처)의 특성과 니즈를 파악하여 농업계와 식품산업에 유용한 정보를 제공하고자 하였다. 모쪼록 이 연구의 결과가 변화와 성장이 현재진행형인 신선편이 과일·채소 시장 에서 농업계와 식품업계가 시의적절한 대응 방안을 마련하는 데 도움이 되기를 바 라며, 산업의 진흥과 규제를 담당하는 중앙부처에도 효과적인 정책의 수립과 실행 에 기여할 수 있기를 희망한다. 연구 수행과정에서 아낌없는 조언을 해주신 내·외 부 전문가와 바쁜 와중에도 인터뷰와 설문조사에 응해 주신 신선편이 제조업체 담 당자 분들, 소비자 분들, 그리고 조사업체에도 감사드린다. 마지막으로, 이 연구에 열정적으로 참여한 연구진과 그 가족들에게도 진심으로 감사의 마음을 전한다. 2019. 10. 한국농촌경제연구원장 김 홍 상
머리말
iii 연구 배경과 목적 ○ 1인 가구의 확대와 맞벌이 가구의 증가, 편리성을 중시하는 식품소비 트렌 드의 확산과 간편식 시장의 성장으로 인해 가정식과 외식/급식 등 광범위 한 식생활 영역에서 조리 및 섭취가 쉬운 과일·채소 제품에 대한 소비자 (B2C)의 수요가 증가하고 있다. 뿐만 아니라, 외식/급식시장이 지속적으 로 성장하고 있는 가운데 최저임금의 가파른 인상은 조리인력 고용에 부담 을 느끼는 업체들을 중심으로 조리가 간편한 과일·채소에 대한 업계(B2B) 수요를 증가시키는 요인으로 작용하고 있다. ○ 신선편이 과일·채소는 신선상태의 농산물을 씻고 자르는 등 최소한으로 가공한 제품으로서 원물의 형태를 알아볼 수 없는 일반적인 가공식품과는 달리 농업의 생산과 직접적으로 맞닿아 있다. 신선편이 과일·채소 시장의 성장은 농식품산업 생산 및 부가가치 증대와 연결될 수 있을 뿐 아니라, 최 종 소비자들이 간편하게 과일과 채소를 섭취할 수 있다는 점에서 우리 국 민의 건강한 식생활에도 기여할 수 있다. ○ 시장의 빠른 변화와 성장이 전망되는 시점에서 후방산업인 농업과 전방산 업으로서 식품산업, 더 나아가 산업을 진흥시키고 규제하는 정책 담당자 가 효과적으로 대응하기 위해서는 산업과 시장에 대한 실태파악 등 기초자 료 제공이 선행되어야 한다. 하지만, 이용선 외(2009) 이후 사회과학적인 조사 및 연구가 수행되지 못하고 있는 실정이다. ○ 이 연구는 최근 성장하고 있는 신선편이 과일·채소 시장의 확대에 대응하 여 수요자의 만족도를 제고하고 시장의 안정적인 성장을 위한 정책적, 산 업적 과제를 도출하기 위해 추진되었다.
요 약
iv 연구 방법 ○ 먼저 선행연구를 검토하여 본 연구에서 차별적으로 추진해야 하는 주제를 식별하고자 하였으며, 문헌 검토와 정책자료 수집, 정책 담당자 및 전문가 와의 자문회의를 개최하여 신선편이 과일·채소와 관련한 과거부터 현재까 지의 정책변화와 문제점, 시장의 이슈 등을 파악하였다. ○ 신선편이 과일·채소 시장의 실태, 문제점 등을 분석하기 위해 다양한 조사 와 분석을 실시하였다. ○ 그중에서도 가장 무게를 두고 중점적으로 추진한 것은 신선편이 과일·채 소 제조업체 조사이다. 조사의 난이도와 성실성, 응답 부담감 등을 고려하 여 외부 조사업체에 의뢰하기보다는 연구진에서 직접 수행하는 것이 나을 것이라는 판단하에, 사업체 전수조사를 목표로 직접 방문하여 조사를 실 시하였다. ○ 신선편이 과일·채소 주요 수요처의 특징을 파악하기 위해 수요처에 대한 조사·분석을 실시하였다. 가정용(B2C) 수요 조사를 위해 소비자 조사를 추진하였으며, 업무용(B2B) 수요는 급식업체와 외식업체, 식품제조업체 로 구분하였다. 설문조사와 포커스그룹인터뷰(FGI)를 병행하였다. ○ 사용한 분석으로는 ① 신선 농산물과 신선편이 제품의 가격 차이를 검정하 기 위한 t-검정, 신선편이 제조업체의 경영 실태 파악을 위한 ② 선형회귀 분석(linear regression analysis), ③ 자료포락분석(data envelopment analysis: DEA), 수요자(처)의 신선편이 제품 속성별 평가를 파악하기 위 한 ④ 중요도-만족도 분석(importance-performance analysis: IPA)과 ⑤ Best-Worst 선택실험법(choice experiment: CE), ⑥ 속성별 지불의사금액
v 을 추정하기 위한 선택실험법(CE) 및 혼합로짓모형분석(mixed logit) 등 이 있다. ○ 해외 주요국의 신선편이 시장 및 정책 현황을 살펴보기 위해 위탁연구를 진행하였다. 일본 사례의 경우 일본 홋카이도대학교 신동철 교수가 참여 하였으며, 미국/유럽 사례는 강원대학교 이상현 교수가 함께하였다. ○ 신선편이 생산에 사용되는 가공기술 및 위생/안전성 관리 현황을 파악하 고 시사점을 도출하기 위해 농촌진흥청 원예특작과학원 저장유통과 김지 강 박사에게 원고를 의뢰하였다. 주요 연구 결과 <제2장> ○ 제2장에서는 먼저 신선편이 과일·채소 정의와 범위를 설정하고, 현재 우리 나라 시장의 특징적인 부분을 소비자, 시장 구조와 규모, 가격 현황을 중심 으로 살펴보았다. 또한, 제6장 시장변화에 대응한 과제를 도출함에 활용하 고자 신선편이 과일·채소와 관련된 정책을 검토하였다. ○ 우리나라 소비자의 신선편이 과일·채소 인지도와 구매는 지속적으로 증가 하고 있는데, 이는 간편화, 건강/안전 지향, 다양화/고급화 등의 식품소비 트렌드를 반영한 것으로 판단된다. 2019년 식품소비행태조사 결과, 샐러 드용 채소나 컵과일 등의 세척 및 절단제품에 대한 구매 경험은 4점 만점 기준으로 2013년 1.73점에서 2016년 2.10점으로 상승하였고, 2019년에는 2.51점으로 크게 증가하였다. ○ 한편, 신선편이 과일·채소 시장의 유통경로를 단순화하면 농가 → 신선편
vi 이 제조업체 → (식자재업체) → 수요처(소매업체, 음식점, 단체급식소) → 소비자로 요약할 수 있다. 본 연구에서 수행한 신선편이 과일·채소 제조업 체 조사 결과, 신선편이 채소의 경우 전체 물량을 기준으로, 중개인·산지수 집상(36.9%), 농가(23.5%), 농업법인(19.6%)을 중심으로 원재료 채소를 조달하여, 신선편이 채소로 제조·처리한 뒤, 식품제조업체(27.2%), 단체 급식소(21.0%), 외식업체(19.7%)를 중심으로 판매하고 있는 것으로 나타 났다. 신선편이 과일은 해외 직접 수입(36.7%), 중개인·산지수집상 (36.5%)을 중심으로 원재료 과일을 조달하여, 신선편이 과일로 제조·처리 한 이후, 대형 할인점(34.2%), 단체급식소(22.6%), 식자재업체(21.2%) 등 으로 납품하고 있는 것으로 파악되었다. ○ 총 106개 사업장을 국내 신선편이 과일·채소 제조업체 모집단으로 삼아 방 문조사 및 전화조사를 실시하였으며, 중소기업현황정보시스템에서 확인 되는 매출액 자료를 보완적으로 활용하여 집계한 결과, 2018년 신선편이 과일·채소 시장 규모는 약 8,089억 4,833만 원으로 추산되었다. ○ 시판 중인 과일·채소 원물과 신선편이 과일·채소 가격을 B2B와 B2C로 구 분하여 비교분석하였다. B2C 대상 분석 결과, 로메인, 비타민, 적겨자, 적 채, 청경채 등 특수채소를 제외한 대부분 품목의 평균가격 차이가 유의한 것으로 나타나, 실제로 신선편이 제품들의 가격이 원물에 비해 비싸게 판 매 중인 것을 확인하였다. 적게는 g당 2원에서부터 많게는 16원까지 차이 가 발생하였으며, 평균적으로는 2배가량 신선편이 제품 가격이 원물에 비 해 비싼 것으로 분석되었다. 신선편이 채소보다 신선편이 과일에서의 가 격차이가 상대적으로 큰 것으로 나타났다. ○ 신선편이 과일·채소와 관련된 국내 정책으로는 농식품시설현대화자금이
vii 나 식품가공원료매입지원 등의 지원정책, 초등학교 돌봄교실 과일간식사 업 등의 수요기반 정책, 마지막으로 규격 설정이나 안전성 관리 정책 등이 있다. <제3장> ○ 제3장에서는 신선편이 과일·채소 생산을 담당하고 있는 제조업체 대상 설 문조사 결과를 바탕으로 ① 경영 및 사업체 일반 현황, ② 고용 및 종사자 현 황, ③ 생산·유통 현황, ④ 연구개발 현황, ⑤ 경영실태 분석, ⑥ 시장 변화와 문제점 및 애로사항 등을 파악하였다. ○ 사업체 전수조사를 목표로 직접 방문하여 조사를 실시한 결과, 신선편이 과일·채소 제조업체는 서울과 인천, 경기 등 수도권에 집중되어 있었다. 서 울·수도권에 입지한 비중은 전체 50%를 점하며, 충청권도 18.1%에 달한다. 조직형태로는 농업회사법인과 일반 민간사업체가 각 각 30곳과 28곳으로 두 형태의 비중이 전체 80%를 상회한다. 조사대상 업체의 전체 업력이 평균 10.5년인 가운데, 신선편이 제조업을 추진한 평균 업력은 7.7년이었다. ○ 매출 신장세와 신선편이 비중은 매우 빠르게 증가하고 있었다. 2016년 업 체당 평균 신선편이 매출액은 37억 4,700만 원이었으나, 2018년에는 24.6% 증가하였으며, 2019년 증가율은 42.9%에 달할 것으로 전망하고 있 었다. 이는 업체들의 전체 생산제품 매출액 증가율에 비해서도 높은 수준 이다. 조사 대상 업체들의 2018년 업체당 평균 영업이익률은 6.04%였는 데, 이는 모든 식품제조업의 평균 영업이익률이 4.89%를 상회하는 수준이 며, 전체 45개 업종 분류 중 15위에 해당하는 수치인 것으로 파악되었다.
viii ○ 비용 항목별 평균 경영비 비중은 원료 농산물 재료비가 56.4%로 과반 이상 을 점하고 있었다. 후순위인 인건비(18.9%), 물류비(7.4%)까지 합하면 80%를 초과하는 비용구조로 파악되었다. 생산공정의 자동화율은 업체당 평균 37.3%로 나타나 여전히 수작업에 의존하는 공정이 많은 것으로 확인 되었다. ○ 신선편이 제조업체는 업체당 평균 47명의 고용인이 종사하고 있어 노동집 약적인 특징을 나타냈다. 농산물을 손질하는 산업분야의 특성에 맞게 남 성에 비해 여성 종사자가 많은 구조이며, 외국인의 비중은 높지 않았다. 인 력구조는 단순노무 인력이 94%(학사급 2.1명, 석·박사 0.3명, 기사 자격증 보유자 0.4명 수준)이며, 품질관리자와 시험/검사자 보유 비율은 각각 51.4%와 36.1%로 낮은 수준으로 나타나 필요한 경우 외부 전문업체에 의 뢰하는 경우가 많았다. 신선편이 제조업은 많은 노동력을 필요로 하는 만 큼, 인력 충원에도 어려움을 겪고 있는 것으로 나타났다. 50%의 응답업체 가 2017년 대비 2018년 고용인원이 증가하였다고 답하였으며, 전체 중 70.8%가 인력 충원에 어려움이 있다고 응답하였다. 인력 충원이 어려운 원인에 대해 업체 스스로는 ‘낮은 급여조건(27.5%)’, ‘근무지가 도심지로 부터 멀리 위치(23.5%)’ 때문이라는 의견이 많았다. ○ 2018년 한 해 동안 72개 조사 대상 신선편이 제조업체에서 사용한 총 원재 료 사용량은 11만 3,535톤이었다. 가장 사용량이 많은 품목은 양상추로 2 만 6,275톤이 사용되었고, 양파(2만 255톤), 마늘(1만 1,809톤), 양배추(1 만 1,226톤), 파인애플(1만 870톤) 순이다. 조사업체의 원자료 조달처 비중 을 평균하면 원료를 도매시장에서 조달한다는 응답이 27.5%로 가장 많고, 중개인 및 산지수집상(22.5%), 농업법인(16.4%), 농가로부터 직접 구매
ix (16.2%) 순으로 나타났다. 수입산 사용 비중은 신선편이 과일이 65.6%로 채소(14.2%)에 비해 높은 편이다. 파인애플, 오렌지, 자몽, 망고, 파파야 등 은 전량 수입산을 사용하였으며, 채소 중에서 수입비중이 높은 품목은 마 늘(33.9%), 양상추(25.3%) 등이었다. ○ 전체 응답업체의 61.1%는 계약재배 경험이 없었으며, 38.9%에 해당하는 업체만이 계약재배 경험이 있는 것으로 나타났다. 계약기간은 ‘1년’이 57.1%로 가장 많아 단발성 계약거래가 많았고, 계약 물량은 전체 사용 물 량의 평균 53.2% 수준으로 집계되었다. 향후 계약재배 의향에 대해서도 응답업체의 25.0%만이 계약재배를 할 의향이 있다고 응답하였다. 한편, 계약재배 경험이 있는 업체 중 향후에도 계약재배 의향이 있는 곳은 45.8% 인 데 반해 향후에는 계약재배를 하지 않겠다는 응답 비중이 54.2%로 높 아, 기존 계약재배 거래에서의 만족도를 낮추는 요인이 있었던 것으로 판 단된다. ○ 72개 조사 대상 업체가 2018년 한 해 동안 생산해낸 신선편이 과일·채소는 총 7만 8,739톤이었다. 채소가 7만 73톤, 과일 8,665톤으로 신선편이 채소 가 90% 가까운 비중을 점하였다. 품목별로는 절단한 양상추가 1만 4,351 톤으로 가장 많이 생산되었으며, 절단 양파(6,654톤), 깐 양파(6,031톤), 깐 마늘(4,490톤)의 순이었다. 과일은 조각 파인애플이 5,198톤으로 가장 많 이 생산되었으며, 혼합과일(1,708톤), 조각 사과(455톤), 조각 멜론(372 톤), 조각 배(159톤), 조각 수박(150톤) 순으로 조사되었다. ○ 신선편이 과일·채소 제조업체의 판매(납품)의 전체 흐름을 파악하기 위해 업체별 생산액을 기준으로 매출처별 매출액 비중 응답결과에 대입하여 매 출처별 납품물량을 환산하고, 이를 다시 비중으로 재계산하였다. 신선편
x 이 전체물량은 식품제조업체(24.5%), 단체급식소(21.2%)로 납품되는 양 이 가장 많고, 외식업체(17.7%), 식자재업체(11.4%), 대형할인점(11.2%) 순이었다. 전체 물량의 78.2%는 업무용(B2B)으로, 21.8%는 가정용(B2C) 으로 납품되고 있었다. ○ 신선편이 제조업체의 영업이익률에 대한 회귀분석 결과, ① 업체 매출액이 높을수록 영업이익률이 낮은 것으로 분석되었는데 이는 매출액이 높은 대 형 업체는 영업이익률이 다소 낮더라도 조업이 가능하지만 영세한 업체가 시장에서 조업을 지속하기 위해서는 최소한도의 영업이익률이 보장되어 야만 가능하기 때문인 것으로 판단된다. 한편, ② 영농조합법인이나 농업 회사법인이 일반 민간사업체에 비해 영업이익률이 3.9%p가량 통계적으 로 유의하게 높은 것으로 분석되어 앞선 기초통계분석 결과의 방향과 일치 했다. ③ 전체 고용인력 중 정규직 비중이 높을수록 영업이익률이 낮은 것 으로 분석되었는데, 이는 정규직 인건비 부담 때문인 것으로 해석된다. ④ 전체 매출액 중 신선편이 매출액 비중이 높을수록 영업이익률이 낮은 것으 로 나타났는데, 이는 신선편이 과일·채소를 생산·관리하는 현재 단계에서 의 한계적 비용이 농산물 원물의 생산/유통이나 2차 가공품 생산에 비해 높을 수 있음을 의미한다. 또한, ⑤ 전체 판매/납품 중 B2B로의 판매 비중 이 높을수록 영업이익률이 소폭 높은 것으로 분석되어 B2B로의 마진이 B2C 마진보다 높을 수 있음을 확인하였다. ⑥ 한편, 정부지원사업 수혜 여 부는 통계적 유의성이 매우 낮은 것으로 나타났는데, 이러한 결과는 신선 편이 제조업체를 대상으로 하는 정부의 지원사업들이 실효성 있는 방향으 로 개선될 필요가 있음을 시사한다.
xi 조업체의 경영효율성 분석 결과, 분석 대상 업체 중 51개 업체의 규모효율 성은 순수기술효율성보다 높게 나타나 신선편이 제조업체들의 비효율성 이 주로 운영의 비효율성에 기인한 것임을 알 수 있었다. 이는 이들 업체가 경영효율성을 향상시키기 위해서는 투입요소와 산출요소의 재분배를 통 한 순수기술효율성 향상을 우선시해야 함을 의미한다. 규모수익 분석 결 과를 살펴보면, 6개 업체가 규모수익불변(Constant Returns to Scale: CRS) 으로 분석되어 최적 규모에서 운영되고 있는 것으로 나타났으며, 대다수 의(89%) 업체는 과소투자 상태를 의미하는 규모수익증가(Increasing Returns to Scale: IRS)에서 운영되고 있는 것으로 나타났다. 본 경영효율 성 분석으로부터 국내 신선편이 과일·채소 제조업체들의 경우, 운영 효율 성을 우선적으로 개선한 후에 규모를 확대할 필요가 있다는 시사점을 도출 하였다. <제4장> ○ 제4장에서는 신선편이 과일·채소 주요 수요처별 소비행태를 살펴보았는 데, 업체에 의한 소비(B2B)와 소비자에 의한 소비(B2C)로 구분하여 분석 하였다. B2B 소비는 다시 급식업체, 외식업체, 그리고 식품제조업체로 구 분하였으며, B2C 소비는 가구 내에서 식품을 주로 구매하는 ‘주 구매자’와 그렇지 않은 ‘일반소비자’로 구분하여 각각의 특징을 파악하고자 하였다. ○ 먼저 단체급식소 영양사 조사에서 신선편이 채소를 사용하고 있는지에 대 해 설문한 결과 55.6%의 업체에서 신선편이 채소를 사용 중이며, 44.4%의 업체는 사용하지 않고 있는 것으로 나타났다. 신선편이 채소를 사용하는
xii 이유는 ‘조리과정이 간편/편리해서(41.6%)’, ‘작업시간을 줄일 수 있어서 (29.8%)’의 비중이 높았으며, 사용하지 않는 경우 70.4%가 높은 가격 때문 이라고 응답하였다. 이와 같은 결과는 결국 식수인원이 많고 큰 업장일수 록 조리과정을 쉽고 빠르게 수행해야 하기 때문에 신선편이 형태의 재료를 사용할 유인이 작용하는 것으로 판단되었다. 신선편이 과일의 경우에는 사용 중인 업체 비중이 23.4%로 채소에 비해 낮은 수준이었다. 교육시설 (46.5%), 수도권(34.1%), 직영사업장(28.1%) 등 규모가 큰 업체에서 사용 중이라는 응답 비중이 비교적 높은 편이었다. 신선편이 과일을 사용하는 이유는 ‘조리과정이 간편/편리해서(33.3%)’, ‘작업시간을 줄일 수 있어서 (33.3%)’이며, 사용하지 않은 이유는 채소와 마찬가지로 ‘가격이 비싸서 (66.9%)’와 ‘위생안전성 등이 염려되어서(12.7%)’의 순서였다. 급식사업 장에서 가장 많이 사용한 품목은 마늘이었으며 전체 응답업체의 56.3%가 구매경험이 있었다. 양파도 50.8%로 구매경험이 많았고, 감자(47.0%), 연 근(44.8%), 대파(43.7%), 당근(42.1%)도 40%가 넘는 업체에서 사용한 경 험이 있었다. 향후 신선편이 제품의 구매의향을 조사한 결과 채소의 경우 전체 응답자의 60.0%(3.57점)가 구매할 의향이 있었으며, 구매하지 않겠 다는 응답은 8.1%에 불과했다. 신선편이 과일은 전체 응답자의 39.4%(3.23점)가 향후 구매의향이 있었으며, 20.6%는 없는 것으로 나타나 채소에 비해 향후 구매에 대한 기대는 낮은 편이다. ○ 소비자 중 가구 내 식품 주 구매자 800명을 대상으로 조리용 신선편이 채 소의 구매경험에 대해 조사한 결과, 응답자의 72.6%가 구매경험이 있는 것으로 나타나 기존 연구와 유사한 결과가 나타났다. 구매경험이 있는 경 우, 구매이유로 ‘간편/편리해서(62.1%)’, ‘적당량(소량)을 구매할 수 있어
xiii 서(28.9%)’, ‘음식물쓰레기를 줄일 수 있어서(3.6%)’ 순이었다. 구매경험 이 없는 경우 미구매이유로는 ‘가격이 비싸서(34.7%)’, ‘위생·안전성 염려 (33.3%)’, ‘신선도 등 상태가 좋지 않아 보여서(8.7%)’ 순으로 나타났다. 소비자 FGI 결과, 편리함이 조리용 간편 채소를 찾게 되는 주요 원인임에 는 이견이 없었으나, 단순히 편리함만을 찾는다기보다 가정간편식(HMR) 과 차별화되는 신선함에 주목하고 있었고, 최근 밀키트 시장의 성장과도 관련이 깊었다. 소가족화와 가구원들이 바쁜 일상으로 인해 함께 모여 식 사하는 자리가 줄어들면서, 양적인 측면으로도 간편 채소를 고려하는 것 으로 나타났다. 구매경험이 있는 소비자들 중 1년 전과 비교해서 구매량이 증가하였다는 응답은 36.5%로 나타나 감소했다는 응답(19.6%)보다 높았다. 조리용 간편 채소를 구매하는 경우라도 위생·안전성에 대한 소비자의 불안 이 큰 것으로 나타났다. 구매경험이 있는 응답자의 66.1%는 안전성이 우려되 어 다시 한 번 세척하여 조리(섭취)하는 것으로 나타났다. 응답자의 32.2%는 안전성 우려 때문에 절단면을 다시 한 번 절단한다고도 응답하였다. ○ 소비자 중 가구 내 식품 주 구매자가 아닌 일반소비자 600명을 대상으로 즉석섭취용 채소/샐러드의 구매경험에 대해 조사한 결과, 응답자의 72.0% 가 구매경험이 있는 것으로 나타났다. 구매경험이 있는 경우, 구매이유는 ‘간편/편리해서(69.0%)’, ‘적당량(소량)을 구매할 수 있어서(19.4%)’, ‘건 강(다이어트)을 위해서(7.6%)’ 순이었다. 조리용 채소와 구별되는 즉석섭 취용 채소/샐러드의 특징은 건강(다이어트) 목적으로 섭취하는 소비자들 이 많다는 점이었다. 실제 FGI에서도 건강과 다이어트, 다양한 채소의 맛 을 즐길 수 있다는 의견이 많이 표출되었다. 즉석섭취용 채소/샐러드의 구 매경험자들에 대해서도 1년 전과 비교해서 구매가 증가하였다는 응답이
xiv 32.9%로 나타나 감소하였다는 응답(18.3%)보다 높아 지속적인 구매가 이 루어지고 있는 것으로 보인다. ○ 소비자 중 가구 내 식품 주 구매자가 아닌 일반소비자 600명을 대상으로 즉석섭취용 컵/조각 과일의 구매경험에 대해 설문한 결과, 응답자의 70.2%가 구매경험이 있는 것으로 나타났다. 구매경험이 있는 경우, 구매 이유는 ‘간편/편리해서(69.6%)’, ‘적당량(소량)을 구매할 수 있어서 (21.9%)’, ‘음식물쓰레기 저감(3.1%)’ 순이었다. 구매경험이 없는 경우, 미 구매이유로는 ‘가격이 비싸서(45.3%)’, ‘위생·안전성 염려되어서 (22.3%)’, ‘신선도 등 상태가 좋지 않아 보여서(8.4%)’ 순이었다. 소비자 FGI에서는 컵/조각과일과 관련하여 ‘과일을 깎을 줄 몰라서’, ‘다양한 과 일을 모두 맛볼 수 있어서’, ‘건강한 간식이라서’, ‘부모의 마음에서 과일이 라도 먹이고 싶어서’ 등 다양한 이유로 컵/조각과일을 소비하는 것으로 나 타났다. 또한 온 가족이 식사 후 후식으로서 과일을 나누어 먹던 전통적인 가구 내 과일소비 행태가 1인 가구의 증가, 소가족화 등 가구의 분화로 점 차 사라져가고 있다는 의견에도 대다수가 동의하는 모습이었다. ○ Best-Worst 선택실험을 통해 신선편이 과일·채소의 속성별 중요도를 평가 한 결과, 신선도가 가장 중요한 속성(8.66, 더미코드 카운팅 기준)으로 평 가되었으며, 다음으로 식품위생·안전성(7.31), 가격(3.90) 순으로 나타났 다. 이들은 전통적으로 중요하게 평가되어 온 신선편이 과일·채소의 속성 이며, 이외에도 소비자들은 원료농산물의 국내산 여부, 원료의 친환경 재 배 여부, 편리한 정도(간편성) 또한 중요한 속성으로 평가하고 있었다. ○ 즉석섭취용 샐러드와 컵과일 각각의 중요 속성에 대해 일반소비자 600명 을 대상으로 선택실험 및 혼합로짓모형분석(mixed logit)을 실시하여 속성
xv 별 지불의사금액을 추정하였는데, 안전관리인증(GAP와 유사한 가상적 인증)에 대해 2,619원, 친환경농산물(유기농 인증)에 대해 2,157원을 지불 할 의사가 있는 것으로 추정되었다. 유통판매단계 온도관리인증에 대해서 도 613원, 국내산 원물에 대해서는 2,415원의 지불의사가 있는 것으로 추 정되었다. 즉석섭취용 컵과일에 대해서도 유사한 결과가 도출되었다. 단, 국내산에 대한 지불의사는 샐러드에 비해 다소 낮은 특징을 보였다. ○ 국가승인통계인 농림축산식품부의 ‘외식업 경영실태 조사’ 분석 결과, 마 늘과 양파, 파(대파), 고추 등 조사에 포함된 4대 품목에 대해 한 품목이라 도 조리용 간편 채소를 사용하는 업체 비중은 2017년 조사에서는 25.2%로 나타났으며, 2018년 조사에서는 27.2%로 나타나 소폭 증가한 모습이다. 업종별로는 출장·이동음식점업이 51.3%로 가장 많고, 일식 음식점업 (44.7%), 기관구내식당업(43.4%), 한식(37.4%), 중식 음식점업(33.1%) 순 으로 높았다. 출장·이동음식점업은 협소한 조리 공간에서 불특정 다수의 고객에게 음식을 제공해야 하는 만큼 조리용 간편 채소를 이용할 만한 유 인이 존재할 것으로 판단된다. 조리용 간편 채소를 사용하는 업체는 매출 액 상위 25%에 해당하는 4분위 비중이 29.9%로 높고 평균 연매출이 약 2 억 원에 달하는 등 매출 규모가 큰 업체가 많았다. 종업원 수도 평균 3.29 명, 사업장 면적도 평균 29.8평으로 미사용 업체에 비해 상대적으로 많고 넓어서 영업 규모가 큰 업체임을 뒷받침해주고 있다. 외식업체 구매/조리 담당자 대상 FGI 진행 결과, 외식업체에서 식재료로서 신선편이를 사용하 는지 여부는 업장 규모와 업종 그리고 제공하는 요리의 질적인 측면(맛, 풍 미)을 고려하여 결정하고 있었다. 주로 뷔페식당이나 호텔 등 대형업장에 서 신선편이를 사용하는 경우가 많았고, 소형업장에서는 신선편이를 사용
xvi 해본 경험은 있었으나 업장 규모가 작은 업소일수록 가격에 대한 부담을 크게 느끼고 있었다. 대형 식자재업체를 통해 원재료를 조달하는 업체에 서는 신선편이 원재료를 주문하기 수월하지만, 소형 식당에서는 대부분 소규모 벤더를 통해 조달하고 있어 접근성이 떨어지거나조달하는 물량이 많지 않다 보니 큰 포장 단위에 부담을 느끼고 있었다. 품질 저하 문제에 있 어서는 대부분의 참석자들이 공감하고 있었다. ○ 2018년 생산액 기준 식품제조업체 상위 업체를 대상으로 원료 농산물 구 매 책임자와 전화인터뷰를 통해, 신선편이 과일·채소 사용현황 등을 조사 하였다. 조사 대상 20개 업체 중, 음료 및 주류 업체를 제외하고 12개 업체 에 대해 조사를 실시하였다. 현재 자사의 제품을 제조하는 과정에서 사용 하는 원료 농산물 중 신선편이 원재료를 사용 중이라고 응답한 업체는 총 12곳 중 7곳으로 나타났으며, 나머지 5곳은 사용하지 않는 것으로 나타났 다. 신선편이 원재료를 사용하지 않는 5곳의 업체는 모두 주 사업 분야가 제과·제빵제조였으며, 이는 제조물의 특성이 반영된 결과임을 알 수 있다. 식품제조업체 입장에서 신선편이 원재료를 사용할지, 원료 농산물을 사용 할지는 제조물의 특성 이외에도 충분한 물량의 공급 가능성, 자가 전처리 시설의 여부와 규모, 관리비 및 인건비 부담과 상대적으로 높은 단가 등 복 잡한 손익계산 구조를 고려하여 결정하는 것으로 파악되었다. <제5장> ○ 제5장에서는 우리나라와 식생활 및 식품소비 트렌드가 유사한 일본, 신선 편이 과일·채소 시장이 전 세계적으로 가장 크고 활성화된 미국과 유럽 국
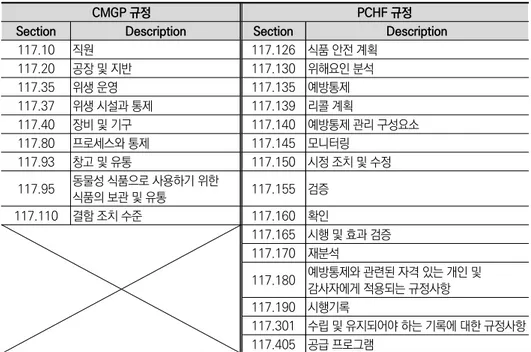
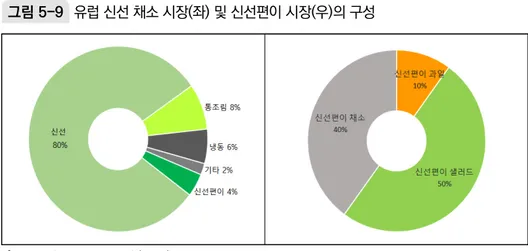
xvii 가들의 신선편이 과일·채소 시장 및 정책 현황을 검토하고 7가지 시사점을 도출하였다. ○ 첫째, 일본, 미국, 유럽 주요 국가들에서도 소비자들이 편리성을 추구하는 동시에 건강에 대한 관심도가 높아, 이를 배경으로 신선편이 과일·채소에 대한 수요가 증가하고 있는 공통적인 특징을 보이고 있다. 특히 샐러드나 외식/급식용 조리용 채소에 대한 수요가 확대될 것으로 전망된다. ○ 둘째, 신선편이식품의 위생/안전에 대한 우려 및 관련 사고/질병의 발생으 로 인해 미국에서는 안전관리를 강화하고 있는 추세이다. 영국이나 아일 랜드에서도 국내보다는 다소 높은 수준의 안전성 기준으로 신선편이식품 을 관리하고 있다. ○ 셋째, 일본에서는 ‘가공·업무용 채소 생산기반 강화사업’을 통해 계약재배 를 장려하고 국산 채소 자급률을 향상시키는 정책적 노력을 기울이고 있 다. 신선편이식품 제조업체에게 있어서 원물의 안정적 조달은 사업체 경 영의 성패를 좌우하기 때문에, 이와 같은 계약재배 장려를 위한 정책적 노 력은 우리나라에서도 적극 참고할 필요가 있다. ○ 넷째, 주요국의 신선편이식품 소매점에서는 소포장화 트렌드, 다양한 포 장 단위의 존재, 제품에 대한 다양한 정보의 제공(칼로리 및 영양소 등), 스 낵보다 넓은 매대를 차지하는 등 신선편이식품의 ‘간식화’(슈퍼마켓이나 편의점 입구에 위치), 세척 상태의 명확한 표기, 친환경 포장재 사용, 판매 (유통)기한과 소비권고일자를 별도로 표기, 가구 내 조리용 채소의 소포장 화 등의 제품 트렌드가 주목할 만하다. ○ 다섯째, 미국의 사례에서처럼 신선편이식품 관련 산업의 활성화를 위한 협회의 다양한 역할이 주목할 만하다. 우리나라 ‘한국신선편이협회’가 전
xviii 미신선농산물협회(UFPA)가 수행하고 있는 다양한 역할을 벤치마킹할 수 있도록 정부 차원에서 지원·장려하거나 정보를 제공할 필요가 있다. ○ 여섯째, 과일 및 채소 지원사업 및 소비촉진운동과 연계하여 시장의 규모 를 확대함으로써 국민의 건강한 식생활(과일·채소 섭취 증대)을 장려할 뿐 아니라 신선편이식품 산업의 활성화도 도모할 수 있을 것이다. ○ 일곱째, 해외 주요국에서는 냉동채소나 냉동과일 시장이 활성화되어 있 다. 우리나라에서도 일부 품목에 대해서는 냉동제품이 출시되고 있으며 향후 냉동제품에 대한 수요가 증가할 것으로 전망된다. <제6장> ○ 제6장에서는 시장 및 정책 현황 검토 결과, 공급자와 수요자 분석 결과, 해 외 주요국 사례로부터 얻은 시사점을 토대로 우리나라 신선편이 과일·채 소 시장을 전망하고 아래 표와 같은 대응과제를 도출하였다. 대응의 주체 는 농업, 식품산업, 그리고 정책 담당자로 구분하여 살펴보았다. 농업은 신 선편이 과일·채소 산업에 원물을 공급하는 후방산업이며, 식품산업은 신 선편이 과일·채소 제품을 직접 생산하는 주체이기도 하거니와 생산된 신 선편이 제품을 중간재로 사용하는 후방산업이기도 하다. 정책 담당자는 신선편이 과일·채소 시장과 산업에서 진흥과 규제의 역할을 수행한다는 측면에서 중요한 대응의 주체라 하겠다.
xix 국내 과일·과채와 수입 과일 간 품목별 대체관계 실증분석 결과 대응과제 분류 세부 대응과제 대응주체 단기 및 중장기 구분 Ⅰ. 상생과 포용의 산업 안정화 1. 신선편이 중소기업 지원 현실화 정부 중장기 2. 관련 단체(신선편이협회 등) 기능 및 역할 정립과 발전방향 모색 산업계 단기 3. 지역에 기반한 고용창출 지원 정부(지자체) 중장기 4. 원료의 안정적 조달체계 구축 농업계 단기 5. 기업 간 상생협력과 중소기업 자생력 강화 산업계 중장기 6. 공통된 산업적 용어와 정의 마련 정부 단기 Ⅱ. 소비기반 확대 및 소비자 신뢰 제고 7. 유통·판매단계 온도관리 강화 산업계(유통) 중장기 8. 시장정보 제공 강화를 통한 거래 활성화 산업계/정부 단기 9. 정부 정책을 통한 신선편이 과일·채소 소비 촉진 정부/산업계 중장기 10. 식품지원제도와의 연계를 통한 수요기반 확대 정부/농업계 단기 Ⅲ. 위생·안전관리 강화 11. 신선편의식품 규격 및 보존기준 현실화 정부/산업계 단기 12. 신선편이 농산물의 안전관리 기준 마련 농업계/정부 중장기 13. 매뉴얼 작성·보급 및 취급자 위생관리 교육 정부/산업계 중장기 14. 시험·검사 지원 및 자체 오염평가 기술보급 정부 단기 Ⅳ. 수요자 중심의 연구개발 및 기술 보급 강화 15. 현장친화적 연구개발 설계 산업계/정부 단기 16. 신선편이 제품 수요자의 니즈를 반영한 연구개발 추진 산업계/정부 단기 17. 민간에 의한 연구개발 지원 확대 정부/산업계 중장기 18. 환경 변화에 대응한 新연구개발 방향 설정 산업계/정부 중장기 19. 신선편이 관련 기술 보급 및 교육의 확대 정부 중장기 자료: 저자 작성.
xx
Research on Fresh-cut Fruits and Vegetables
Abbreviations
B2C : Business-to-Consumer B2B : Business-to-Business
FFV : Fresh-cut fruits and vegetables FGI : Focus group interviews
DEA : data envelopment analysis IPA : Importance-performance analysis CE : choice experiment
WTP : Willingness to pay KRW : Korean won
OPM : Operating profit margin HMR : Home meal replacement
Research Background
The demand for Business-to-Consumer (B2C) on fruit and vegetable products that are easy to cook and eat has increased in a variety of dietary areas such as home meals, eating out, and school meals. This trend has resulted from the expansion of single-person households, double-income households, food consumption trends that emphasize convenience, and the growth of the convenience food market. Besides, the steep rise in the minimum wage is a driving factor to boost the Business-to-Business (B2B)
xxi
demand for fresh-cut fruits and vegetables (FFV) among companies, which deem a financial burden to hire cooking staff under the circumstance of the steady growth in restaurant and school meal businesses.
The FFV are processed products, which have been cleaned, sliced, or prepared. Unlike other processed foods that are not identifiable in their original shapes, FFV are distinguishable. The growth of the FFV market helps to increase agricultural production and contributes to a healthy diet for consumers by allowing consumers’ easy access to fruits and vegetables.
Market research and data collection on the FFV industry should be preceded for policymakers to promote and regulate the food industry, considering the agriculture as an upstream industry and the food processing sectors as a downstream industry in the face of rapid changes and growth in the market. However, social studies have not been performed since Lee Yong sun et al. (2009).
The study explores ways to improve consumer satisfaction and to derive policy and industrial tasks for stable market growth in response to the growth of the FFV market.
Research Methodology
First of all, we reviewed the previous literature to discover research topics, then, collected policy data. Also, we held advisory meetings with policymakers and experts to identify policy changes and challenges in the market.
Various surveys and analyses were carried out for identifying the current state and problems in the FFV market. Notably, our priority was on
xxii
surveying FFV manufacturing companies. Our research team decided to interview in person, rather than entrusting an external research company for better survey results.
In order to understand the characteristics of FFV demand, we employed surveys and focus group interviews (FGI). Consumer surveys were conducted concerning B2C demand, while regarding B2B demand, survey targets were categorized into three groups for examination, which include catering companies, restaurants, and food manufacturers.
Analysis models used for this study are as follows:
The t-test was used for testing the price differences between fresh products and FFV products. Linear regression analysis and data envelopment analysis (DEA) were applied for identifying the management status of FFV the manufacturers. Importance-performance analysis (IPA) and Best-Worst Choice Experiment (CE) were used for the evaluation of FFV product attributes by consumers. CE and mixed logit analysis were applied for the estimation of Willingness to Pay (WTP) for FFV attributes.
Commissioned studies were conducted by several professors for the examination of the FFV market status and policies of major overseas countries. Dr. Shin Dong-cheol, a professor at the University of Hokkaido, and Dr. Sang-Hyeon Lee, a professor at Kangwon National University, previously participated in the case of Japan and the US/Europe, respectively.
Dr. Kim Ji-kang, who works in the postharvest research division of the National Institute of Horticultural and Herbal Science, also participated and derived implications in understanding the current state of processing technology and food safety management for production.
xxiii
Findings Chapter 2
In chapter 2, we first define FFV, then investigate commodity prices, consumer characteristics, and the FFV market’s structure and scale. Also, we examine policies related to FFV products in order to utilize them in deriving challenges in response to market changes.
The purchase of FFV in Korea has steadily increased, reflecting food consumption trends such as pursuing convenience and food safety, diversification, and quality improvement. According to the 2019 Survey of Household Food Consumption, experience in FFV purchase such as salad and cup fruits was 1.93 points in 2013; however, it rose to 2.10 points in 2016, and significantly increased to 2.51 points in 2019 (on a scale of one to four)
The simplified channel of FFV distribution is as follows: farmers → FFV manufacturers (food supply companies) → demand channels (retailers, restaurants, and catering companies) → consumers. Our results show that, in the case of vegetables, the manufacturing companies obtain raw materials from dealers or local distributor (36.9 percent), farms (23.5 percent), and agricultural corporations (19.6 percent). Then, they process the raw materials into fresh-cut vegetables and sell them to food manufacturing companies (27.2 percent), food services (21.0 percent), and restaurants (19.7 percent). For fresh-cut fruits, the raw materials are obtained through direct imports (36.7 percent), dealers or local distributors (36.5 percent), then sold to grocery markets (34.2 percent), food services (22.6 percent),
xxiv
and food suppliers (21.2 percent).
A total of 106 workplaces were surveyed face-to-face or via telephone. We also referred to sales data from the Small and Medium-sized Business Status Information System. As a result, we estimated that the FFV market in 2018 amounted to 808.9 billion KRW approximately.
We divided the prices of FFV products into B2B and B2C. The results of B2C show significant differences in the average price of most items, except some vegetables such as romaine lettuce, vitamin, red mustard, red cabbage, and bokchoy. Hence, we found that FFV are sold around twice more expensive compared to raw materials. The difference in price ranged from 2 to 16 KRW per gram. This price range was more significant in fruits than vegetables.
Domestic policies related to FFV include financial supports for the modernization of agricultural food facilities and the purchase of raw material for food processing, and the demand-side policy including fruit snacks for elementary schools. Also, there are other policies such as standard setting and safety management.
Chapter 3
In Chapter 3, we focus on identifying (1) business and enterprise status (2) employment status (3) production and distribution status (4) research and development status (5) management status, and (6) market changes and problems, based on the survey results of FFV manufacturers.
xxv
(Seoul, Incheon, and Gyeonggi-do) and 18.1 percent in the Chungcheong. There are 30 agricultural corporations and 28 private companies, accounting for more than 80 percent of the total. While the respondents answered they had been working in the manufacturing business for 10.5 years on average, the average period of working for FFV manufacturing was 7.7 years.
The sales growth of FFV and its share in the total agricultural market were increasing rapidly. For example, the average sales of FFV companies was 3.75 billion KRW in 2016. The growth rate increased by 24.6 percent in 2018 and is expected to reach 42.9 percent in 2019. This rapid increase in FFV sales shows a higher growth rate compared to those companies’ overall sales growth. The average operating profit ratio was 6.04 percent in 2018, which is 4.89 percent above the average for all food manufacturing industries and is ranked 15th out of 45 categories.
The average operating expenses contain raw materials (56.4 percent), which is more than half, labor costs (18.9 percent), and logistics costs (7.4 percent). The average automation ratio in the production process is 37.3 percent, indicating that many processes still depend on manual tasks.
FFV manufacturers have an average of 47 workers, representing labor-intensive features. Regarding the characteristics of the industry that cleans and prepares agricultural products, it has a higher proportion of female workers than male workers and a lower level of foreign employment. The labor force of FFV manufacturers consists of 94 percent of manual task workers (2.1 people with a bachelor’s degree, 0.3 people with an advanced degree, and 0.4 people with technical licenses). On the other hand, among FFV manufacturers, only 51.4 percent have internal
xxvi
quality control managers and 36.1 percent have internal inspectors. In many cases, external specialists are called for. Since the FFV manufacturing industry requires much labor, it is difficult to recruit workers. 50 percent of respondents said that their number of employees increased in 2018 compared to 2017, and 70.8 percent of respondents also stated they experienced difficulties in recruiting. These difficulties can be explained by 'low pay (27.5 percent)' and 'working places away from downtown areas (23.5 percent).'
In 2018, 72 FFV manufacturers used 11,535 tons of raw materials. The most used items were lettuce (26,275 tons), onion (20,255 tons), garlic (11,809 tons), cabbage (11,226 tons), and pineapple (10,870 tons). 27.5 percent of manufacturers obtain materials from the wholesalers, 22.5 percent from brokers and local distributors, 16.4 percent from agricultural corporations, and 16.2 percent from direct purchases from farmers. For fresh-cut fruits, 65.6 percent are imported products, while 14.2 percent of vegetables are imported. Pineapple, orange, grapefruit, mango, and papaya are all imported. Amongst vegetables, garlic and lettuce show the highest shares of foreign origin, with 33.9 percent and 25.3 percent of each product imported, respectively.
61.1 percent of the respondents of business had no experience in establishing contract farming. The most common contract period was ‘one year’ (57.1 percent) and the average volume from contract farming was tallied at 53.2 percent of the total. However, only 25.0 percent of respondents said they were willing to continue contract farming. On the other hand, only 45.8 percent of the companies with experience in contract farming are willing to continue in the future, indicating dissatisfaction of
xxvii
businesses in contract farming transactions.
The 72 FFV manufacturers produced 79,739 tons of FFV in 2018. Fresh-cut vegetables accounted for nearly 90 percent of the total (70,073 tons) and fresh fruit for 8,665 tons. By item, cut lettuce was the most widely produced (14,351 tons), followed by cut onion (6,654 tons), peeled onion (6,031 tons), and peeled garlic (4,490 tons). For fresh-cut fruits, the top products included cut pineapple (5,198 tons), mixed fruit (1,708 tons), cut apples (455 tons), cut melon (372 tons), cut pears (159 tons), and cut watermelons (150 tons).
We identified a sales channel of fruits and vegetables by computing weight from survey responses. FFV were delivered to food manufacturers (24.5 percent), food services (21.2 percent), restaurants (17.7 percent), food supply companies (11.4 percent), and grocery markets (11.2 percent). 78.2 percent were delivered to businesses, while 21.8 percent were supplied to consumers.
Regression analysis of the manufacturer's operating profit margin (OPM) demonstrates several findings. First, the higher the company's sales, the lower the OPM. The reason is that large firms with high sales can operate even if their OPM is relatively low. However, the OPM should be guaranteed at least at a minimum level so that smaller companies can run their business in the market. Second, the OPM in agricultural corporations is 3.9 percentage points higher than that of the general private sector. This figure is consistent with the basic statistics. Third, the higher the percentage of regular employees in the total workforce, the lower the OPM, because of the burden of regular labor costs. Fourth, the higher the portion of FFV sales, the lower the OPM, meaning that the marginal cost of production and
xxviii
management of fruits and vegetables may be higher than the production and distribution of agricultural raw materials or secondary processed products. Fifth, the higher the proportion of B2B sales, the higher the OPM. Therefore, the margin of B2B sales is higher than that of B2C. On the other hand, no differences with statistical significance were observed between companies with and without government support, indicating that the government support projects for the FFV manufacturers need to be improved in a productive direction.
We used data envelopment analysis (DEA) to evaluate the operational efficiency of FFV manufacturers. Our empirical study shows that scale efficiency is higher than pure technical efficiency in 51 companies. This result indicates that the inefficiency of the manufacturers mainly results from the inefficiency of operation. These companies should redistribute input and output elements to pure technical efficiency improvement in order to improve overall operational efficiency. The estimations of the return to scale presents that six firms are operating at the optimal scale, with constant returns to scale (CRS). Nonetheless, a majority of firms (89 percent) show increasing returns to scale (IRS), which means they are operated underinvested. We found that FFV manufacturers should ameliorate operational efficiency, then expand the scale.
Chapter 4
In chapter 4, we review consumption behaviors of FFV by demand, separating B2B and B2C to identify each character in terms of food
xxix
consumption. B2B consumption is divided into food services, restaurants, and food manufacturers, while B2C consumption is categorized into buyers who mainly buy food for their family and general consumers who do not.
44.4 percent of cafeteria nutritionists answered that they choose fresh-cut vegetables, while 55.6 percent did not. The reason for choosing fresh-cut vegetables is a convenient and straightforward cooking process (41.6 percent) and a short time for preparation (29.8 percent). On the other hand, the reason for avoiding FFV is high prices (70.4 percent). Our survey shows that large-size cafeterias serving many people choose fresh-cut vegetables for quick and easy serving.
In the case of fresh-cut fruits, 23.4 percent of cafeterias used them, which is relatively lower than that of vegetables. Those using fresh-cut fruits were large-scale cafeterias for educational facilities (46.5 percent), those in the metropolitan areas (34.1 percent), or those directly managed by their owner companies (28.1 percent). The reason for using fresh-cut fruits is a convenient and straightforward cooking process (33.3 percent) and a short time for preparation (33.3 percent). The reason for not choosing fresh-cut fruits includes high prices (66.9 percent) and concerns for food safety (12.7 percent). 56.3 percent of the respondents had the experience of purchasing fresh-cut garlic, the most used item at cafeterias, followed by onion (50.8 percent), potato (47.0 percent), lotus root (44.8 percent), leek (43.7 percent), and carrot (42.1 percent). 60.0 percent (3.57 points) of the total respondents are willing to buy fresh-cut vegetables in the future, while only 8.1 percent of them said they would not buy fresh-cut vegetables. In the case of fresh-cut fruits, 39.4 percent (3.23 points) of the total respondents are willing to purchase them in the future, while 20.6 percent are not expected
xxx
to buy them.
In a household survey of 800 consumers, 72.6 percent of respondents reported that they had the experience of purchasing fresh-cut vegetables, which is consistent with the previous study. The consumers with purchasing experience cited as reasons a convenient and straightforward cooking process (62.1 percent), appropriate or small quantity (28.9 percent), and a reduction in food waste (3.6 percent). The reason for avoiding fresh-cut vegetables is high prices (34.7 percent), concerns for food safety (33.3 percent), and low vegetable quality (8.7 percent).
According to a consumer focus group interview (FGI), convenience is the main reason for purchasing ready-to-cook vegetables. However, they pay attention to freshness, which distinguishes fresh-cut vegetables from home meal replacements (HMR), rather than merely pursuing convenience. This trend is also related to the growth of the meal kit market. As the number of small families increases, and household members are busier with their daily routines, the number of meals sharing with family members decrease. Therefore, consumers also prefer fresh-cut vegetables because of the small quantity. The consumers responded that their purchasing amount of fresh-cut vegetables increased compared to the previous year (36.5 percent). On the other hand, for 19.6 percent of consumers, their purchasing volume decreased. For the consumers with the experience of purchasing fresh-cut vegetables, their concern about hygiene and safety is still considerable. For example, 66.1 percent of the respondents with purchasing experience is worried about safety, and they wash vegetables before cooking. Also, 32.2 percent of the respondents said they cut and discard the edge of fresh-cut vegetables because of safety reasons.
xxxi
According to a survey with 600 general consumers, who are not the primary purchaser in households, 72.0 percent of them purchased ready-to-eat salads. For those with purchasing experience, the reason for purchasing is simplicity/convenience (69.0 percent), appropriate or small quantity (19.4 percent), and health (7.6 percent). The distinctive feature of ready-to-eat salads is that many consumers take them for health (diet) purposes. In fact, the results of FGI suggested that consumers can enjoy a healthy diet, taking various vegetables through ready-to-eat salads. The consumers responded that their purchasing amount of ready-to-eat salads increased compared to the previous year (32.9 percent). On the other hand, for 18.3 percent of consumers, their purchasing volume decreased. The figures are indicative of continuous purchases.
Among 600 consumers who are not the primary purchaser in the household, 70.2 percent of the respondents said they had experience in buying cup fruits. For those, the reason for buying is simplicity/convenience (69.6 percent), appropriate or small quantity (21.9 percent), and a reduction in food waste (3.1 percent). Those who did not buy cited high prices (45.3 percent), concerns for hygiene and food safety (22.3 percent), and low quality (8.4 percent) as reasons. Also, the majority of the respondents agreed that traditional fruit consumption in households, where the whole family shared fruit as a dessert after meals, is gradually disappearing due to the growing number of single-person households and small families.
According to the Best-Worst scaling choice experiment, freshness was evaluated as the most important attributes (8.66, based on the dummy code counting), followed by food hygiene and safety (7.31), and price (3.90). These are the attributes of fruits and vegetables that are traditionally
xxxii
evaluated as essential. Besides, consumers also consider whether raw materials are domestic, whether they are grown environmentally friendly, and how convenient they are (simplicity) as important attributes.
We estimated the willingness to pay (WTP) through selective experiments and mixed logit analysis on attributes of ready-to-eat salads and cup fruits. As a result, WTP was estimated as following; 2,619 KRW for safety management certification (virtual certification similar to GAP); 2,157 KRW for eco-friendly agricultural products (organic products certification); 613 KRW for cold chain management certification in distribution and sales stage; and 2,415 KRW for domestic products. Similar results were obtained for cup fruits. However, the WTP for domestic products is lower than that of salads.
According to a survey on restaurants, provided by the Ministry of Agriculture Food and Rural Affairs, 25.2 percent of companies purchase fresh-cut vegetables for one of the common spices (garlic, onion, leek, and red peppers) in 2017. This percentage slightly increase to 27.2 percent in 2018. By industry type, catering companies account for 51.3 percent, followed by Japanese restaurants (44.7 percent), cafeterias (43.4 percent), Korean restaurants (37.4 percent), and Chinese restaurants (33.1 percent). Since the catering service companies have to provide food to a large number of customers in a small cooking area, they are reasons to use fresh-cut vegetables. The companies using fresh-cut vegetables are relatively large since the first quartile of them takes 29.9 percent in sales, and their annual sales, on average, amounts to about 200 million KRW. Besides, the average number of employees for these companies is 3.29 and the size of the workplace is 98.5 square meters (m2), which is relatively bigger than those
xxxiii
not using fresh-cut vegetables. From the results of FGI targeting restaurant chefs and workers in charge of purchasing, the size and type of business and the quality of foods (taste and flavor) are the main factors to decide whether to buy FFV or not. FFV are mostly used in large businesses such as buffet restaurants and hotels. On the other hand, small businesses have experience in using FFV but feel burdened about serving FFV. For large restaurants, it is easier to acquire FFV through large food suppliers. However, small restaurants buy FFV through small vendors, which means that they have trouble in securing supply routes. Also, most of the respondents were concerned about the low quality.
We surveyed top food manufacturing companies based on sales in 2018 by interviewing persons in charge of purchasing raw materials via telephone. We interviewed 12 companies out of the 20, excluding beverage and liquor companies. Seven respondents said that they use FFV to manufacture their products, while five others do not use FFV. However, these five companies are in the bakery business, which reflects the characteristics of the products. Additionally, there are other driving factors for whether to purchase FFV in consideration for profit and loss, such as supply availability, preprocessing equipment and size, and labor and maintenance costs.
Chapter 5
In Chapter 5, we examine FFV market trends and policies in other countries, such as Japan with similar food consumption patterns to Korea, the United States with the largest FFV market in the world, and European
xxxiv
countries. From our examination, we derived seven implications.
First, it is a common characteristic to pursue convenience and pay attention to health. Thus, the demand for salads and vegetables for restaurants and food services is likely to increase, as in the case of Japan, the United States, and major European countries.
Second, there is a trend toward strengthening food safety regulations because of hygiene/safety concerns on fresh-cut products and the occurrence of related accidents. In the UK and Ireland, fresh-cut products are treated under stricter safety regulations than in Korea.
Third, Japan is making policy efforts to encourage contract farming and improve the self-sufficiency rate of domestic vegetables through the government policy of strengthening vegetable production bases. For food manufacturers, business success depends on the stable acquirement of raw materials. Thus, Korea needs to consider such policy efforts.
Fourth, there are several noteworthy trends in retail stores, such as various packaging units using eco-friendly materials, and the labeling of nutrition facts, washing conditions and the best by date. FFV become refreshments displayed at the entrance of supermarkets or convenience stores, and occupy bigger space than the snack section.
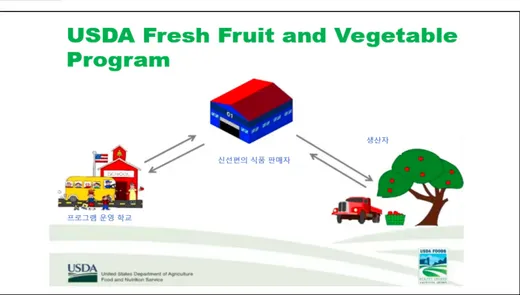
Fifth, the various roles of industrial associations to stimulate fresh-cut products are significant, as is the case of the United States. It is necessary to support, encourage, or provide information at the government level so that the Korea Fresh-cut Association can benchmark the roles played by the National Fresh Agricultural Products Association (UFPA).
Sixth, the government can encourage a healthy diet (an increase in consumption of fruits and vegetables) as well as promote the revitalization
xxxv
of the fresh food industry, by expanding the size of the market in conjunction with fruit and vegetable support projects and consumption promotion campaigns.
Seventh, the frozen vegetables and frozen fruits market are active in major countries. Some frozen products are in the market in Korea and their demand is likely to grow down the road.
Chapter 6
In Chapter 6, we forecast Korea’s FFV market trends and derive policy tasks to take countermeasures based on the previous literature and implications from other countries. We divide subjects into three parts, including the agriculture industry, the food processing industry, and policy officers. Agriculture is a back-end industry, from which FFV products are provided, while the food industry manufactures FFV and also uses FFV as intermediates. Policymakers play a significant role in promoting and regulating the FFV market.
projects Leading institution Period
Ⅰ. Industrial stabilization
through cooperation
1. Fresh-cut processing support for small and
medium-sized businesses Government long-termMid- and 2. Establishing functions and roles of related
organizations processing Industry Short-term 3. Support for local job creation Local government long-termMid- and 4. Establishment of stable acquirement system
for raw materials Agricultural industry Short-term 5. Collaboration among businesses and
strengthening capability in small and medium- sized enterprises
processing Industry long-termMid- and 6. Defining industrial terms Government Short-term
xxxvi
Source: own
Researchers: Kim Sanghyo, Lee Kyei-im, Heo Seongyoon, Lee Wookjik Research period: 2019. 1. ~ 2019. 10.
E-mail address: skim@krei.re.kr
projects Leading institution Period
Ⅱ. Expanding demand and
enhancing consumer trust
7. Strengthening the temperature control at the distribution and sales stage
Distribution industry
Mid- and long-term 8. Transaction activation through reinforcement
of market information
Processing industry
/ Government Short-term 9. Promotion consumption of fruits and
vegetables though government policies
Government / processing industry
Mid- and long-term 10. Expanding the Demand with the Food
Support System
Government /
agricultural industryShort-term Ⅲ.
Strengthen hygiene and
safety management
11. Establishing standards for fresh-cut products and preservation
Government /
processing industry Short-term 12. Preparation of safety management
standards for fresh-cut products
agricultural industry / Government
Mid- and long-term 13, Creation and distribution handbook and
hygiene training for managers
Government / processing industry
Mid- and long-term 14. Inspection and test support against pollution Government Short-term
Ⅳ. Reinforce demand-based
research and development
15. Research and development design focused on field
Processing industry
/ Government Short-term 16. Research and development reflecting the
consumer’s needs of fresh-cut products
Processing industry
/ Government Short-term 17. Expansion of Research and development
support by the private sector
Government / Processing industry
Mid- and long-term 18. Establishing research and development
direction in response to environmental change
Processing industry / government
Mid- and long-term 19. Expanding education and dissemination of
technology related to fresh-cut products Government
Mid- and long-term
xxxvii 제1장 서 론 ···1 1. 연구 필요성 및 목적 ···3 2. 선행연구 검토 ···5 3. 연구의 내용 ···12 4. 연구 범위 ···13 5. 연구 방법 ···15 6. 연구 추진체계 ···21 제2장 신선편이 과일·채소 시장 현황 ···23 1. 신선편이 과일·채소의 정의 및 사례 ···25 2. 신선편이 과일·채소 시장 특성 ···29 3. 신선편이 과일·채소 관련 정책 현황 ···42 제3장 신선편이 과일·채소 제조업의 생산 현황과 문제점 ···47 1. 신선편이 과일·채소 제조업 현황 ···49 2. 신선편이 과일·채소 제조업의 경영실태 분석 ···70 3. 문제점 및 애로사항 ···75 제4장 신선편이 과일·채소 수요처별 소비행태 분석 ···85 1. 급식업체의 신선편이 과일·채소 이용실태 분석 ···87 2. 소비자의 신선편이 과일·채소 구매행태 분석 ···98 3. 외식/가공업체의 신선편이 과일·채소 이용실태 분석 ···123 4. 식품제조업체의 신선편이 과일·채소 이용실태 ···130 5. 신선편이 제품 수요처별 특징과 시사점 ···131
차 례
xxxviii 제5장 주요국의 동향과 시사점 ···133 1. 일본 신선편이 과일·채소 시장 현황 및 정책 ···135 2. 미국 신선편이 과일·채소 시장 현황 및 정책 ···140 3. 유럽 신선편이 과일·채소 시장 현황 및 정책 ···147 4. 해외사례 시사점 ···151 제6장 신선편이 과일·채소 시장 전망과 대응과제 ···153 1. 신선편이 과일·채소 시장 전망 ···156 2. 대응과제 ···170 부록 1. 신선편이 과일·채소 소비자조사 분석 결과 ···195 2. 단체급식소 신선편이 과일·채소 이용실태 조사 결과 ···239 참고문헌 ···253
xxxix 제1장 <표 1-1> 주요 용어의 사용 구분 ···15 <표 1-2> 신선편이 과일·채소 제조업체 조사 개요 ···16 <표 1-3> 소비자 조사 개요 ···17 <표 1-4> 소비자 포커스그룹인터뷰(FGI) 개요 ···17 <표 1-5> 소비자 FGI 대상자 특성 및 참고자료 ···18 <표 1-6> 단체급식소 영양사 조사 개요 ···18 <표 1-7> 외식업체 식재료 구매 현황 조사 개요 ···19 <표 1-8> 외식업체 포커스그룹인터뷰(FGI) 개요 ···19 <표 1-9> 시판 상품 가격조사 개요 ···20 <표 1-10> 한국기업데이터(KED) 기업정보 DB 개요 ···20 제2장 <표 2-1> 국내 선행연구에서의 정의와 범위 ···26 <표 2-2> 신선편이 채소 구매경험 및 전년 대비 구매 변화 ···31 <표 2-3> 신선편이 과일 구매경험 및 전년 대비 구매 변화 ···33 <표 2-4> 신선편의식품 생산 및 판매 추이 ···36 <표 2-5> 가정용(B2B) 품목별 g당 평균단가 비교 ···39 <표 2-6> 업무용(B2B) 품목별 g당 평균단가 비교 ···41 <표 2-7> 신선편이 과일·채소 관련 정책 현황 ···43 <표 2-8> 과일간식 제공에 따른 국산과일 연간소비량(추정) ···44 <표 2-9> 식품의약품안전처의 신선편의식품의 규격 ···45 <표 2-10> 국립농산물품질관리원의 신선편이 농산물 표준규격 ···46 제3장 <표 3-1> 신선편이 과일·채소 사업체 특성 ···50 <표 3-2> 식품제조업 세부 업종별 영업이익률 비교 ···52