저작자표시-비영리-변경금지 2.0 대한민국 이용자는 아래의 조건을 따르는 경우에 한하여 자유롭게
l 이 저작물을 복제, 배포, 전송, 전시, 공연 및 방송할 수 있습니다. 다음과 같은 조건을 따라야 합니다:
l 귀하는, 이 저작물의 재이용이나 배포의 경우, 이 저작물에 적용된 이용허락조건 을 명확하게 나타내어야 합니다.
l 저작권자로부터 별도의 허가를 받으면 이러한 조건들은 적용되지 않습니다.
저작권법에 따른 이용자의 권리는 위의 내용에 의하여 영향을 받지 않습니다. 이것은 이용허락규약(Legal Code)을 이해하기 쉽게 요약한 것입니다.
Disclaimer
저작자표시. 귀하는 원저작자를 표시하여야 합니다.
비영리. 귀하는 이 저작물을 영리 목적으로 이용할 수 없습니다.
변경금지. 귀하는 이 저작물을 개작, 변형 또는 가공할 수 없습니다.
공학박사 학위논문
Pore Structures in Components of Polymer Electrolyte Membrane Fuel Cells
and Water Electrolysis
고분자 전해질 막 연료전지와 수전해 구성요소의 기공 구조 연구
2019 년 8 월
서울대학교 대학원
공과대학 화학생물공학부 에너지환경화학융합기술전공
박지은
i
Abstract
Pore Structures in Components of Polymer Electrolyte Membrane Fuel Cells
and Water Electrolysis
Ji Eun Park School of Chemical and Biological Engineering Chemical Convergence for Energy & Environment The Graduate School Seoul National University
Hydrogen is attracting attention as an alternative energy source as it has high energy density and is environmentally friendly source without CO2 emission. It is used as a fuel for fuel cells, generating electricity. Fuel cells are energy conversion devices that directly convert chemical energy to electrical energy using hydrogen and oxygen gases. Among various types of fuel cells, polymer electrolyte membrane fuel cells (PEMFCs) have widely developed due to its high efficiency and low operating temperature. In addition, hydrogen can be produced by water electrolysis. While alkaline water electrolysis has been widely used, polymer electrolyte membrane water electrolysis with proton-exchange membrane (PEM) or anion-exchange membrane (AEM) has been considered as promising water electrolysis owing to high efficiency and high purity hydrogen production.
The development of pore strucuture in components is crucial for improving performance of practical electrochemical devices such as fuel cell and water electrolysis. While the catalytic activity of electrocatalysts has been sharply
ii
enhanced by extensive research, their practical performance has not captured the performance obtained in half-cell test. This is why the pore structure in components needs to be investigated to exhibit high practical performance by preparing the porous components that are suitable for electrocatalys to participate to oxygen reduction reaction (ORR) or oxygen evolution reaction (OER).
Chapter 1 briefly introduces the fuel cells and water electrolysis. The features, components, and performance of fuel cell are introduced. Also, the types, features, performance, and recent literature of water electrolysis are addressed.
In chapter 2, porous flow field was applied in PEMFCs to improve the mass transport of reactants and products. Flow field is important component that supplies reactatnt into catalyst layer and removed the generated water. Metal foam has been considered as porous flow field due to its structrual characterastics. However, few studies on investigation of its microstructrues has been reported. Various kinds of copper-foam were applied and examined to attain the optimal structrue that exhibits high performance. The PEMFCs with optimized metal-foam showed 2-fold performance enhancement compared with that with conventional flow field, which is the highest performance reported to date despite operation with an ambient pressure. It is attributed to the internally generated pressure in copper-foam as well as enhanced mass transport.
In chapter 3, porous electrode with inverse-opal structure was proposed as anode in PEMWE to enhane the utilization of IrO2 catalyst, thereby reducting the loading. In PEMWE, a high catalyst loading is used to exhibit high performance, leading to high PEMWE cost. To reduce catalyst loading, porous structure is applied in anode. Inverse-opal structrue is three-dimensionally structure consisting of ordered and interconnected pores. Due to its large surface area, inverse-opal membrane-electrode assembly (MEA) exhibited higher performance than conventional MEA.
iii
Furthermore, inverse-opal MEA showed the highest mass activity as catalyst loading was ultra-low. This is beacuse inverse-opal structure resulted in enhancement of catalyst utilization.
In chapter 4, the MEA parameters and operating conditions for AEMWE was optimized to achieve high performance. Unlike PEMWE consisting of standard proton exchange membrane (PEM) (Nafion), a few studies regarding AEMWE have been reported as standard anion exchange membrane (AEM) do not exist. Also, few studies investigating the MEA of AEMWE have been reported.
Therefore, the development of highly efficient MEA in AEMWE is important for enhancing cell performance. The optimization results showed that the AEMWE performance exhibited the highest performance among other research reported in literature.
In chapter 5, graphitic carbon nitride-carbon nanofiber (g-CN-CNF) composite was applied as OER electrocatalyst for anode in AEMWE to form porous electrode. The use of carbon nanofiber resulted in preparation of porous electrode by enlarging secondary pores. g-CN-CNF catalyst is the composite mixing g-CN, which consists of N and C, and CNF. While n- doped carbon materials have been reported to have OER activity, it is the first reserach to apply carboneous materials on practical AEMWE. g-CN- CNF exhibited high OER activity in half-cell test due to its high content of pyridinic nitrogen. Also, AEMWE with g-CN-CNF catalyst showed outstanding practical performance. This is owing to the formation of large secondary pores in electrode.
Keywords: Polymer Electrolyte Membrane Fuel Cells, Proton Exchange Membrane Water electrolysis, Anion Exchange Membrane Water Electrolysis, Porous structure
Student number: 2016-30224
iv
Contents
Abstract ...i
Contents ...iv
List of Tables ...vii
List of Figures ...ix
Chapter 1. Introduction ...1
1.1. General Introduction to Polymer Electrolyte Membrane Fuel Cells...1
1.2. General Introduction to Polymer Electrolyte Membrane Water Electrolysis...6
1.3. Aim of This Thesis...12
1.4. References ...16
Chapter 2. Optimization of Copper-foam Micro-structures as Flow Field for Polymer Electrolyte Membrane Fuel Cells...22
2.1. Introduction ...22
2.2. Experimental Section...24
2.3. Results and Discussion...28
2.4. Conclusions...56
2.5. References...57
v
Chapter 3. Ultra-Low Loading of IrO
2with an Inverse-Opal Structure in a Proton Exchange Membrane Water
Electrolysis...63
3.1. Introduction...63
3.2. Experimental Section...67
3.3. Results and Discussion...70
3.4. Conclusions...97
3.5. References...98
Chapter 4. Development of Membrane-electrode Assembly for High-performance Anion Exchange Membrane Water Electrolysis...103
4.1. Introduction...103
4.2. Experimental Section...107
4.3. Results and Discussion...110
4.4. Conclusions...134
4.5. References...135
Chapter 5. Graphitic carbon nitride-carbon nanofiber as oxygen evolution reaction catalyst in anion-exchange membrane water electrolyzer...139
5.1. Introduction...139
vi
5.2. Experimental Section...142
5.3. Results and Discussion...145
5.4. Conclusions...168
5.5. References...169
국문 초록 (Abstract in Korean) ...174
List of Publications (SCI) ...177
vii
List of Tables Chaper 1
-
Chaper 2
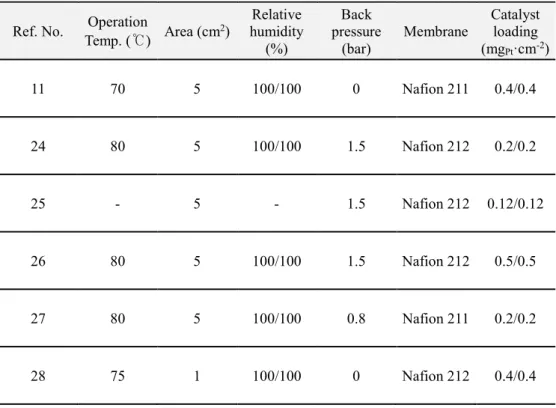
Table 2.1. Specific resistance (mΩ·cm) and contact angle (°) of copper-foam and conventional flow field...29 Table 2.2. Copper-foam parameters...31 Table 2.3. Porosity of compressed copper-foams (250 μm) and pressure generated in copper-foam flow field MEAs...34 Table 2.4. Operating condition of the references shown in the performance comparison (Fig. 2.11b)...47
Chaper 3
Table 3.1 The summary of catalyst loading, cell performance, mass activity of some reported IrO2 catalyst in PEMWE...96
Chaper 4
Table 4.1 Porosity of MEA with different ionomer contents measured by using mercury porosimetry……….121 Table 4.2 The summary of materials, components, cell operations, and performance of AEMWE reported in literature...131
Chaper 5
Table 5.1 Summary of nitrogen properties, binding energy, content of g-CN-CNF-
viii
T materials………155 Table 5.2 Summary of nitrogen properties, binding energy, content of g-CN-CNF- N wt materials..………159
ix
List of Figures
Chaper 1
Figure 1.1 Schematic diagram of polymer electrolyte membrane fuel cells (PEMFCs)...3 Figure 1.2 Typical I-V curve of polymer electrolyte membrane fuel cells (PEMFCs)...4 Figure 1.3 Schematic diagram of proton exchange membrane water electrolyzer.
Adapted from Ref 30 (J. Power Soc. 2017, 366, 33-35)...8 Figure 1.4 Schematic diagram of anion exchange membrane water electrolyzer...9 Figure 1.5 The comparison in performance of three water electrolysis (alkaline water electrolysis, PEMWE, and AEMWE). Adapted from Ref 37 (Meeting Abstracts 2015, MA2015-01, 1489)...11 Figure 1.6 Comparison of catalytic activity obtained at liquid electrolyte and practical device of various platinum-based catalysts. Adapted from Ref 54(Science 354, 1378-1379 (2016))...13 Figure 1.7 Brief summary of this thesis...14
Chaper 2
Figure 2.1 Schematic diagrams of the layer structure of the copper-foam flow field MEA and conventional MEA...25 Figure 2.2 Photographs of six different copper-foams (Cu 1-6)...30 Figure 2.3. Effect of copper foam thickness on the cell performance and microstructure. (a) Polarization and power density curves of three MEAs with different thicknesses (1 mm, 500 μm, and 200 μm) of copper foam (Cu 1). (b)
x
Porosity (red data) and pressure generated (blue data) in copper foams with different thicknesses...33 Figure 2.4. Microstructural characterization of the copper-foams. SEM images of samples Cu 1–4 (a–d) before and (e–h) after compression. (i) Schematic diagrams of the corresponding area densities of samples Cu 1–4...36 Figure 2.5 Effect of copper-foam area density on the cell performance. (a) Polarization and power density curves for four MEAs with different area densities of copper-foam (Cu 1, 2, 3, and 4). (b) Ohmic resistance (mΩ) obtained at 0.6 V using EIS (red data) and the sum of charge transfer and mass transport resistance (mΩ) obtained at 0.4 V using EIS (blue data) for the copper-foams (Cu 1, 2, 3, and 4) .... .... ... .... ... .... ... .... ... ... .... ... .... ... .... ... ... ... ... .... ... .... ... .... ... .. 37 Figure 2.6. (a) Equivalent circuit model and Nyquist plots of copper-foam MEAs with the different area densities (Cu 1-4). (b) 0.8 V, (c) 0.6 V, (d 0.4 V...38 Figure 2.7 SEM images of (a-c) pristine Cu 3, 5, and 6 and (d-f) compressed Cu 3, 5, and 6. The scale bar is 250 μm...40 Figure 2.8 Effect of copper-foam pore size on the cell performance. (a) Polarization and power density curves of the three MEAs with different copper- foam pore sizes (Cu 3, 5, and 6). (b) Charge transfer resistance (mΩ) obtained at 0.8 V using EIS (red data) and the sum of charge transfer and mass transport resistance (mΩ) obtained at 2.0 A∙cm-2 using EIS (blue data) for copper-foams (Cu 3, 5, and 6)...41 Figure 2.9 Nyquist plots of copper-foam MEAs with the different pore sizes (Cu 3, 5, 6). (a) 0.8 V, (b) 0.6 V, (c) 0.4 V, (d) 2.0 A·cm-2...42 Figure 2.10 Comparison of the performance of copper-foam and conventional flow field MEAs. (a) Voltage as a function of current density. (b) Cyclic voltammetry curves. (c–e) Nyquist plots obtained at (c) 0.8 V, (d) 0.6 V, and (e) 0.4 V...43 Figure 2.11Performance of optimized copper-foam flow field MEA. (a) Voltage as a function of current density of optimized copper-foam flow field MEA. (b) The
xi
comparison of current density at 0.6 V and maximum power density exhibited in this study and those reported in literature11,24-28 (Solid: ambient pressure, Open:
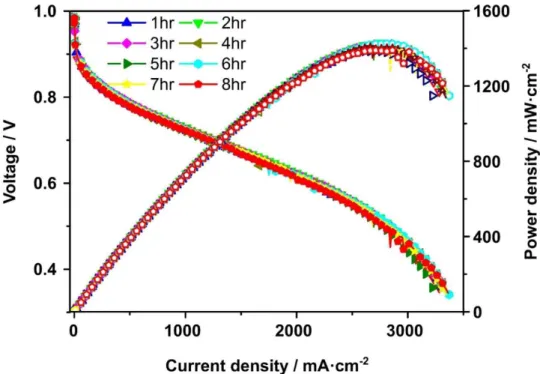
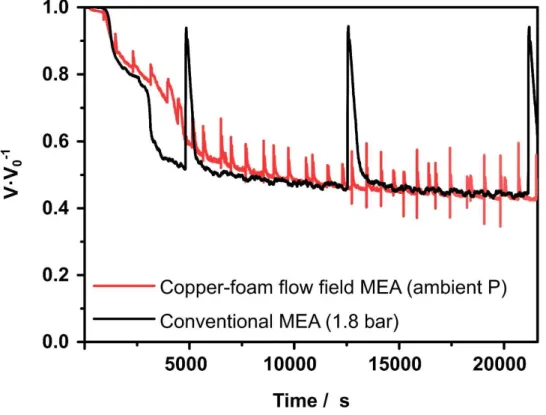
back pressure)...46 Figure 2.12 Stability test of copper-foam flow field MEA for 8 h...48 Figure 2.13 Comparison of the performance of three different flow fields (copper foam, micro flow field, and conventional flow field). (a) Photographs of the three flow fields. (b) Voltage as a function of current density at ambient pressure. (c) Voltage as a function of current density at ambient pressure (copper foam MEA), and with a back pressure of 1.8 bar (micro flow field MEA and conventional MEA)...52 Figure 2.14 CO poisoning test of copper-foam flow field MEA and conventional flow field MEA. (a) Schematic diagram of CO poisoning test and (b) normalized voltage profile of copper-foam flow field MEA and conventional flow field MEA during CO poisoning test...54 Figure 2.15 Normalized voltage profile of copper-foam MEA (ambient pressure) and conventional MEA (1.8 bar back pressure)...56
Chaper 3
Figure 3.1 Schematic diagram of the single-cell of inverse-opal MEA...66 Figure 3.2 Photographs of each step in the decal-transfer method for inverse-opal MEA...71 Figure 3.3 FE-SEM images of each step in the decal-transfer method: (a) self- assembled PS beads as template, (b) infiltration of IrO2 by using pulse electrodeposition, and (c) inverse-opal electrode. The scale bar is 1 μm...72 Figure 3.4 Polarization curves of conventional MEA before and after nitric acid treatment...73
xii
Figure 3.5 FE-SEM images of inverse-opal electrode obtained with different current of (a) 5, (b) 10, (c), 20, and (d) 30 mA. The scale bar is 5 μm and 1 μm,
respectively...75
Figure 3.6 Voltage curves of electrodes obtained with different current of (a) 5, (b) 10, (c), 20, and (d) 30 mA...76
Figure 3.7 FE-SEM images of inverse-opal electrode with variations in the total number of cycles (a) 80 k, (b) 120 k, (c) 140 k, and (d) 160 k cycles. The applied current is 10 mA. The scale bar is 5 μm...77
Figure 3.8. FE-SEM images of several inverse-opal electrodes obtained with the optimal ED conditions. The scale bar is 1 μm...79
Figure 3.9 TEM images of inverse-opal electrode...80
Figure 3.10 XRD patterns of FTO, Ni-FTO, and inverse-opal electrode...82
Figure 3.11 Ir 4f XPS spectra of IrO2 inverse-opal electrode...83
Figure 3.12 Cyclic voltammetry of inverse-opal MEA with different total cycles (80k, 120k, 140k, and 160k cycles)...84
Figure 3.13 (a) Polarisation curves of inverse-opal MEAs with differences in the total number of cycles (80 k, 120 k, 140 k, and 160 k cycles)...86
Figure 3.14 The performance changes of inverse-opal MEAs as a function of catalyst loading...87
Figure 3.15 (a) PEMWE performance, (b) Nyquist plot at 1.6 V, (c) cyclic voltammetry, and (d) measured amount of generated hydrogen in the inverse-opal MEA and conventional MEA. The catalyst loading is 0.02 mg·cm-2...88
Figure 3.16 Stability test results of the inverse-opal MEA and conventional MEA in the (a) low-voltage (1.6 V) and (b) high-voltage (1.9 V) regions over a time period spanning 1200 s...90
Figure 3.17 PEMWE performance (solid) and estimated performance by measured amount of generated hydrogen (open) of inverse-opal MEA and conventional MEA. The catalyst loading was 0.02 mg·cm-2...92
xiii
Figure 3.18. FE-SEM images of (a-c) inverse-opal electrode and (d-f) conventional electrode: (a, d) cross-sectional view, and top view (b, e) before stability test and (c, f) after stability test...93 Figure 3.19 Comparison of (a) cell performances (current density at 1.6 V) and (b) mass activities at 1.6 V achieved in the study and those reported in extant studies.
2,4-7,39,40...95
Chaper 4
Figure 4.1 Schematic diagram of single-cell components in AEMWE………....108 Figure 4.2 (a) Polarization curves and (b) Nyquist plots for AEMWE single cells with different fabrication processes: CCS without and with hot-pressing, and CCM at 50 °C. Nyquist plots were evaluated at 1.9 V. The feed condition was 1.0 KOH solution in both electrodes with flow rate of 1 ml·min-1………...111 Figure 4.3 Polarization curves of AEMWEs prepared with different hot pressing conditions (no, 30, 50, 70, and 90 °C) of CCS method...112 Figure 4.4 Polarization curves of AEMWE single cells with different fabrication processes: CCS without and with hot-pressing, and CCM...113 Figure 4.5 Photographs of thicknesses of two MEAs with different fabrication methods: (a) CCM and (b) CCS...115 Figure 4.6 (a) Polarization curves for AEMWEs operated with different reactant feed methods (1–4), and (b) cell performance of AEMWEs with different reactant flow rates (1 M KOH) fed into both sides of electrode (1, 2.5, 5, and 10 ml·min-1) at 50 °C………..116 Figure 4.7 (a) Polarization curves and (b) Nyquist plots for AEMWEs operated at different cell temperatures (50, 60, and 70 °C). Nyquist plots were evaluated at constant voltage of 1.9 V. The feed condition was 1.0 KOH solution in both electrodes with flow rate of 2.5 ml·min-1...119
xiv
Figure 4.8. (a) Polarization curves and (b) Nyquist plots for AEMWEs with different ionomer contents (10, 20, and 30 wt. %) at 50 °C, and (c) FE-SEM images of MEAs fabricated using different ionomer contents. The feed condition was 1.0 KOH solution in both electrodes with flow rate of 1 ml·min-1...120 Figure 4.9 Total resistance with different (a) Ti-GDLs (The C-GDL used was 270 μ m) a nd ( b) C -G D Ls. ( T he T i -G D L use d w as 25 0 μ m) i n N2/ N2
atmosphere...123 Figure 4.10 Polarization curves for single cells with different thickness of (a) Ti- GDLs and (b) C-GDLs at 50 °C. The feed condition was 1.0 KOH solution in both electrodes with flow rate of 1 ml·min-1………...125 Figure 4.11 (a) Equivalent circuit model and Nyquist plots of AEMWEs with different (b) Ti-GDLs and (c) C-GDLs...126 Figure 4.12 Polarization curves for AEMWEs with different IrO2 catalyst loadings (1.0, 2.0, 4.0, and 6.0 mg·cm-2) in anode at 50 °C. Cathode catalyst loading was 40 wt% with 0.4 mg·cm-2. The feed condition was 1.0 KOH solution in both electrodes with flow rate of 1 ml·min-1...127 Figure 4.13 SEM cross section images of MEAs with different anode catalyst loadings of (a) 1 (b) 2 (c) 4 and (d) 6 mg·cm-2. The scale bar represents 5 μm....129 Figure 4.14 (a) Polarization curves for AEMWEs with optimized MEA fabrication method, operating conditions, and MEA parameters at 70 °C. The feed condition was 1.0 KOH solution in both electrodes with flow rate of 2.5 ml·min-1. (b) Comparison of cell performance achieved in this study and those reported in literature.6-11,13,21...130 Figure 4.15 Comparison of cell performance in AEMWE and PEMWE with same MEA parameters and operating conditions...133
Chaper 5
xv
Figure 5.1 (a) Schematic diagram showing the preparation of the g-CN-CNF catalyst...146 Figure 5.2 (a-b) SEM images, (c) FT-IR spectra, and (d) TGA spectra of the synthesi zed g-CN...147 Figure 5.3 (a) nitrogen adsorption isotherms and (b) pore size distribution of g-CN, g-CN-CNF-800, and CNF...148 Figure 5.4 (a) XRD patterns of g-CN, g-CN-CNF-T and CNF materials. (b) Raman spectra of g-CN-CNF-T and CNF materials. N 1s XPS spectra of (c) g-CN-CNF- noHT, (d) g-CN-CNF-700, (e) g-CN-CNF-800, and (f) g-CN-CNF-900...149 Figure 5.5 (a,b) SEM images, (c) TEM image, and (d–g) EDX elemental mapping of g-CN-CNF-800 electrocatalyst...151 Figure 5.6 XPS survey spectra of g-CN-CNF-T materials...152 Figure 5.7 C 1s XPS spectra of g-CN-CNF-T materials ((a): g-CN-CNF-no, (b): g- CN-CNF-700, (c) g-CN-CNF-800, and (d) g-CN-CNF-900)...153 Figure 5.8 XPS survey spectra of g-CN-CNF-Nwt materials...156 Figure 5.9 XPS spectra of g-CN-CNF-Nwt materials: (a) C 1s and (b) N 1s of g- CN-CNF-30wt, (c) C 1s and (d) N 1s of g-CN-CNF-50wt, (e) C 1s and (f) N 1s of g-CN-CNF-70wt...157 Figure 5.10 (a) Nitrogen adsorption isotherms and (b) pore size distributions of g- CN-CNF-N wt materials...160 Figure 5.11 (a) Linear sweep voltammogram curves of (a) g-CN-CNF-T materials and (b) g-CN-CNF-Nwt materials for OER at a scanning rate of 10 mV/s with iR correction...161 Figure 5.12 (a) Schematic diagram of AEMWE single cell with g-CN-CNF-800 as the anode catalyst. (b) Polarization curves obtained for AEMWE with different anode catalyst loadings. (c) Cell performance of AEMWE with g-CN-CNF-800 and commercial IrO2. (d) The comparison of cell performances (current densities at 1.9 V) reported in literature and in this work (full symbols: non-noble metals as
xvi
O E R c a t a l y s t s , o p e n s y m b o l s : c a r b o n - b a s e d m a t e r i a l a s O E R catalyst)...163 Figure 5.13 Nyquist plots of AEMWE with g-CN-CNF-800 and IrO2 electro- catalyst obtained at 1.9 V...165 Figure 5.14 Pore size distributions of catalyst layers with g-CN-CNF-800 and IrO2
measured by mercury porosimetry...166 Figure 5.15 SEM images of MEA of AEMFCs: top view of catalyst layer of (a) g- CN-CNF-800 and (b) Pt/C. Cross-section view of MEA with (c) g-CN-CNF-800 and (d) Pt/C...167
1
Chapter 1. Introduction
Numerous studies have been conducted on the development of hydrogen energy due to the global warming and the limited reserves of fossil fuels. Hydrogen exhibits the highest energy density and is an environmentally friendly source.1-3 It is used as a fuel in fuel cells, generating electricity. Fuel cells are energy conversion devices converting chemical energy to electricity. Hydrogen can be produced by water electrolysis splitting water.
1.1. General Introduction to Polymer Electrolyte Membrane Fuel Cells
Fuel cells are power sources that directly convert chemical energy to electrical energy using hydrogen and oxygen gases. Fuel cells are classified according to the electrolyte: phosphoric fuel cells (PAFCs), solid oxide fuel cells (SOFCs), polymer electrolyte membrane fuel cells (PEMFCs), and anion exchange membrane fuel cells (AEMFCs). PEMFCs, which are the fuel cells with polymer electrolyte membrane (PEM), has been widely develoed and commercialized due to their advantages such as high power density, low operating temperature and zero emission.4,5
PEMFCs are operated as following electrochemical reactions. At anode, hydrogen is oxidized, generating the protons and electrons. The generated protons migrate into cathode through PEM. The electrons are moved to cathode through external circuit. At cathode, the oxygen is reduced with the protons and electrons, leading to the formation of water. The formed water is removed from catalyst layer to flow field.5,6
2
Anode 2H2 → 4H+ + 4e- E0 = 0.000 V Cathode O2 + 4H+ + 4e- → 2H2O E0 = 1.229 V Overall O2 + 2H2 → 2H2O Ecell = 1.299 V
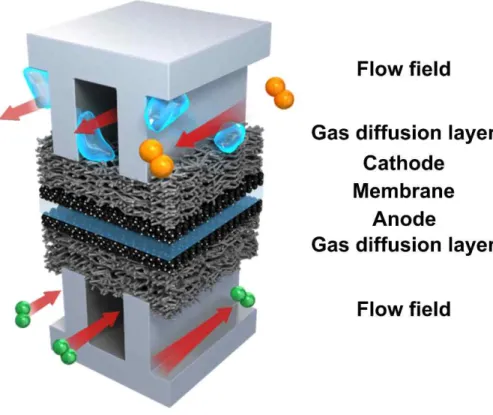
Single cell of PEMFCs consists of membrane, electrodes (anode and cathaode), gas diffusion layer (GDL), and flow fields in bipolar plates, as illustrated in Figure 1.1. Reactants (hydrogen and oxygen) are supplied through flow fields. They are transferred from the flow fields to the electrode via the GDL.
Also, the generated water in cathode is transferred from cathode to flow field thorugh the GDL.
While PEMFCs have many advantages, it has still drawbacks to be solved such as its low performance, poor durability and high cost. To improve these drawbacks, the performance enhancement is currently regarded as the major challenge.7-13 For the high performance of the PEMFCs, it is important to have a high voltage at the high current density.
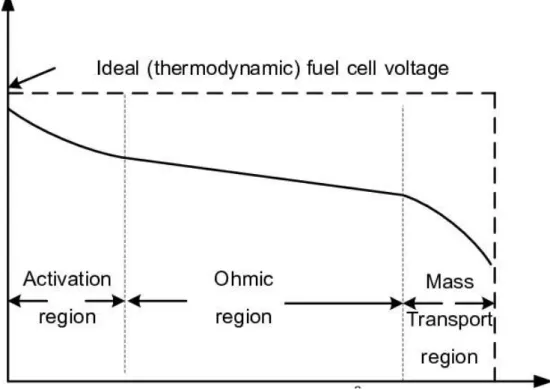
To enhance cell performance, three overpotentials need to be reduced, i.e.
activation, ohmic, and concentration overpotentials. While the theoretical voltage of PEMFCs is 1.23 V, the actual operating voltage decreases due to these three overpotentials, as shown in Figure 1.2. Firstly, the activation overpotential, which is dominant in low current density region, is associated with the catalyst kinetics, which is affected by the Gibbs free energy of the catalyst, the operation temperature, and reactant concentration.14,15 Also, the ohmic overpotential is related to electron and ion transport.16,17 Finally, the concentration overpotential occurs due to the mass transport of reactants and products.18 When operating under high current densities, the concentration overpotential dominates cell performance
3
Figure 1.1 Schematic diagram of polymer electrolyte membrane fuel cells (PEMFCs).
4
Figure 1.2 Typical I-V curve of polymer electrolyte membrane fuel cells (PEMFCs).
5
and inhibits achieving high performance PEMFCs. The improvement of mass transport can overcome the concentration overvoltage.
6
1.2. General Introduction to Polymer Electrolyte Membrane Water Electrolysis
Hydrogen can be produced renewably using a variety of methods such as steam reforming,19,20 photoproduction,21 and water electrolysis.22,23 Among these methods, water electrolysis has attracted much attention because it leads to high efficiency and the high-purity hydrogen production.22,23 When the electricity is applied to water electrolysis, water is splitted into oxygen (anode) and hydrogen (cathode) gases using the following chemical reaction. Depending on the types of electrolyte, i.e. alkaline and acidic, the water electrolysis is operated using a different mechanism.
<Alkaline>
Anode 2OH- → H2O + 2e- + 1/2O2 E0 = 1.229 V Cathode 2H2O + 2e- → 2OH- + H2 E0 = 0.000 V Overall 2H2O → 1/2O2 + H2 Eext = 1.299 V
<Acidic>
Anode H2O → 2H+ + 1/2O2 + 2e- E0 = 1.229 V Cathode 2H+ + 2e-→ H2 E0 = 0.000 V Overall 2H2O → 1/2O2 + H2 Eext = 1.229 V
Water electrolysis can be classified according to the type of electrolyte used in the device: alkaline water electrolysis and polymer electrolyte membrane water electrolysis such as proton exchange membrane water electrolysis (PEMWE) and anion exchange membrane water electrosis (AEMWE). Two main water electrolysis, i.e. alkaline water electrolysis and PEMWE are currently used.
7
AEMWE have also been developed as candidate to improve the disadvantages of two major water electrolysis methods.24,25
Alkaline water electrolysis corresponds to water electrolysis with a liquid alkaline electrolyte, which has long been commercialized.26,27 In alkaline water electrolysis, non-noble metals (Co, Cu, and Ni) were used as oxygen evolution reaction (OER) catalysts, thereby reducing the cost of water electrolysis.
Additionally, it exhibits advantages of simplicity and safety. However, the use of liquid electrolyte can lead to leakage and sensitivity to CO2, resulting in poor stability.28
PEMWE was developed in order to overcome the disadvantages of alkaline water electrolysis. Specifically, it is the water electrolysis wherein a polymer electrolyte membrane is used as an electrolyte, as shown in Figure 1.3.29 It is composed of a membrane with a thickness in the range of 20 – 100 μm, resulting in low ohmic resistance and a high performance.30,31 Additionally, it generates hydrogen with high-purity owing to the use of the solid membrane.32 Nevertheless, the commercialization of PEMWE is limited dut to the high cost of catalyst.33 As the PEMWE is operated in acidic media, novel metal catalysts including iridium- and ruthenium-based materials that exhibit activity for OER are commercially used as catalysts in the anode. Thus, the catalyst loading needs to be reduced to decrease the PEMWE cost.
AEMWE, that is, water electrolysis using an anion-exchange membrane (AEM), has been developed as an alternative to improve the drawbacks of alkaline water electrolysis and PEMWE in recent years.34,35 (Figure 1.4) AEMWE is performed in alkaline medium using non-platinum group metal (PGM) catalysts such as Ni-, Co-, and Cu-based materials as the OER catalyst, leading to cost reductions. Furthermore, like PEMWE, AEMWE produces high-purity hydrogen due to the presence of solid electrolyte. However, AEMWE shows lower
8
Figure 1.3 Schematic diagram of proton exchange membrane water electrolyzer.
Adapted from Ref 30 (J. Power Soc. 2017, 366, 33-35)
9
Figure 1.4 Schematic diagram of anion exchange membrane water electrolyzer.
10
performance and durability compared to other water electrolysis methods. Also, few studies investigating AEM and anion-exchange ionomers as well as the membrane-electrode assembly (MEA) of AEMWE have been reported. Therefore, the development of highly efficient MEA in AEMWE is important for enhancing cell performance.
Figure 1.5 presents the comparison in performance of three water electrolysis mentioned above.36 Alkaline water electrolysis shows the lowest performance due to the presence of liquid electrolyte, leading to large ohmic resistance. On the other hand, PEMWE exhibits the highest performance among the developed water electrolysis. This is because the Nafion membrane, which is employed as electrolyte, has been widely commercialized and exhibits high conductivity of protons and good stability. Also, the use of noble catalyst such as Ir, Ru, Pt-based catalyst leads to high cell performance. Despite its high performance, high cost of these materials has been still problems to be solved. Finally, the performance of AEMWE is higher than that of alkaline water electrolysis and lower than that of PEMWE. Although the membrane is also used in AEMWE, the anion exchange membrane, which is under development, still shows poor ionic conductivity and stability. Thus, the AEMWE exhibits lower performance compared to PEMWE. Further development of anion exchange membrane can be expected to enhance performance of AEMWE.
11
Figure 1.5 The comparison in performance of three water electrolysis (alkaline water electrolysis, PEMWE, and AEMWE). Adapted from Ref 37 (Meeting Abstracts 2015, MA2015-01, 1489)
12
1.3. Aim of this thesis
All electrochemical devices mentioned above are operated through oxygen electrocatalysis including ORR and OER. ORR plays a key role in determining the performance of fuel cells.10-12 By contrast, the oxygen evolution reaction (OER) is the core process in water electrolyzers.30,31 The kinetics of oxygen electrolycatalysis are sluggish, leading to low catalytic activity and thereby low performance of practical devices. Therefore, research on oxygen electrocatlayst has been widely developed.37-40
Figure 1.6 presents the comparison of ORR catalytic activity obtained in half-cell test and full-cell test (fuel cells) reported in literature.41 While the catalytic activity of ORR electrocatalysts has been sharply enhanced, their real fuel cell (full cell) performance has not captured the performance obtained in half-cell test. In addition to fuel cells, the water electrolysis exhibits the same phenomena. Few studies on practical application of OER or bifunctional catalyst have been reported although various research on these catalysts has been developed. These phenomena are ascribed to the insufficient investigation of membrane-electrode assembly in fuel cell and water electrolysis.
The development of pore strucuture in components, i.e. catalyst, catalyst layer, gas diffusion layer, and flow field, is crucial for improving the performance of practical electrochemical devices. For example, for fuel cells, the mass transport of reactant and product affects largely the cell performance.42-43 The pore structure in flow field needs to be examined to improve the mass transport, leading to the enhanced cell performance.44 In case of water electrolysis, the performance can be incrased by enhancing the utilization of catalyst or improving the mass transport.45-
46 The introduction of pore structure in catalyst layer offers the increased surface area and pathway of reactant and product.47-48
13
Figure 1.6 Comparison of ORR catalytic activity obtained at liquid electrolyte and practical device of various platinum-based catalysts. Adapted from Ref 54 (Science 2016, 354, 1378-1379)
14
The main theme of this thesis is to investigate the effect of pore structure on components of PEMFCs, PEMWE and AEMWE, as presented in Figure 1.7. To achieve high fuel cell performance, the microstuctrue of metal-foam as flow field are investigated. Also, the porous electrode with interconnected and ordered macropores is prepared as anode in polymer-exchange membrane water electrolysis to enhance the utilization of catalyst. In addition, the graphitic carbon nitride- carbon nanofiber catalyst is synthesized as OER catalyst, and applied in anion- exchange membrane water electrolysis. When it is prepared in electrode, larger secondary pores resulted in the enhanced mass transport and ionic transport.
15 Figure 1.7 Brief summary of this thesis
16
1.3. References
1. S. Dutta, A review on production, storage of hydrogen and its utilization as an energy resource, J. Ind. Eng. Chem. 2014, 20, 1148-1156.
2. J. A. Turner, A realizable renewable energy future, Science 1999, 285, 687-689.
3. J. A. Turner, Sustainable hydrogen production, Science 2004, 305, 972- 974.
4. Y. Wang, K. S. Chen, J. Mishler, S. C. Cho, X. C. Adroher, A review of polymer electrolyte membrane fuel cells: Technology, applications, and needs on fundamental research, Appl. Energy 2011, 88, 981-1007.
5. H. Zhang, P. K. Shen, Recent development of polymer electrolyte membranes for fuel cells, Chem. Rev. 2012, 112, 2780-2832.
6. S, Litster, G. McLean, PEM fuel cell electrodes, J. Power Soc. 2004, 130, 61-76.
7. D. E. Curtin, R. D. Lousenberg, T. J. Henry, P. C. Tangeman and M. E.
Tisack, Advanced materials for improved PEMFC performance and life, J. Power Soc. 2004, 131, 41-48.
8. N. Rajalakshmi, H. Ryu, M. M. Shaijumon and S. Ramaprabhu, Performance of polymer electrolyte membrane fuel cells with carbon nanotubes as oxygen reduction catalyst support material, J. Power Soc.
2005, 140, 250-257.
9. L. Xiong and A. Manthiram, High performance membrane-electrode assemblies with ultra-low Pt loading for proton exchange membrane fuel cells, Electrochim. Acta, 2005, 50, 3200-3204.
10. M. Michel, A. Taylor, R. Sekol, P. Podsiadlo, P. Ho, N. Kotov and L.
Thompson, High-performance nanostructured membrane electrode
17
assemblies for fuel cells made by layer-by-layer assembly of carbon nanocolloids, Adv. Mater., 2007, 19, 3859-3864.
11. O. H. Kim, Y. H. Cho, T. Y. Jeon, J. W. Kim, Y. H. Cho and Y. E.
Sung, Realization of both high-performance and enhanced durability of fuel cells: Pt-exoskeleton structure electrocatalysts, ACS applied materials & interfaces, 2015, 7, 14053-14063.
12. S. M. Kim, C.-Y. Ahn, Y.-H. Cho, S. Kim, W. Hwang, S. Jang, S. Shin, G. Lee, Y.-E. Sung and M. Choi, High-performance fuel cell with stretched catalyst-coated membrane: one-step formation of cracked electrode, Scientific Reports, 2016, 6, 26503.
13. A. Kongkanand, N. P. Subramanian, Y. Yu, Z. Liu, H. Igarashi and D.
A. Muller, Achieving high-power PEM fuel cell performance with an ultralow-Pt-content core–shell catalyst, ACS Catalysis, 2016, 6, 1578- 1583.
14. Ryan P. O'Hayre, Suk-won Cha, Whitney G. Colella and F. B. Prinz, Fuel Cell Fundamentals, Wiley, New York, 2008.
15. M. V. Williams, H. R. Kunz, J. M. Fenton, Analysis of polarization curves to evaluate polarization sources in hydrogen/air PEM fuel cells, J. Electrochem. Soc., 2005, 152, A635-A644.
16. T. Mennola, M. Mikkola, M. Noponen, T. Hottinen and P. Lund, Measurement of ohmic voltage losses in individual cells of a PEMFC stack, J. Power Sources, 2002, 112, 261-272.
17. J. M. Sierra, S. J. Pathiyamattom and S. Gamboa, Study of activation losses and ohmic resistance in a PEM fuel cell using computational fluid dynamics, ECS Transactions, 2009, 20, 395-405.
18. O.-H. Kim, Y.-H. Cho, S. H. Kang, H.-Y. Park, M. Kim, J. W. Lim, D.
Y. Chung, M. J. Lee, H. Choe, Y.-E. Sung, Ordered macroporous
18
platinum electrode and enhanced mass transfer in fuel cells using inverse opal structure, Nature Commun., 2013, 4, 2473.
19. A. Haryanto, S. Fernando, N. Murali, S. Adhikari, Current status of hydrogen production techniques by steam reforming of ethanol: A review, Energy & Fuels 2005, 19, 2098-2106.
20. J. Dufour, D. P. Serrano, J. L. Gálvez, J. Moreno, A. González, Hydrogen production from fossil fuels: Life cycle assessment of technologies with low greenhouse gas emissions, Energy & Fuels 2011, 25, 2194-2202.
21. D. I. Arnon, M. Losada, M. Nozaki, K. Tagawa, Photoproduction of hydrogen, photofixation of nitrogen and a unified concept of photosynthesis, Nature 1961, 190, 601.
22. K. Zeng, D. Zhang, Recent progress in alkaline water electrolysis for hydrogen production and applications, Prog. Energy Combust. Sci. 2010, 36, 307-326.
23. C. Lamy, From hydrogen production by water electrolysis to its utilization in a PEM fuel cell or in a SO fuel cell: Some considerations on the energy efficiencies, Int. J. Hydrogen Energy 2016, 41, 15415-15425.
24. M. K. Cho, A. Lim, S. Y. Lee, H.-J. Kim, S. J. Yoo, Y.-E. Sung, H. S.
Park, J. H. Jang, A review on membranes and catalysts for anion exchange membrane water electrolysis single cells, J. Electrochem. Sci. Technol.
2017, 8, 183-196.
25. I. Vincent, D. Bessarabov, Low cost hydrogen production by anion exchange membrane electrolysis: A review, Renew. Sust. Energy Rev.
2018, 81, 1690-1704.
26. K. Zeng, D. Zhang, Recent progress in alkaline water electrolysis for hydrogen production and applications, Prog. Energy Combust. Sci. 2010, 36, 307-326.
19
27. S. Marini, P. Salvi, P. Nelli, R. Pesenti, M. Villa, M. Berrettoni, G. Zangari, Y. Kiros, Advanced alkaline water electrolysis, Electrochim. Acta 2012, 82, 384-391.
28. S. Marini, P. Salvi, P. Nelli, R. Pesenti, M. Villa, M. Berrettoni, G.
Zangari, Y. Kiros, Advanced alkaline water electrolysis, Electrochimica Acta 2012, 82, 384-391.
29. Q. Feng, X.-Z. Yuan, G. Liu, B. Wei, Z. Zhang, H. Li, H. Wang, A review of proton exchange membrane water electrolysis on degradation mechanisms and mitigation strategies, J. Power Soc. 2017, 366, 33-35.
30. M. Carmo, D. L. Fritz, J. Mergel, D. Stolten, A comprehensive review on PEM water electrolysis, Int. J. Hydrogen Energy 2013, 38, 4901-4934.
31. A. H. Abdol Rahim, A. S. Tijani, S. K. Kamarudin, S. Hanapi, An overview of polymer electrolyte membrane electrolyzer for hydrogen production: Modeling and mass transport, J. Power Sources 2016, 309, 56- 65.
32. P. Millet, F. Andolfatto, R. Durand, Design and performance of a solid polymer electrolyte water electrolyzer, Int. J. Hydrogen Energy 1996, 21, 87-93.
33. S. Siracusano, V. Baglio, N. Van Dijk, L. Merlo, A.S. Aricò, Enhanced performance and durability of low catalyst loading PEM water electrolyser based on a short-side chain perfluorosulfonic ionomer, Applied Energy 2017, 192, 477-489.
34. M. K. Cho, A. Lim, S. Y. Lee, H.-J. Kim, S. J. Yoo, Y.-E. Sung, H. S.
Park, J. H. Jang, A review on membranes and catalysts for anion exchange membrane water electrolysis single cells, J. Electrochem. Sci. Technol.
2017, 8, 183-196.
20
35. I. Vincent, D. Bessarabov, Low cost hydrogen production by anion exchange membrane electrolysis: A review, Renew. Sus. Energy Rev.
2018, 81, 1690-1704.
36. M. Carmo, D. L. Fritz, W. Maier, D. Stolten, (Invited) Alkaline water electrolysis vs. PEM water electrolysis – exploring their full performance.
Meeting Abstracts 2015, MA2015-01, 1489.
37. H. N. Nong, L. Gna, E. Willinger, D. Teschner, P. Strasser, IrOx core- shell nanocatalysts for cost- and energy-efficient electrochemical water splitting, Chem. Sci. 2014, 5, 2955-2963.
38. X. Huang, Z. Zhao, L. Cao, Y. Chen, E. Zhu, Z. Ling, M. Li, A. Yan, A.
Zettl, Y. M. Wang, X. Duan, T. Mueller, Y. Huang, High-performance transition metal-doped Pt3Ni octahedral for oxygen reduction reaction, Science 2015, 348, 1230-1234.
39. J. Shui, M. Wang, F. Du, L. Dai, N-doped carbon nanomaterials are durable catlaysts for oxygen reduction reaction in acidic fuel cells, Science 2015, 1, e1400129.
40. M. Chauhan, K. P. Reddy, C. S. Gopinath, S. Deka, Copper cobalt sulfide nanosheets realizing a promising electrocatalytic oxygen evolution reaction, ACS Catal. 2017, 7, 5871-5879.
41. I. E. L. Stephens, J. Rossmeisl, I. Chorkendorff, Toward sustainable fuel cells, Science 2016, 354, 1378-1379.
42. Y. W. Rho, S. Srinivasan, Y. T. Kho, Mass transport phenomena in proton exchange membrane fuel cells using O2/He, O2/Ar, and O2/N2 mixtures Ⅱ. Theoretical Analysis, J. Electrochem. Soc. 1994, 114, 2089-2096.
21
43. J. Benziger, E. Kimball, R. Mejia-Ariza, I. Kevrekidis, Oxygen mass transport limitations at the cathode of polymer electorlyte membrane fuel cells, AIChE J. 2010, 57, 2505-2517.
44. D. K. Shin, J. H. Yoo, D. G. Kang, M. S. Kim, Effect of cell size in metal foam inserted to the air channel of polymer electrolyte membrane fuel cell for high performance, Renew. Energy 2018, 115, 663-675.
45. B. G. Pollet, The use of power ultrasound for the production of PEMFC and PEMWE catalysts and low-Pt loading and high- performing electrodes, Catal. 2019, 9, 246.
46. S. Siracusano, V. Baglio, N. V. Dijk, L. Merlo, A. S. Arico, Enhanced performance and durability of low catalyst loading in PEM water electrolyser based on a short-side chain perfluorosulfonic ionomer, Appl. Energy 2017, 192, 477-489.
47. H.-S. Oh, H. N. Nong, T. Reier, M. Gliech, P. Strasser, Oxide- supported Ir nanodendrites with high activity and durability for the oxygen evolution reaction in acid PEM water electrolyzers, Chem. Sci.
2015, 6, 3321-3328.
48. J. O. Majasan, F. Lacoviello, P. R. Shearing, D. J. Brett, Effect of microstructure of porous transport layer on performance in polymer electrolyte membrane water electrolyser, Energy Procedia 2018, 151, 111-119.
22
Chapter 2. Optimization of copper-foam micro- structures as flow field for polymer electrolyte membrane fuel cells
2.1. Introduction
To improve the mass transport of PEMFCs, the flow field of bipolar plates is important components, and various kinds of flow fields1-13 have been reported to improve mass transport leading to enhancing cell performance. Recently, porous materials, i.e. metallic powder,10 coils,7 mesh,11 and foam,4,12,13 have been applied as flow fields and have shown enhanced mass transport. Among them, metal foams are considered to be an important subject as alternative materials to channel and rib flow field structures. Reddy et al.2 initially proposed metal foam as a flow field and demonstrated a Ni-Cr structure. Tseng et al.13 developed nickel foam coated with polytetrafluoroethylene (PTFE) to increase the hydrophobicity, and achieved high performance (1.87 A·cm-2 at 0.6 V). Metal foam is hence a good candidate for achieving high performance as it can promote electrochemical reactions with the catalyst by enhancing the mass transport of reactants and products.
As flow field parameters play an important role in the mass transport of the reactants and products,2,8 many studies concerning the flow field configuration have been reported. Zhang et al.9 examined the effect of channel depth and width on cell performance and observed that these factors affected the pressure drop and under-rib convection in the channel, respectively. They reported the narrow and shallow flow field improved mass transport of oxygen and water, caused by
23
increased pressure drop. In addition, Karan et al.14 modelled the effect of the flow field parameters on the reaction distribution and concluded that the channel/rib width ratio affects the cell performance as the channel dimensions determine the oxygen transport behavior, while the rib dimensions affect electron transport.
Hence, a step toward achieving the highest performance fuel cell would be to inspect the flow field structure. Likewise, when metal foam is applied as a flow field, it is expected that the structural parameters, i.e. thickness, area density, and pore size, can affect the cell performance; therefore, the cell performance can be increased by optimizing the foam microstructure. However, few studies on regarding optimization of foam structures for flow fields of PEMFCs have been found in the literature.4,15
In this work, we used copper-foam as flow field and optimized their microstructure to determine the optimal flow field design. Copper-foam is a relatively inexpensive material, can be prepared with various structures, and has previously been shown to be a promising candidate as a flow field. Here, the effect of the foam structure (thickness, area density, and pore size) on the flow field performance was experimentally examined. In addition, a copper-foam flow field MEA with a higher catalyst loading and smaller membrane thickness was proposed to achieve outstanding high performance (current density > 2.0 A·cm-2 at 0.6 V) and mechanisms behind the enhancement of the cell performance were investigated.
Furthermore, we proposed carbon monoxide (CO) poisoning test in single cell to examine the reactant utilization of flow field and evaluated its effect of copper- foam.
24
2.2. Experimental section
2.2.1. Preparation of copper-foam flow field MEA
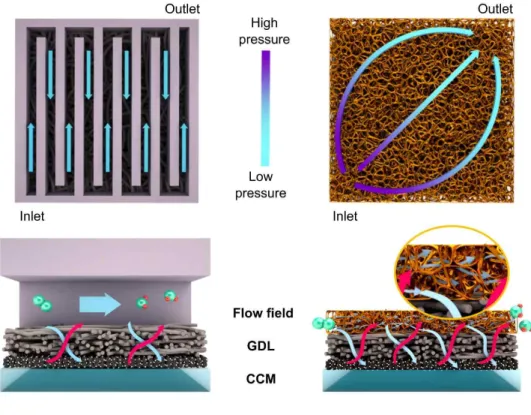
The copper-foam flow field MEA and conventional MEA (Figure 2.1) contained a CCM and GDL, while the conventional MEA comprised a serpentine flow field that has been widely used due to its excellent water removal and the copper-foam flow field MEA consisted of a compressed copper-foam flow field.
To prepare the copper-foam flow field, the copper-foam was compressed using hot- pressing equipment (HMM-04, Hansung Systems, Inc., Korea) under ambient temperature to prepare samples with different thicknesses. The compressed copper- foams were placed on the bipolar plates without channels and ribs, followed by an in-house method of porous flow field.
Six samples of copper-foam were applied as the flow field of bipolar plates to investigate the optimized copper-foam structure, as shown in Figure 2.2. To characterize the effect of the foam microstructure on the cell performance, two groups of samples were prepared with different area densities (Cu 1, 2, 3 and 4) and pore sizes (Cu 3, 5 and 6). Table 2.1 presents the parameters of copper-foams.
The procedures for fabricating the CCMs, as reported in our previous studies,16,17 were used for MEA preparation. The catalyst slurry was made by dispersing the catalyst in a solution of 2-propanol (Sigma Aldrich, USA) and Nafion perfluorinated resin (Sigma Aldrich, USA) under sonication. Carbon- supported Pt catalyst (40 wt. %, Johnson Matthey) was used as the anode and cathode catalysts. Nafion 212 (Dupont, USA) was used as the proton exchange membrane; before fabrication, the membrane was cleaned with 1 M hydrogen peroxide (Daejung Chemicals & Metals Co., Ltd., Korea) at 80 °C for 1 h, and then rinsed with deionized water for 1 h. Next, the membrane was immersed in 0.5 M sulfonic acid (Samchun Chemical, Korea) at 80 °C for 1 h for protonation, and rinsed deionized water. Then, the prepared catalyst ink was sprayed directly onto
25
Figure 2.1. Schematic diagrams of the layer structure of the copper-foam flow field MEA and conventional MEA.
26
the membrane. The catalyst loading was 0.2 mgPt·cm-2. After drying the CCM at room temperature, the GDL was attached to both sides of the CCM.
2.2.2. Physical characterization of the copper-foam
Field-emission scanning electron microscopy (FE-SEM; Carl Zeiss SUPRA 55VP) was used to observe the in-plane and through-plane pore morphology of the copper-foams. The porosity of the copper-foams was measured by mercury intrusion porosimetry (AutoPore IV 9500, Micromeritics, USA). The electrical resistance of the copper-foams was obtained by measuring the sheet resistance (CMT-SR1000N, Gobizkorea, Korea). To compare the hydrophobicity of copper- foam and the conventional flow field, their contact angles were measured using a contact-angle analyzer (Phoenix 300, Surface Electro Optics, Korea).
2.2.3. Electrochemical characterization of copper-foam flow field MEA
In order to evaluate the MEA performance, single-cell polarization curves were obtained using a PEMFC test station (CNL Energy) with an active area of 5 cm2 and a constant cell temperature of 70 °C. Hydrogen and air were supplied to the anode and cathode, respectively, and the relative humidity (RH) of the reactants was 100%. The tests were performed at ambient pressure. EIS (IM-6, Zahner- Elektrik GmbH & Co. KG, Germany) was used to measure the resistances of the single-cells under the same operating conditions. The EIS method is a diagnostic tool to separate the activation, ohmic, and concentration resistances under PEMFC operating conditions.18 The EIS measurements were performed at 0.8, 0.6, and 0.4 V with 5 mV amplitude over the frequency range of 100 kHz to 100 mHz. CV was used to obtain the ECSA of the cathode catalyst layer at a constant cell temperature of 30 °C. Hydrogen and nitrogen were fed to the anode and cathode, respectively.
The voltage sweep range was 0.05 to 1.2 V and the scan rate was 100 mV·s-1.
27
CO poisoning test in single-cell was used to examine the effect of the flow field design on reactant utilization. Two kinds of fuel were supplied for anode: (1) pure hydrogen and (2) 100 ppm CO balanced hydrogen. The flow rate was 50 ml·min-1 for anode. The oxygen was supplied for cathode. Before CO poisoning test, single- cell was applied at constant current of 100 mA·cm-2 supplying pure hydrogen into the anode for 10 min. Then, CO balanced hydrogen gas was injected in anode and voltage change was measured for 6 h while maintaining the current.
28
2.3. Results and Discussion
2.3.1. Physical property of copper-foam
Copper-foam is a three-dimensionally porous material that has large interconnected pores (100–1500 μm), high porosity, and high electrical conductivity. Table 2.1 compares the physical properties of copper-foam and a conventional (graphite) flow field. Copper has been a typical conductive material used for wire coil for excellent electrical conductivity, and it was confirmed that copper-foam structure also has high electric conductivity. The specific resistance of the copper-foam was smaller than that of the conventional flow field, indicating a higher electrical conductivity. In addition, the contact angles of copper-foam and the conventional flow field were 114.7° and 58.7°, respectively. The large contact angle of the copper-foam means that the material has high hydrophobicity.19 Thus, copper-foam can be applied as a flow field without additional hydrophobic treatment process, which enhanced water removal. Figure 2.2 and Table 2.2 presents the photographs and parameters of six different copper-foams used in this study.
2.3.2. Effect of copper-foam thickness
The channel depth of flow fields is regarded as an important parameter for cell performance.9,20,21 The thickness of the copper-foam is associated with the channel depth of the flow fields and hence, three types of MEA with different copper-foam thicknesses were prepared and the effect of foam thickness was compared to conventional flow with a depth of 1.0 mm fields (serpentine flow field). Most studies of metal foam flow fields4,13 performed experiments with single-cells with a foam thickness similar to that of conventional channel depths.
Therefore, we used thin copper-foam (< 1 mm) for the flow fields for cell testing as
29
Table 2.1. Specific resistance (mΩ·cm) and contact angle (°) of copper-foam and conventional flow field.
Copper-foam Conventional flow field (Graphite) Specific resistance
(mΩ·cm) 0.05 1
Contact angle (°) 114.7 58.7
30
Figure 2.2. Photographs of six different copper-foams (Cu 1-6).
31 Table 2.2. Copper-foam parameters.
Samples Cu 1 Cu 2 Cu 3 Cu 4 Cu 5 Cu 6
Pore size (μm) 450 450 450 450 580 1200
Area density (g·m-2 ) 600 800 1000 1400 1000 1000
32
Zhang et al.9 reported that shallower channels increased the pressure drop, promoting water removal.
Figure 2.3 shows the polarization and power density curves of the three MEAs using Cu 1 (pore size of 450 μm and area density of 600 g·m-2) with different copper-foam thicknesses (1 mm, 500, and 250 μm). As the thickness of the copper-foam decreased, the cell performance was enhanced over the measured current density range. In addition, we found that the MEA with the thinner copper- foams (250 and 500 μm) generated internal pressure in the flow field (measured using a system built in-house, as shown in Table 2.3 and Figure 2.3b). When the flow rate was constant, the reduced thickness resulted in a decrease in the volume flow of the reactant, leading to increased internal pressure. The generated pressure in the copper-foams reduced the activation overpotential and increased cell performance without requiring back pressure regulation.22,23 However, copper-foam with thickness of less than 250 μm can resulted in the blockage of in-plane pores owing to compression, exhibiting the reduced performance. Also, internal pressure becomes larger than the supply pressure, so that it becomes hard to supply the reactant. Therefore, the cell performance of copper-foam flow field MEAs was enhanced as the thickness decreased; as we have seen, since the optimum thickness was found to be 250 μm, the following experiments in this paper were conducted using a 250 μm foam.
2.3.3. Effect of area density of copper-foam
The conventional flow field in a bipolar plate transports reactants and generated water through the channel and provides an electrical connection through the ribs. To minimize the ohmic resistance of the copper-foam flow field MEA, the ribs should have a low intrinsic electrical conductivity and large contact area between the gas diffusion layer (GDL) and flow field. Nevertheless, as the ribs
33
Figure 2.3. Effect of copper foam thickness on the cell performance and microstructure. (a) Polarization and power density curves of three MEAs with different thicknesses (1 mm, 500 μm, and 200 μm) of copper foam (Cu 1). (b) Porosity (red data) and pressure generated (blue data) in copper foams with different thicknesses.
34
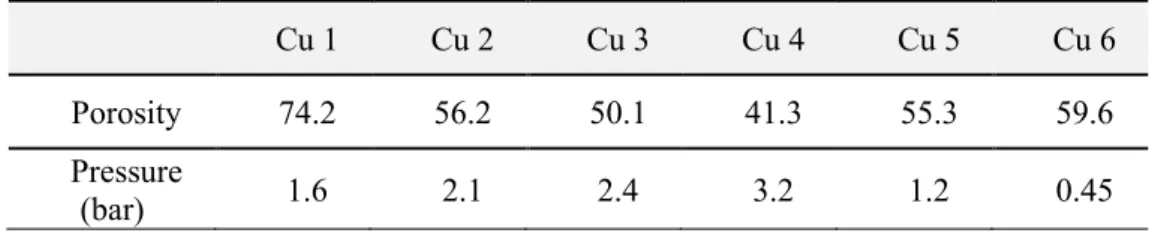
Table 2.3 Porosity of compressed copper-foams (250 μm) and pressure generated in copper-foam flow field MEAs.
Cu 1 Cu 2 Cu 3 Cu 4 Cu 5 Cu 6
Porosity 74.2 56.2 50.1 41.3 55.3 59.6
Pressure
(bar) 1.6 2.1 2.4 3.2 1.2 0.45
35
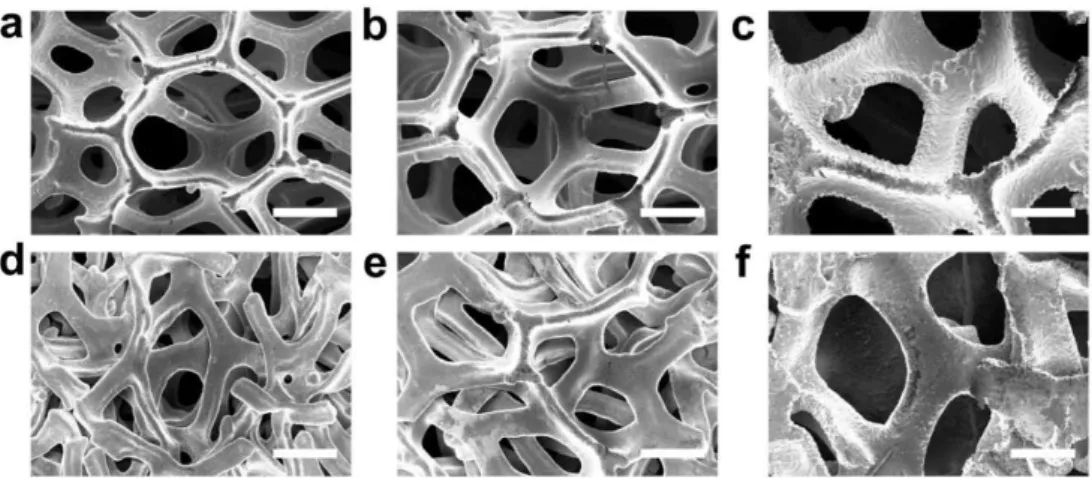
have a large contact area, the channels occupy a relatively small portion of the flow field, leading to restricted mass transport of the reactant and product. Therefore, the channel-rib ratio must be optimized to achieve a trade-off between the ohmic and mass transport resistances. In the copper-foam, the area density (mass per unit area) can be considered as the channel-rib ratio of the flow field. Figure 2.4 presents scanning electron microscope (SEM) images and a schematic diagram of the copper-foams with different area densities. Both pristine (Figure 2.4a–d) and compressed (Figure 2.4e–h) copper-foams showed through-plane pores and the rib size increased with increasing area density. A higher area density of copper-foam resulted in a lower channel-rib ratio of the conventional flow field, as shown in Figure 2.4i.
To observe the effect of area density on the polarization characteristics, four copper-foams with different area densities of 600 (Cu 1), 800 (Cu 2), 1000 (Cu 3), and 1400 (Cu 4) g·m-2, respectively, but the same pore size of 450 μm and thickness of 250 μm, were prepared (Table 2.1). Figure 2.5a compares the cell performance of the four different copper-foam flow field MEAs. The area density of copper-foam increased from 600 to 1000 g·m-2 result in an increase of cell performance. As the area density increased, the contact area (rib) between the GDL and flow field increased, resulting in improved electron transport and decreased ohmic overpotential (Figure 2.5b and Figure 2.6). Also, as shown in Table 2.3, the increased area density led to increased pressure. It affected the activation overpotential, enhancing cell performance (Figure 2.6a). However, as mentioned above, the cell performance and area density of copper-foam did not constantly showe a linear relation between them. Although the internal pressure increased, increasing the area density from 1000 to 1400 g·m-2 resulted in decreased cell performance; the reduction in the channel area hindered mass transport of the
36
Figure 2.4. Microstructural characterization of the copper-foams. SEM images of samples Cu 1–4 (a–d) before and (e–h) after compression. (i) Schematic diagrams of the corresponding area densities of samples Cu 1–4.
37
Figure 2.5. Effect of copper-foam area density on the cell performance. (a) Polarization and power density curves for four MEAs with different area densities of copper-foam (Cu 1, 2, 3, and 4). (b) Ohmic resistance (mΩ) obtained at 0.6 V using EIS (red data) and the sum of charge transfer and mass transport resistance (mΩ) obtained at 0.4 V using EIS (blue data) for the copper-foams (Cu 1, 2, 3, and 4).
38
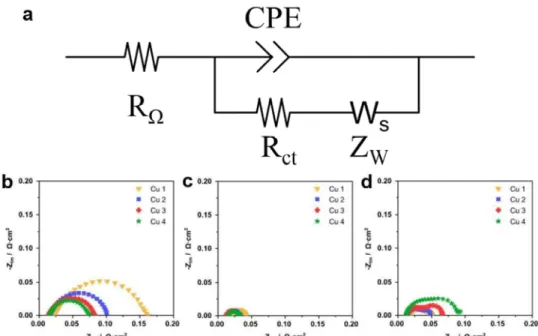
Figure 2.6. (a) Equivalent circuit model and Nyquist plots of copper-foam MEAs with the different area densities (Cu 1-4). (b) 0.8 V, (c) 0.6 V, (d 0.4 V.
39
reactant and product resulting in higher mass transport resistance (Figure 2.5b and Figure 2.6c). Although the ohmic resistance of MEAs using Cu 4 was smaller than that of the other MEAs, the increased mass transport resistance was the major factor affecting cell performance. Therefore, an area density of 1000 g·m-2 (Cu 3) was considered optimal value.
2.3.4. Effect of pore size of copper-foam
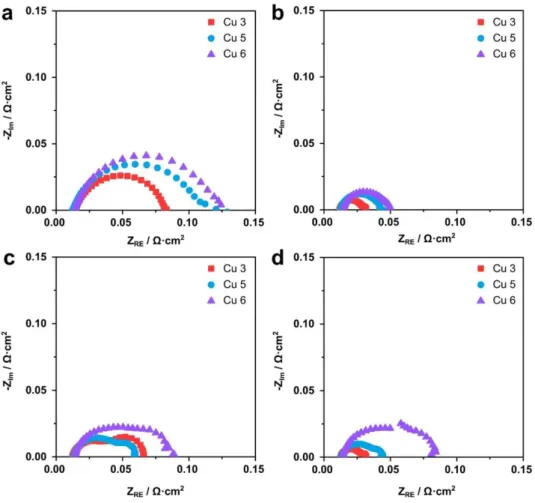
The effect of the pore size of copper-foams was investigated for samples with the optimized area density of 1000 g·m-2. The pore sizes of three samples were 450 (Cu 3), 580 (Cu 5), and 1200 μm (Cu 6), respectively (Table 2.1), where their pore morphology is shown in Figure 2.7. After compressing the foam plates to 250 μm, through-plane pores were still observed. Figure 2.8a shows the cell performance of MEAs with different pore sizes. As the area density of the three MEAs was equal, the ohmic resistances were constant, eliminating the effect of the ohmic overpotential (Figure 2.9b). As shown in Figure 2.8a, the cell performance decreased with increasing pore size due to increased charge-transfer resistance (Figure 2.9a) caused by reduced internal pressure (Table 2.3) and mass transport resistance (Figure 2.8b and Figure 2.9d). As the pore size of the foam is large, the internal surface area is reduced. And the reduction of internal surface area leads to a decrease in the form drag, thereby reducing pressure change.
2.3.5. Optimized cell performance of copper-foam flow field MEAs
Sample Cu 3 was considered to have the optimal structure as it exhibited the highest cell performance. Figure 2.10 compares cell performance of this sample and a conventional flow field MEA. Except the flow field, all cell components and operating condition of two MEAs were same. In the measured current density range, the performance of the copper-foam flow field MEA was higher than that of
40
Figure 2.7. SEM images of (a-c) pristine Cu 3, 5, and 6 and (d-f) compressed Cu 3, 5, and 6. The scale bar is 250 μm.