저작자표시-비영리-변경금지 2.0 대한민국 이용자는 아래의 조건을 따르는 경우에 한하여 자유롭게
l 이 저작물을 복제, 배포, 전송, 전시, 공연 및 방송할 수 있습니다. 다음과 같은 조건을 따라야 합니다:
l 귀하는, 이 저작물의 재이용이나 배포의 경우, 이 저작물에 적용된 이용허락조건 을 명확하게 나타내어야 합니다.
l 저작권자로부터 별도의 허가를 받으면 이러한 조건들은 적용되지 않습니다.
저작권법에 따른 이용자의 권리는 위의 내용에 의하여 영향을 받지 않습니다. 이것은 이용허락규약(Legal Code)을 이해하기 쉽게 요약한 것입니다.
Disclaimer
저작자표시. 귀하는 원저작자를 표시하여야 합니다.
비영리. 귀하는 이 저작물을 영리 목적으로 이용할 수 없습니다.
변경금지. 귀하는 이 저작물을 개작, 변형 또는 가공할 수 없습니다.
이학석사학위논문
Improving the performance and reliability of single drop microextraction
in-line coupled with capillary electrophoresis
모세관 전기영동기법과 인라인으로 연동한 단일 방울 미세추출법의 성능과 신뢰성 개선
2021년 8월
서울대학교 대학원 화학부 분석화학전공
Joseph Echevere Valdez
Improving the performance and reliability of single drop
microextraction
in-line coupled with capillary electrophoresis
모세관 전기영동기법과 인라인으로 연동한 단일 방울 미세추출법의 성능과 신뢰성 개선
지도교수 정두수
이 논문을 이학석사 학위논문으로 제출함 2021 년 8 월
서울대학교 대학원 화학부 분석화학전공 Joseph Echevere Valdez ( 조셉 )
조셉의 이학석사 학위논문을 인준함 2021 년 6 월
위원장
부위원장
위원
Abstract
Improving the performance and reliability of
single drop microextraction in-line coupled with capillary electrophoresis
Joseph Echevere Valdeza Analytical Chemistry, School of Chemistry
The Graduate School Seoul National University
A high-performance version of inline, three-phase direct immersion- single drop microextraction (DI-SDME) coupled with capillary electrophoresis (CE) was demonstrated using a commercial CE instrument, and all the major and minor details were described to provide an easy-to-follow and user-friendly protocol. The excellent sample cleanup and enrichment power of this method was demonstrated with nonsteroidal anti-inflammatory drugs (NSAIDs) in human urine. The only preparation of urine samples was the addition of HCl to acidify the urine sample to pH 2. The acidic NSAIDs in the acidified urine sample were extracted into a basic acceptor drop covered with a thin organic layer attached to the inlet tip of a capillary immersed in the sample. A simple but powerful DI-SDME-CE method could be carried out automatically without any modification of the existing CE instrument.
a The author of this thesis is a Global Korea Scholarship scholar sponsored by the Korean Government.
For improved performance, sample agitation and heating were employed by installing a microstirrer and a thermostating jacket in the sample tray.
With 10 min of DI-SDME at 35°C with stirring, NSAIDs such as ketoprofen, ibuprofen, and naproxen in urine were enriched 340–970- fold, and the limits of detection obtained with inline coupled CE/UV were 10–50 nM (2–10 µg/L). The performance of DI-SDME-CE/UV was also demonstrated by determining the naproxen level in human urine collected 24 h after taking a single oral dose of the drug. Our high- performance three-phase DI-SDME-CE method is quite promising for the analysis of ionizable trace analytes in a complex sample matrix.
Keywords:
Capillary electrophoresis · Nonsteroidal anti-inflammatory drugs · Urine
· Sample pretreatment · High performance single drop microextraction
Student Number: 2019 – 28014
CONTENTS
ABSTRACT i
CONTENTS iii
LIST OF FIGURES iv
LIST OF TABLES v
1. INTRODUCTION 1
2. THEORY 4
2.1. Sample enrichment and clean-up by three-phase
DI-SDME 4
2.2. Drop volume estimation 6
3.EXPERIMENTAL SECTION 9
3.1. Chemicals 9
3.2. CE 10
3.3. Three-phase DI-SDME-CE process 11
4. RESULTS AND DISCUSSION 16
4.1. Optimization of high performance three-phase DI-
SDME 16
4.2. Analytical performance of high performance three- phase DI-SDME CE
26
4.3. Application to human urine samples 29
5. CONCLUSIONS 34
REFERENCES 35
ABSTRACT IN KOREAN 38
LIST OF FIGURES
Figure 1. The graphical representation of the acceptor phase and the octanol layer
6
Figure 2. Single drop formation 14
Figure 3. Microstirrer and thersmostating jacket
assembly 15
Figure 4. Optimum drop location for three-phase DI- SDME-CE with stirring
17
Figure 5. Effect of the organic phase volume 18 Figure 6. Effect of the acceptor phase volume 20 Figure 7. Effect of the extraction time 22 Figure 8. Effect of the extraction temperature 23 Figure 9. Effect of the sample agitation 25 Figure 10. Electropherograms obtained from
CE and DI-SDME-CE for standard and spiked urine 1
27
Figure 11. Electropherograms obtained from CE and DI-SDME-CE for urine 2
32
LIST OF TABLES
Table 1. Analytical high performance of three-phase DI- SDME in standard sample solution (with stirring)
28
Table 2. The high-performance of three-phase DI-SDME in spiked urine 1 (with stirring)
33
1. Introduction
Single drop microextraction (SDME) is a powerful liquid phase microextraction technique. As a miniaturized form of the liquid phase extraction, SDME consumes much smaller amounts of organic solvents and is exemplified for its quite rapid extraction time, low cost, simplicity, and increasingly wide applications in food, biological, pharmaceutical, agricultural, clinical, and forensic analyses [1-10]. Two-phase direct immersion (DI)-SDME is commonly carried out by creating an organic acceptor drop of a few µL at the tip of a microsyringe needle to extract analytes from an aqueous sample [11]. In three-phase DI-SDME, analytes from an aqueous sample are extracted into an organic phase placed on top of the sample and then back-extracted into an aqueous acceptor drop [12-14]. A great number of reports employing these conventional SDME techniques for sample pretreatment have been published. Nevertheless, these SDME protocols were coupled with LC [15-20] or GC [3, 10, 21-24], mostly in off-line modes requiring significant amounts of manual efforts and time.
In 2004, a high-performance version of three-phase DI-SDME in-line (or on-line) coupled with capillary electrophoresis (CE) was demonstrated. By manually controlling an in-house CE setup, a few- nanoliter acceptor drop of high-pH run buffer covered with a thin organic layer was formed at the inlet tip of a separation capillary immersed in a low-pH sample solution of acidic analytes. Owing to the thin organic layer and the small acceptor volume, this unconventional SDME method obtained quite high enrichment factors, up to several hundred times, in
just 10 min [25]. Then by employing commercial CE instruments, SDME was made more accessible. 2-Phase SDME-CE was demonstrated using a pentanol acceptor drop and nonaqueous CE with a methanol run buffer.
For fully automated 3-phase SDME-CE operations, the surface of a capillary inlet tip was hydrophobically coated to enhance the attachment of the organic layer to the capillary tip, thus withstanding the abrupt motions of the sample trays of a commercial CE instrument [26].
Over the years, synergistic combinations of our SDME method with online (after injection) sample preconcentration techniques and/or pairing with a more sensitive detection method such as mass spectrometry and laser-induced fluorescence further proved its impressive sample cleanup and preconcentration power for sensitively and selectively analyzing various analytes in complex matrices [2, 25- 33]. However, only a modest number of reports adopting our SDME methods were published by other researchers [34, 35]. An apparent reason seems to be the limited details on the successful implementation procedures described in our reports.
Herein, all the major and minor details of 3-phase DI-SDME- CE are described with the aim of providing an easy-to-follow and user- friendly protocol. In particular, the conditioning of the inlet tip surface prior to coating and the proper coating procedures to improve the acceptor drop stability are described in detail. Furthermore, an efficient rinsing protocol to preserve the integrity of the coating and to prevent the build-up of coating debris at the inlet is given. In addition, a convenient way of estimating the volumes of the acceptor drop and the organic layer
enclosing the drop using the oblate spheroid volume formula instead of the commonly used Poiseuille equation is shown. By using the formula, up to 70% increased precision and accuracy were achieved compared with our previous works [25, 26, 28].
The performance of our updated SDME-CE method was demonstrated by analyzing nonsteroidal anti-inflammatory drugs (NSAIDs) such as ibuprofen (IBU), naproxen (NAP) and ketoprofen (KTP) in human urine. These popular over-the-counter medications, although proven to be safe and effective, may cause adverse side effects from prolonged use or overdose [36, 37]. Recently, concerns have been raised regarding the possibility of NSAIDs not only masking the symptoms related to and thus obstructing temperature screening of COVID-19 patients but also increasing the risk of adverse effects when administered to patients with acute viral respiratory infections, including COVID-19 [38, 39]. Hence, easy but sensitive methods to monitor NSAID levels are in demand.
2. Theory
2.1. Sample enrichment and clean-up by three-phase DI- SDME
The sensitivity of determining NSAIDs in a complex biological sample such as urine can be improved by enhancing the detector signals and lowering the noise. In the 3-phase SDME of an ionizable analyte from an aqueous donor phase (d) to an aqueous acceptor drop (a) through an organic phase (o), the donor pH and the acceptor pH are adjusted to promote the neutral and ionized forms of the analyte, respectively. Then, the analytes with proper ionization properties are selectively preconcentrated (enhanced detector signal) into the acceptor phase by the driving force of the pH difference, while the inorganic ions in the matrix are blocked (lowered noise) by the organic phase. At equilibrium after a long extraction time, the enrichment factor (EF) of an analyte, defined as the ratio of the analyte concentration in the acceptor phase to its initial concentration in the donor phase, is given by [5]
EFeq = 1
D2 D1
( )
+(
D2Vo Vd)
+(
Va Vd)
, (1)where V is the volume of the respective phase denoted by the subscript and D1 = Co/Cd and D2 = Co/Ca are the distribution coefficients, with Cd, Co, and Ca being the equilibrium analytical concentrations of the analyte in the phases denoted by the subscripts. A higher EFeq is obtained as D2
becomes less than D1 (D2 << D1), Vo becomes less than Vd (Vo << Vd), and the maximum EFeq will be given by the volume ratio between the donor and acceptor phases:
EFeqmax =Vd Va (2) If the extraction time t is short, EF should be proportional to the surface- to-volume ratio of the acceptor phase with the surface area Aa [27]:
EF(t)µ
(
Aa Va)
t (3)Therefore, a high EF is expected when D2 << D1, Vo << Vd, and Va is small, thus having a large Aa Va value.
Since the NSAIDs in this study, namely, KTP, IBU, and NAP, are weakly acidic (pKa 4.2–4.4) [40], the first condition of D2 << D1 can be obtained by acidifying the sample donor solution (pH 2) to convert the acidic analytes into their neutral forms and by using the basic run buffer (pH 9.8) as an acceptor phase to capture the analytes in the ionized form, with the additional advantage of simple operation. Both the second condition of Vo << Vd and the third condition of a large Aa Vavalue can be satisfied by using an acceptor drop of a few-nanoliter volume covered with a thin organic layer [26]. 1-Octanol was chosen as the organic layer, as reported in numerous previous SDME studies [15, 28, 30, 31, 41, 42].
Even when the extraction is carried out for a finite time, a higher EF will be obtained with a small-volume organic layer owing to the reduced amounts of analytes in the organic layer and the increased speed of transfer from the donor phase to the acceptor phase. In addition, by forming a two-layer acceptor drop at the capillary inlet tip, 3-phase SDME and CE were in-line coupled to make the whole process efficient and automatic.
2.2. Drop volume estimation
The volumes of the organic and acceptor phases are among the important major parameters in high performance three-phase DI-SDME.
Although the liquid volumes in CE are commonly controlled by applying pressures guided by the Poiseuille equation, it is rather unreliable to use the Poiseuille equation for small volumes in the nanoliter range as in the current SDME. It is because of the limited accuracy and precision of the pressure control unit of a CE instrument and the additional forces from the surface tensions on the layered drop. Therefore, the volume of each phase was estimated from the 2D image of a layered drop.
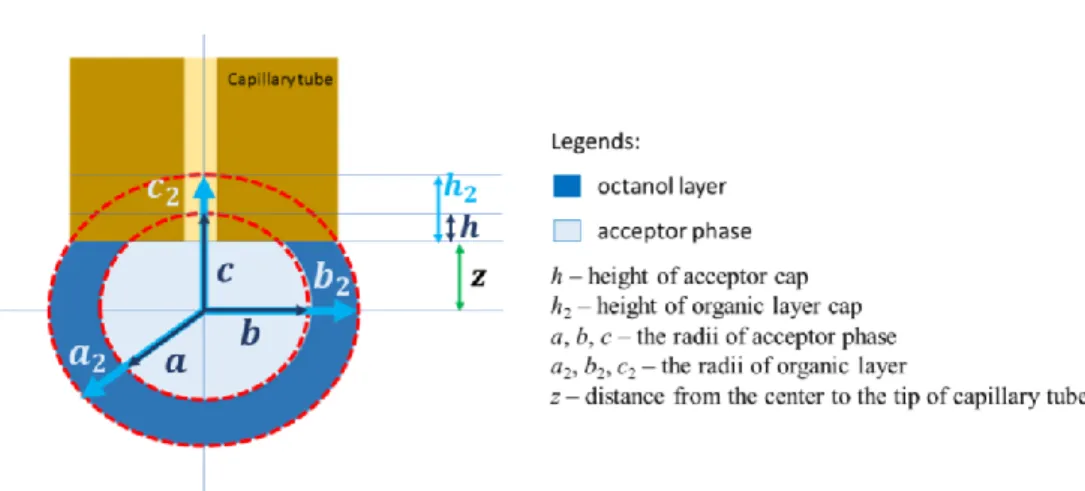
In our two-layered drop, there are two symmetric and concentric oblate spheroids created by the acceptor phase and the octanol layer (Fig.
1).
Figure 1: Graphical representation of the acceptor phase and the octanol layer
The inner spheroid is the acceptor phase with radii a, b and c. The bigger spheroid concentric with smaller sphere also has 3 radii a2, b2 and c2. On both spheroids, a = b > c. With the assumption that these two spheroids
are symmetric and concentric, their centers are at equidistant z from the tip of the capillary tube. Extending the lines to complete the spheroids, we can see the ‘cap’ of each with height, h and h2, for the acceptor phase and octanol layers, respectively.The value of h can be determined by h
= c – z. From the known diameter of the capillary tube (360 μm) the length of a, b, c, z, and h, were determined in μm. Since the spheroids are cylindrically symmetric (a = b), the total volume is:
(4) The volume of the cap of the oblate spheroid is also expressed in:
(5)
To determine the volume of the remaining drop we simply subtract the volume of the cap from the total volume of the drop.
(6)
Simplifying the equation further, we have the formula for the volume of the drop which is:
Vdrop =p
3a2c 4-3 h c æ èç
ö ø÷
2
+ h c æ èç
ö ø÷
ì 3
íï îï
üý ï þï,
(7)
substituting the value of h = c – z, we can express Eq. 7 as,
, simplifying expression further,
(8)
(9) It should be noted that z and z2 can be different when the two-layer drop is not perfectly symmetric.
Using these derived equations Eq. 8 and Eq. 9, the volume of the acceptor and the volume of the octanol layer was conveniently and directly estimated.
3. EXPERIMENTAL SECTION 3.1. Chemicals
KTP, NAP, IBU, 1-octanol, sodium tetraborate decahydrate, creatinine, and ethanol were purchased from Sigma-Aldrich (St. Louis, MO, USA). Methanol, NaOH, KOH, and HCl were purchased from Daejung Chemicals (Siheung, Korea). Hippuric acid and octadecyltrimethoxysilane (ODTS) were purchased from Tokyo Chemical Industry (Tokyo, Japan), and acetic acid was purchased from Merck (Darmstadt, Germany). Water was prepared with a LabTower EDI water purification unit (Thermo Scientific, Langenselbold, Germany).
Individual stock solutions of 5 mM KTP, IBU, and NAP were prepared in methanol and kept in the dark at 4°C for a maximum of 1 week. Standard solutions for CE were prepared by diluting the stock solutions with water. Standard sample donor solutions for SDME-CE were prepared by diluting the stock solutions with water and adjusting their pH to 2 with 1 M HCl. After comparing 60–100 mM sodium tetraborate decahydrate buffers titrated with 1 M NaOH to pH 9.2–10.5, 80 mM sodium tetraborate buffer with a pH of 9.8 was chosen as the run buffer for CE, which was prepared on a daily basis. All buffer solutions were filtered through a 0.45-µm PTFE-H syringe filter (Hyundai Micro, Seoul, Korea). Together with water and NaOH solutions, this solution was degassed daily before use.
Morning urine samples from a healthy volunteer collected before taking NAP (urine 1) and 24 h after taking a single oral dose of
NAP (urine 2) were frozen at –20°C. Before use, the undiluted urine samples were thawed at room temperature. Urine samples were not filtered, but they were shaken before analysis.
3.2. CE
CE was performed on a PACE MDQ CE system (SCIEX, Fullerton, CA, USA) equipped with an absorbance detector consisting of a deuterium lamp and an interference filter selecting a single wavelength with a full width at half maximum of 10 nm. A new fused silica capillary (Molex, Lisle, IL, USA) with an inner diameter of 50 µm, an outer diameter of 360 µm, and a total length of 60 cm (50 cm to the detector) was cut perpendicularly to the capillary axis with a ceramic cutter and polished with sandpaper to free the inlet surface from any irregularities.
Then, the surface was polished against the flat surface of the ceramic cutter to make it smooth (Figs. 2a and 2b). These precautions were taken to improve the stability of the acceptor drop attached to the capillary inlet tip. While polishing the inlet surface, it was necessary to flush the capillary backward with water occasionally using a syringe connected with a Luer adaptor (Supelco, Bellefonte, PA, USA) to prevent debris from clogging the capillary. The new capillary was installed into the CE instrument and conditioned with 1 M NaOH for 60 min, water for 5 min, and run buffer for 30 min at 60 psi. Between runs, the capillary was rinsed with 0.1 M NaOH for 10 min, water for 5 min, and run buffer for 10 min at 60 psi. Samples were injected hydrodynamically at 0.3 psi for 5 s. For electrophoretic separation, a voltage of 20 kV was applied across
the capillary at 25°C, and the analytes were monitored by their absorbance at 214 nm.
3.3. Three-Phase DI-SDME-CE process
A solution for coating the end surface of the capillary inlet tip was prepared every day as reported previously [26] with a few modifications by mixing 455 µL of ethanol, 20 µL of 2.5 vol% acetic acid in ethanol, and 30 µL of ODTS. The coating solution was cured for 40 min in an oven at 100°C. Before coating the inlet tip surface, the capillary was rinsed with 0.1 M NaOH for 10 min, water for 5 min, and run buffer for 10 min by applying a backpressure of 60 psi. It was important that the capillary was filled with run buffer prior to coating to prevent the coating solution from entering the capillary. Then, 25 µL of the cured coating solution was dispensed on filter paper, the capillary inlet tip was briefly tapped into the coating solution 3 times, and it was left to dry for 5 min. This coating made the surface of the inlet tip hydrophobic to enhance the attachment of the organic layer to the tip surface. Fig. 2c shows the coated inlet tip surface. The capillary was rinsed backward again with run buffer for 0.8 min by applying a backpressure of 60 psi, and an appropriate volume of octanol as the organic phase was injected hydrodynamically in the forward direction.
Subsequently, the capillary inlet was transferred to a sample vial, and a backpressure of 0.7 psi was applied to form an acceptor drop of run buffer covered with a thin octanol layer on the capillary inlet tip (Figs.
2d and 2e). The basic run buffer was used as the acceptor phase for convenience, but other acceptor phases of pH higher than the acidic analytes' pKa could also be used. The actual volume of each phase of the two-layered drop was estimated by applying the volume formula for an oblate spheroid to the drop image taken with a digital microscope (Qi Yao Technology, Shanghai, China). During extraction, a backpressure of 0.1 psi was applied to maintain a constant drop volume at suitable time intervals depending on the volume and extraction temperature.
After extraction, a small portion of the enriched acceptor drop (not the octanol layer) was injected hydrodynamically into the capillary at 0.3 psi for 5 s. When the capillary inlet was lifted from the sample vial, the remaining drop was automatically detached. Finally, the capillary inlet was placed in a run buffer vial, and electrophoresis was carried out.
After each SDME-CE run, the capillary was rinsed backward with 0.1 M NaOH for 10 min, water for 5 min, and run buffer for 10 min to clean the capillary for the next run and to remove the existing coating before subsequent recoating. The same protocol was followed for the subsequent runs. After 4 to 5 runs, a small build-up of coating debris and intrusion of octanol near the inlet might occur. The adverse effect of this build-up on drop formation might not be obvious, but CE separation and analysis could fail even when the drop is well formed. Hence, as a precautionary measure, it is highly advisable to rinse the capillary backward with methanol for 30 min and water for 5 min at 60 psi after 4 runs. Then, the capillary was reconditioned with 1 M NaOH for 30 min, water for 5 min and run buffer for 30 min at a backpressure of 60 psi, and
the same rinsing protocol was followed thereafter.
Through sample agitation and proper temperature control of the donor phase, the extraction kinetics can be accelerated. A in-house-built retrofit microstirrer of 7-mm height composed of a 10-mm-diam plastic rotor implemented with 4 magnets and a 13-mm-diam coin motor (J120, Sewoon Motors, Seoul, Korea) was placed under the sample tray holder of the existing CE instrument machine (Fig. 3a-b) and it was driven by a DC power supply (DPS5005, UCTRONICS, Nanjing, China) as shown in Fig. 3c. A spherical 3-mm stirring bar (Cowie Technology, Middlesbrough, England) was used to agitate the sample donor solution (Fig. 2). The extraction temperature was controlled by thermostating the sample vial with a glass water jacket mounted on the cut-out sample tray using an acrylic plate and plastic screws and connected to a water bath (LAUDA, Baden-Württemberg, Germany – Fig. 3d). A digital microscope (Qi Yao Technology, Shanghai, China) was used to monitor the SDME process. The insert shows the capillary inlet immersed in the sample solution (Fig. 3e).
Figure 2. Single drop formation. The images of the capillary inlet tip when (a) unpolished, (b) well-polished, and coated. The coating made the inlet tip hydrophobic which allowed the stable formation of the small drop covered in organic layer attached on it. (d) Graphical representation of the drop with height z and the axes a and c, and (e) The real drop image during extraction.
Figure 3. Microstirrer and thermostating jacket assembly. (a-b) The in- house-built retrofit microstirrer, (c) the power supply, (d) the glass water jacket and (e) Digital microscope monitoring the SDME process. The insert shows the capillary inlet immersed in the sample solution.
4. RESULTS AND DISCUSSION
4.1. Optimization of high-performance three-phase DI- SDME
Before investigating the analytical performance of HP-SDME, several factors affecting its successful implementation was optimized.
4.1.1. Drop location (depth)
An effective implementation of SDME starts with the successful creation of a stable drop that will last for a desired extraction time. Its location (depth) inside a given volume of sample solution must be given special attention, especially when stirring is applied. In our previous work, sample agitation showed large effects on the extraction efficiency;
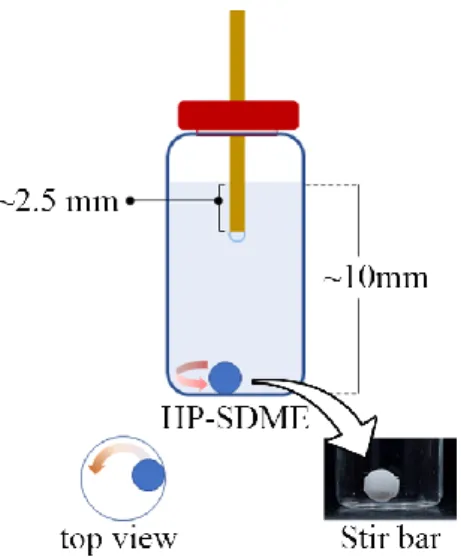
however, the depth of the inlet when directly immersed into the stirred sample was not specifically described [25, 26, 28]. In this work, a detailed description of the optimum location of the drop for a 100%
successful DI-SDME implementation was presented. After several runs, the optimum depth of the inlet when immersed in a 1500 μL (~10 mm height) sample solution in a sample vial of 2 mL was found to be ~2.5 mm from the surface (Fig. 4). At this location, a highly stable nanoliter drop for a 10-min extraction was successfully created. Thus, this depth of the inlet was consistently applied in all the subsequent SDME runs.
Figure 4. The optimum drop location (depth) for three-phase DI-SDME with stirring.
4.1.2. Organic Layer
The volumes of the organic and acceptor phases are among the important major parameters in high performance three-phase DI-SDME.
The volumes of each phase were estimated from the image of a layered drop (see Fig. 2d-e) as described in section 2.2. The octanol layer volume, Vo, in Eq. 9 was estimated by subtracting Va from the total volume of the layered drop which was calculated similarly. The uncertainties of the volumes estimated using Eq. (8) were about ±1 nL due to the uncertainties in measuring the drop sizes from an image. Compared to the EFs of our previously published three-phased DI-SDME studies where in liquid volumes were estimated by the Poiseuille equation [25, 26, 28], the current EF results showed up to 70% smaller RSDs.
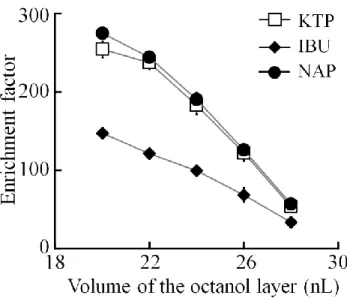
Figure 5. Effect of the organic phase volume (20-28 nL) with a fixed acceptor volume of 8 nL. Bare fused silica capillary; 50-μm inner diameter, 60-cm length (50-cm effective length): Donor phase; 5 μM analyte in HCl (pH = 2), ~1.6 mL: Octanol phase; 22 nL: Acceptor phase (run buffer); 80 mM sodium tetraborate (pH = 9.8), 8 nL: Drop formation:
octanol injection at 2 psi for 7.6 s and backpressure of 0.7 psi for 23.8 s;
Drop maintenance: back pressure of 0.1 psi for 8 s at every 12 s;
Extraction; 10 min at 35 ± 1°C with slow stirring: Sample injection; 0.3 psi for 5 s: Separation voltage; 20 kV. Error bars denote the standard deviations (n = 3). The lines are to guide the eye.
With reducing volume of the organic layer, the transfer of the analytes from the donor to the acceptor phases will be faster, and the amounts of the analytes remaining in the organic phase will be smaller, thus yielding higher EFs for a given extraction time of SDME. Fig. 5 shows the EFs obtained with 10-min SDME with varying octanol layer
volume. The EFs decreased gradually as the octanol layer volume increased from 20 to 28 nL while maintaining the acceptor phase volume at 8 nL. Although the highest EFs were obtained with an octanol layer volume of 20 nL, the drop could withstand 10 min of extraction with a success rate of 50% (n = 10). The guideline for the optimal organic layer was to choose the smallest volume to form a stable two-layer drop. Hence, an octanol volume of 22 nL was chosen as optimal.
4.1.2. Acceptor Phase
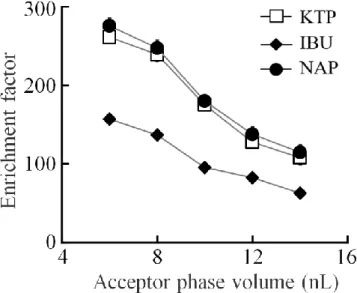
From Eqs. (2) and (3), higher EFs are expected with a smaller acceptor phase. When the acceptor phase volume was increased from 6 to 14 nL while maintaining the octanol layer volume constant at 22 nL, the EFs decreased, as shown in Fig. 6. Once again, although the drop with the smallest volume of 6 nL yielded the highest EFs, a drop volume of 8 nL was chosen as optimal, considering the ease of handling, stability, and reproducibility of the drop formation.
Figure 6. Effect of the acceptor phase volume (6–14 nL) with a fixed octanol volume of 22 nL. Other conditions were the same as in Figure 5.
Error bars denote the standard deviations (n = 3). The lines are to guide the eye.
4.1.3. Extraction Time
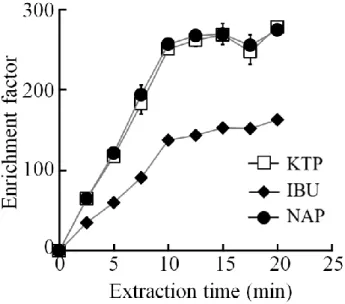
It is obvious that higher EFs could be obtained with a longer extraction time, but the two-layer drop may lose its integrity with prolonged extraction, and the EF improvements with time may become less efficient. To choose an optimal extraction time, SDME-CE with an 8-nL acceptor drop covered with a 22-nL octanol layer was carried out with various extraction times from 2.5 to 20 min. Fig. 7 shows that the EFs increased almost linearly up to 10 min and then less significantly afterward. It was also observed that the drop became less stable after 10 min, probably due to the loss of the octanol layer by dissolution. The sudden drop in the EFs at 15 min extraction for KTP and NAP is due to the uncontrolled external factors (like temperature) during intra and interday during the optimization process. Thus, an extraction time of 10 min was chosen as optimal.
Figure 7. Effect of the extraction time (2.5, 5, 7.5, 10, 12.5. 15, 17.5, and 20 min) with a fixed organic layer volume of 22 nL and acceptor phase volume of 8 nL. Other conditions were the same as in Figure 5. Error bars denote the standard deviations (n = 3). The lines are to guide the eye.
4.1.4. Temperature of donor phase
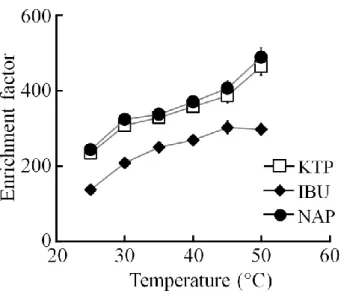
Temperature is another important factor in extraction controlling the equilibrium and kinetics [43]. At an elevated extraction temperature, the EFs for a given extraction time generally increase [25]. When the temperature was elevated from 25 to 35°C, an increasing trend in EFs with temperature was evident (Fig. 8), and extraction was 100%
successful (n = 10) with a quite stable drop. However, at temperatures above 35°C, microbubbles that formed in the sample solution tended to disturb the drop. At temperatures above 50°C, the success rate was low (~10%, n = 10) due to the drop instability caused by increased formation of microbubbles and hampered durability of the coating and thin octanol layer.
Figure 8. Effect of the extraction temperature (25°C to 50°C). Other conditions were the same as in Figure 5. Error bars denote the standard deviations (n = 3). The lines are to guide the eye.
4.1.5. Sample Agitation
Sample agitation during extraction is commonly applied to liquid phase extraction to enhance its extraction speed [44, 45]. Stirring not only provides fresh analytes near the interphase between the sample solution and organic layer but also destabilizes the drop. A retrofit microstirrer was installed beneath the sample tray as described in section 3.3. The agitation effects at two stirring speeds of the stir bar at ~300 (slow) and
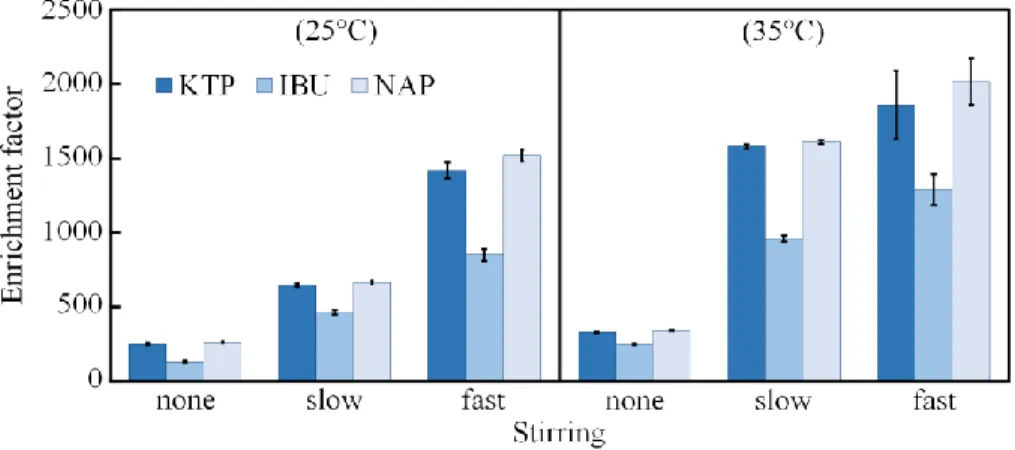
~500 rpm (fast) were investigated (see Fig. 9). Above 500 rpm, it was difficult to maintain the drop stability. At 25°C, the EFs obtained with stirring were 3~4 (slow) and 5~6 (fast) times higher than those without stirring. At 35°C, the EFs obtained with stirring were 6~7 (slow) and 8~10 (fast) times higher than those obtained at 25°C without stirring.
Although the highest EFs were obtained with fast stirring at 35°C, the relative standard deviations (RSDs) of EFs were larger. Hence, slow stirring at 35°C was chosen as optimal. Note that fast stirring at 25°C, which could be implemented by installing only the microstirrer, was also an adequate choice with slightly lower EFs and larger RSDs.
Figure 9. Effect of the sample agitation (25°C and 35°C) with a fixed organic layer volume of 22 nL and acceptor phase volume of 8 nL and extraction time of 10 min. Other conditions were the same as in Figure 5. Error bars denote the standard deviations (n = 3).
4.2. Analytical performance of high-performance three- phase DI-SDME-CE
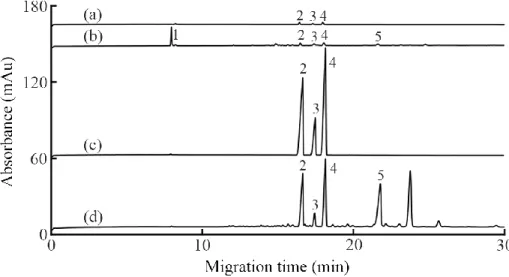
Before applying the optimized, high-performance 3-phase DI- SDME-CE to a real sample, its performance was first validated with standard samples of NSAIDs as described in section 3.1. Fig. 10a shows an electropherogram obtained from CE of 100 μM KTP, IBU, and NAP in water. Fig. 10c shows an electropherogram from a 10 min of DI- SDME-CE of 5 μM NSAIDs in HCl at pH 2 with stirring at 35°C. Table 1 summarizes the performance of 10-min 3-phase DI-SDME-CE at 35°C for standard NSAID samples with stirring. The limits of detection (LODs) obtained with a built-in UV absorbance detector, estimated from the corrected peak areas, were 5–16 nM (1–3 μg/L). The constructed calibration curves of the corrected peak areas of KTP (r2 = 0.9908), IBU (r2 = 0.9936), and NAP (r2 = 0.9903) showed good linearity in the range of 10–7000 nM. In addition, the RSDs of the migration times and corrected peak areas were 0.5–0.6% and 0.7–1.9%, respectively (n = 3), with high EFs of 1580 ± 15, 960 ± 18, and 1610 ± 12 for KTP, IBU, and NAP, respectively (n = 3). Aside from the small acceptor volume and thin organic layer, the high EF values obtained were also attributed to heating (35 ± 1°C) and agitation of the extraction system. The synergistic combination of heating and stirring enhanced the extraction efficiency 6–7-fold. Specifically, the EF values changed from 250 ± 8 to 1580 ± 15, 130 ± 7 to 960 ± 18, and 260 ± 5 to 1610 ± 12 for KTP, IBU, and NAP, respectively.
Figure 10. Electropherograms from (a) CE of 100 µM KTP, IBU, and NAP in water, (b) CE of urine 1 spiked with 100 µM of the analytes, (c) 10-min DI-SDME-CE of 5 µM analytes in HCl of pH 2 at 35°C with stirring, and (d) 10-min DI-SDME-CE of urine 1 spiked with 5 µM analytes in HCl of pH 2 at 35°C with stirring. Others as in Fig. 5. Peaks:
1; creatinine, 2; KTP, 3; IBU, 4; NAP, and 5; hippuric acid.
Table 1. Analytical performance of 3-phase DI-SDME-CE for standard samples
KTP IBU NAP
LOD (nM),
S/N = 3 8 (2 μg/L) 16 (3 μg/L) 5 (1 μg/L) Linear range
(nM) 25–7000 50–7000 10–7000
Linearity (r2) 0.9908 0.9936 0.9903
Linear curvea y = 7352.2x +
2147.9 y = 2632.1x +
130.62 y = 7780.1x + 2166.5
%RSD MTb 0.5 0.6 0.6
CPAb 0.9 1.9 0.7
EF ± standard deviation
(n = 3) 1580 ± 15 960 ± 18 1610 ± 12
DI-SDME conditions
Donor phase; 5 μM analytes in water (acidified with 1 M HCl to pH 2),
~1.6 mL: Organic phase; octanol, 22 ± 1 nL: Acceptor phase; run buffer (pH = 9.8), 8 ± 1 nL: Extraction; 10 min at 35 ± 1°C with slow stirring.
CE conditions
Bare fused silica capillary; 50 cm (effective length)/60 cm: Run buffer;
80 mM sodium tetraborate of pH 9.8: Sample injection; 0.3 psi × 5 s:
Separation; +20 kV, 25°C, 214 nm
(a) y; corrected peak area (μAU/s): x; concentration (μM)
(b) MT; migration time: CPA; corrected peak area (= peak area/MT)
4.3. Application to human urine samples
The developed high-performance three-phase DI-SDME-CE was then applied to unfiltered and undiluted human urine samples. For a physiological sample in a complex and high-conductivity matrix such as urine, it is desirable to carry out sample pretreatment before CE analysis.
Fig. 10b shows an electropherogram from CE of an undiluted urine sample (urine 1) spiked with 100 μM KTP, IBU, and NAP. In addition to NSAIDs, endogenous components of urine, including creatinine and hippuric acid, were identified through spiking. When a morning urine sample (urine 1) spiked with 5 μM of the analytes and acidified to pH 2 by adding 1 M HCl was subjected to 10 min of DI-SDME, basic creatinine was excluded, but acidic NSAIDs and hippuric acid were enriched, as shown in Fig. 10d. Although some unknown peaks were observed, the target analytes were selectively and clearly detected. Table 2 summarizes the performance of our 10-min, 3-phase DI-SDME-CE for NSAIDs in undiluted and unfiltered urine 1 at 35°C with stirring. The LODs obtained with a built-in UV absorbance detector, estimated from the corrected peak areas, were 10–50 nM (2–10 μg/L), with RSDs of the migration times and corrected peak areas of 0.3–0.9% and 1.1–3.6%, respectively (n = 3). The EFs for KTP, IBU, and NAP were 970 ± 14, 340
± 13, and 950 ± 10, respectively. The EFs of NSAIDs in urine 1 were up to 60% lower than the EFs of standard solutions, which can be explained by the interference of other endogenous compounds present in the urine during the extraction process. These observed reductions in enrichment were also consistent with previous reports using a urine matrix [28].
Nevertheless, we were able to selectively preconcentrate NSAIDs from other components of urine.
Furthermore, it can be observed from the results that the enrichment of KTP and NAP in both standard solution and spike urine samples were consistently higher than IBU (Table 1 and 2) and it is evidently seen in their electropherograms in Fig. 10. Adjusting the donor phase to pH 2 as described in the procedure enhances the neutral forms of these acidic analytes because neutral forms of these analytes are more soluble into the octanol layer. Nevertheless, their mass transfer into the octanol layer is primarily affected by their partition coefficient values.
Compared to KTP and NAP, IBU has the lowest measured partition coefficient among the three NSAIDs in octanol/water interphase as reported in literature [46-48]. Since it has the lowest partition coefficient then it has the smallest amount extracted into the organic layer, which was back extracted and enriched into the basic acceptor phase. This consistently low EFs of IBU compared to KTP and NAP is consistent with the results in published reports [41, 49, 50].
The power of our 3-phase DI-SDME-CE method for real samples was further demonstrated by selectively preconcentrating NAP in an undiluted and unfiltered urine sample (urine 2) obtained from a volunteer 24 h after taking a single oral dose of 250 mg of NAP.
Electropherograms from the CE and 10 min of SDME-CE of the urine sample (urine 2) are shown in Figs. 11a and11b, respectively. The presence of NAP was tentatively determined by comparing the electropherogram of Fig. 11b with that of the previous urine sample
(urine 1) spiked with NSAIDs in Fig. 10d. The peak identification of NAP was further confirmed by the sample (urine 2) spiked with 2 μM KTP, IBU, and NAP (Fig. 11c). Similarly, the concentration of NAP in the urine sample was calculated by performing a standard addition calibration to cope with the matrix effect, and the corresponding value was 2.1 ± 0.8 μM (460 μg/L). In the pharmacokinetics of NAP, it was specified that it has a half-life of 12–15 h, and approximately 80% of the administered dose is excreted in urine in its unchanged form (free form).
In this context, it was expected that trace amounts of NAP can be present in urine after 24 h. In this work, the detected concentration of NAP in the urine sample was comparable to that in previously published reports [51- 55]. In addition to the peaks of NSAIDs under study, it was observed from the electropherograms in Figs. 10–11 that other acidic components of the human urine sample, especially hippuric acid (pKa = 3.59) [56], were also enriched. It can be inferred from these observations that our method can be employed for the separation and detection of other acidic urine components. For basic components, of course, the pH values of the donor and acceptor phases should be reversed.
Recently, Garcia-Vazquez et al. reported a three-phase DI- SDME-CE of NSAIDs in a conventional configuration of placing an organic phase on the sample donor solution [41]. They found that after inline extraction of the analytes from 400 µL of a 10-fold diluted urine sample of pH 2 into a 300 μL organic phase (ethyl acetate), a 10-min back-extraction into a 510 nL acceptor drop of 1 mM NaOH yielded EFs of 27 for KTP, 12 for IBU, and 44 for NAP. Assuming that the partition
coefficients of the analytes between water and octanol [11] are similar to those between water and ethyl acetate, the equilibrium EFs from Eq. (1) are 500–600 for Garcia-Vazquez et al.’s work and 50 000–150 000 for our work. Our 300–700-times lower LODs of 10–50 nM (2–10 μg/L) are attributed to the following factors: using undiluted urine instead of 10- fold diluted urine; taking advantage of the larger surface-to-volume ratio of the smaller acceptor drop covered with a thin organic layer, yielding 20–40 times higher EFs; and employing an absorbance detector with a single UV wavelength selected using an interference filter instead of a diode array detector [57, 58].
Figure 11. Electropherograms of urine 2 from a volunteer 24 h after taking a single dose of NAP with (a) CE without SDME, (b) 10-min DI- SDME-CE after acidifying the donor phase at 35°C with stirring, and (c) 10-min DI-SDME-CE after acidifying the donor phase spiked with 2 µM of NSAIDs at 35°C with stirring. Others as in Fig. 5.
Table 2. Performance of 3-phase DI-SDME-CE for spiked urine 1
KTP IBU NAP
LOD (nM),
S/N = 3 13 (3 μg/L) 50 (10 μg/L) 10 (2 μg/L) EF ± standard
deviation (n =
3) 970 ± 14 340 ± 13 950 ± 10
%RSD MT 0.7 0.9 0.3
CPA 1.4 3.6 1.1
DI-SDME and CE conditions as in Table 1.
5. CONCLUSIONS
A more enhanced, easy-to-follow, user-friendly and high- performance 3-phase inline DI-SDME method coupled with CE/UV was demonstrated. Specifically, the proper conditioning of the capillary tip for improved drop stability, the efficient rinsing protocol, and the improved estimation of the volumes of the acceptor drop and the organic layer using the oblate spheroid volume formula were described in detail.
The DI-SDME-CE performance under the optimal configuration was evaluated using NSAIDs (KTP, IBU, and NAP) as model acidic analytes.
By employing the unique small acceptor drop covered with a thin organic layer, well-controlled heating, and stirring of the sample solutions, EF values of 1580 (970), 960 (340) and 1610 (950) for KTP, IBU, and NAP (in urine sample) were obtained, respectively, in just 10 min. Our 3-phase SDME-CE method exhibited up to several hundred-fold improvements in LODs over conventional SDME-CE reported a few years ago, clearly quantifying the NAP level in a urine sample collected 24 h after taking a single dose of NAP. Our high-performance three-phase DI-SDME-CE method is a promising technique for determining NSAIDs and other ionizable compounds not only in water but also in biological samples, without any modification of the existing CE instrument or with heating and stirring for more enhanced performance.
REFERENCES
[1] Z.A. Alothman, M. Dawod, J. Kim, D.S. Chung, Anal. Chim.
Acta. 739 (2012) 14.
[2] K. Cheng, K. Choi, J. Kim, I.H. Sung, D.S. Chung, Microchem.
J. 106 (2013)220.
[3] J.P. dos Anjos, J.B. de Andrade, Microchem J. 112 (2014) 119.
[4] X. Wang, J. Cheng, X. Wang, M. Wu, M. Cheng, Analyst. 137 (2012) 5339.
[5] M. Ma, F.F. Cantwell, Anal. Chem. 71 (1999) 388.
[6] S. Tang, T. Qi, Y. Yao, L. Tang, W. Chen, T. Chen, et al, Anal.
Chem. 92 (2020) 12290.
[7] E. Zhao, L. Han, S. Jiang, Q. Wang, Z. Zhou, J. Chromatogr A.
1114 (2006) 269.
[8] S. Liu, P.K. Dasgupta, Anal. Chem. 67 (1995) 2042.
[9] G. Jarvas, A. Guttman, N. Miękus, T. Bączek, S. Jeong, D.S.
Chung DS, et al, Trends Analyt. Chem.122 (2020)115702.
[10] M. Palit, D. Pardasani, A.K. Gupta, D.K. Dubey, Anal. Chem. 77 (2005) 711.
[11] K. Choi, J. Kim, D.S. Chung, Bioanalysis. 3 (2011) 799.
[12] S. Tang, T. Qi, P.D. Ansah, J.C. Nalouzebi Fouemina, W. Shen, C. Basheer, et al. Trends Analyt. Chem. 108 (2018) 306.
[13] A. Jain, K.K. Verma, Anal. Chim. Acta. 706 (2011) 37.
[14] W. Gao, G. Chen, Y. Chen, N. Li, T. Chen, Z. Hu, J. Chromatogr.
A. 1218 (2011) 5712.
[15] X. Li, Q. Li, A. Xue, H. Chen, S. Li, Anal. Methods. 8 (2016) 517.
[16] X. Li, A. Xue, H. Chen, S. Li, J. Chromatogr. A. 1280 (2013) 9.
[17] I. Kiszkiel-Taudul, B. Starczewska, Microchem. J. 145 (2019) 936.
[18] D.A.V. Medina, F.F. Rodríguez Cabal, G.M. Titato, F.M. Lanças, Á.J. Santos-Neto, J. Chromatogr. A. 1595 (2019) 66.
[19] A.A. Rincón, V. Pino, J.H. Ayala, A.M. Afonso, Talanta. 85 (2011) 1265.
[20] H. Ebrahimzadeh, Y. Yamini, A. Gholizade, A. Sedighi, S.
Kasraee, Anal. Chim. Acta. 626 (2008) 193.
[21] N.S. Pano-Farias, S.G. Ceballos-Magaña, R. Muñiz-Valencia, J.M. Jurado, Á. Alcázar, I.A. Aguayo-Villarreal, Food Chem. 237 (2017) 30.
[22] E.G. Amvrazi, N.G. Tsiropoulos, J. Chromatogr. A, 1216 (2009) 2789.
[23] F. Tian, W. Liu, H. Fang, M. An, S. Duan, Chromatographia. 77 (2014) 487.
[24] H. Chen, R. Chen, R. Feng, S. Li, Chromatographia. 70 (2009) 165.
[25] K. Choi, Y. Kim, D.S. Chung, Anal Chem. 76 (2004) 855.
[26] K. Choi, S.J. Kim, Y.G. Jin, Y.O. Jang, J-S. Kim, D.S. Chung, Anal Chem. 81 (2009) 225.
[27] S.T. Park, J. Kim, K. Choi, H.R. Lee, D.S. Chung, Electrophoresis. 33 (2012) 2961.
[28] K. Choi, J. Kim, Y.O. Jang, D.S. Chung, Electrophoresis. 30 (2009) 2905.
[29] J. Choi, K. Choi, J. Kim, A.Y.B.H. Ahmed, Z.A. Al-Othman, D.S.
Chung, J. Chromatogr. A. 1218 (2011) 7227.
[30] J. Kim, K. Choi, D.S. Chung, Anal. Bioanal. Chem. 411 (2019) 1067.
[31] J. Kim, K. Choi, D.S. Chung, Anal. Bioanal. Chem. 407 (2015) 8745.
[32] G. Liang, K. Choi, A.Y.B.H. Ahmed, Z.A. Alothman, D.S. Chung, Anal. Chim. Acta. 677 (2010) 37.
[33] Y-K. Park, K. Choi, A.Y.B.H. Ahmed, Z.A. Alothman, D.S.
Chung, J. Chromatogr. A. 1217 (2010) 3357.
[34] A. Poliwoda, K. Zielińska, P.P. Wieczorek, Molecules. 25 (2020) 1566.
[35] S. Jahan, H. Xie, R. Zhong, J. Yan, H. Xiao, L. Fan, et al, Analyst.
140 (2015) 3193.
[36] E. Greenlaw, https://www.webmd.com/pain-
management/features/pain-relievers-nsaids#2md.com/pain- management/features/pain-relievers-nsaids#2. 18. 06. 2018.
[37] P. McGettigan, D. Henry, PLOS Med. 10 (2013) e1001388.
[38] B. Russell, C. Moss, A. Rigg, M. Van Hemelrijck, Ecancermedicalscience. 14 (2020) 1023.
[39] P. Little, BMJ. 368 (2020) m1185.
[40] N.H. Hashim, S.J. Khan, J. Chromatogr. A. 1218 (2011) 4746.
[41] A. Garcia-Vazquez, F. Borrull, M. Calull, C. Aguilar, Electrophoresis. 37 (2016) 274.
[42] C. Ye, Q. Zhou, X. Wang, J. Chromatogr. A. 11389 (2007) 7.
[43] D.E. Raynie, LCGC North America. 34 (2021) 30.
[44] C-Y. Lin, M-R. Fuh, S-D. Huang, J. Sep. Sci. 34 (2011) 428.
[45] M.L. de Oliveira, B.A. Rocha, V.C.dO. Souza, F. Barbosa, Talanta. 196 (2019) 271.
[46] F. Barbato, M.I. La Rotonda, F. Quaglia, J. Pharm. Sci. 86 (1997) 225.
[47] A. Czyrski, J. Chem. 2019 (2019) 3407091.
[48] A. Pyka, M. Babuska, M. Zachariasz, Acta Pol. Pharm. 63 (2006) 159.
[49] A. Sarafraz-yazdi, H. Assadi, Z. Es'haghi, N.M. Danesh, J. Sep.
Sci. 35 (2012) 2476.
[50] M. Ghambarian, F. Tajabadi, Y. Yamini, M. Behbahani, H.R.
Sobhi, A. Esrafili, Arab. J. Chem. 13 (2020) 1924.
[51] A. Aresta, F. Palmisano, C.G. Zambonin, J. Pharm. Biomed. Anal.
2005;39(3):643–7.
[52] E. Mikami, T. Goto, T. Ohno, H. Matsumoto, M. Nishida, J.
Pharm. Biomed. Anal. 23 (2000) 917.
[53] N.M. Davies, K.E. Anderson, Clin. Pharmacokinet. 32 (1997) 268.
[54] R. Runkel, M.D. Chaplin, H. Sevelius, E. Ortega, E. Segre, Clin.
Pharmacol. Ther. 20 (1976) 269.
[55] N. Aranda-Merino, M. Ramos-Payán, M. Callejón-Mochón, M.
Villar-Navarro, R. Fernández-Torres, Anal. Bioanal. Chem. 412 (2020) 6811.
[56] D.S. Wishart DS, Y.D. Feunang, A. Marcu, A.C. Guo, K. Liang, R. Vázquez-Fresno, et al, Nucleic Acids Res. 46 (2018) D608.
[57] M.W. Dong, J. Wysocki, LCGC North America. 37 (2019) 750.
[58] J.R. Riordon, Anal. Chem. 72 (2000) 483.
Abstract
고성능 인라인 농축 기법인 3-상 직접 담금-단일 방울 미세추출법 (3-phase
DI-SDME)와 연동된 모세관 전기영동 (CE)은 상용 CE 장비를 활용하여
구현하였다. 쉽게 따라할 수 있고, 연구자들이 친숙히 접근 가능하도록 해 당 기법에 대한 주요 사항 및 세부 사항 모두 기술하였다. 사람 소변 시료 에서의 비스테로이드성 항염증 약물 (NSAIDs) 검출을 통해, 해당 기법의 시료 전처리 및 농축 효과를 입증하였다. 소변 시료에 대한 전처리는 단지 소변 시료를 pH 2로 산성화하기 위해서 HCl을 소량 첨가해주는 것이 전 부이다. 산성화된 소변 시료에서의 산성 NSAIDs는 시료에 담긴 모세관 주입부에서 얇은 옥탄올 층으로 둘러 쌓여 형성된 염기성 받개층 방울로 농축된다. 간단하지만 강력한 성능을 나타내는 DI-SDME-CE 기법은 기존 CE 장비에 어떠한 변형없이 장비 그대로 활용하여 자동화 가능하다. 농축 효과 향상을 위해 기기 내부 시료 트레이에 소형 교반기 및 항온 수조를 설치하여 시료를 교반하고, 가열하였다. 35℃에서 시료를 교반하면서 10 분의 DI-SDME 수행 시, 케토프로펜, 이부프로펜 그리고 나프록센과 같은 소변 속 NSAIDs는 약 340–970배 농축되었으며, 이를 UV 검출기가 연결 된 CE와 인라인 결합 시 검출 감도는 약 10–50 nM (2–10 μg/L) 였다. DI- SDME-CE/UV의 우수한 성능은 약물을 경구투여 후, 24시간 뒤에 수집한 사람 소변 실시료에서의 나프록센 검출을 통해서도 재입증하였다. 본 연 구진의 고성능 3-상 DI-SDME-CE 기법은 복잡한 매트릭스를 지닌 시료 상 에서 이온화 가능한 미량의 분석 물질을 검출할 시에도 꽤 유용하게 작용 할 것이라 기대된다.
핵심어:
모세관 전기영동 · 비스테로이드성 항-염증 약물 · 소변 · 시료 전처리 · 고 성능 단일 방울 미세 농축법
학생번호: 2019-28019