저작자표시-비영리-변경금지 2.0 대한민국 이용자는 아래의 조건을 따르는 경우에 한하여 자유롭게
l 이 저작물을 복제, 배포, 전송, 전시, 공연 및 방송할 수 있습니다. 다음과 같은 조건을 따라야 합니다:
l 귀하는, 이 저작물의 재이용이나 배포의 경우, 이 저작물에 적용된 이용허락조건 을 명확하게 나타내어야 합니다.
l 저작권자로부터 별도의 허가를 받으면 이러한 조건들은 적용되지 않습니다.
저작권법에 따른 이용자의 권리는 위의 내용에 의하여 영향을 받지 않습니다. 이것은 이용허락규약(Legal Code)을 이해하기 쉽게 요약한 것입니다.
Disclaimer
저작자표시. 귀하는 원저작자를 표시하여야 합니다.
비영리. 귀하는 이 저작물을 영리 목적으로 이용할 수 없습니다.
변경금지. 귀하는 이 저작물을 개작, 변형 또는 가공할 수 없습니다.
공학박사 학위논문
레이저로 유도되는 마이크로젯을 활용한 경피 약물 전달 시스템
A Transdermal Drug Delivery System Based on Laser-generated Microjet
2017년 8월
서울대학교 대학원 기계항공공학부
장 헌 재
레이저로 유도되는 마이크로젯을 활용한 경피 약물 전달 시스템
A Transdermal Drug Delivery System Based on Laser-generated Microjet
지도 교수 여 재 익
이 논문을 공학박사 학위논문으로 제출함 2017년 5월
서울대학교 대학원 기계항공공학부
장 헌 재
장헌재의 공학박사 학위논문을 인준함 2017년 6월
위 원 장 (인)
부위원장 (인)
위 원 (인)
위 원 (인)
위 원 (인)
1
Abstract
A Transdermal Drug Delivery System Based on Laser-generated
Microjet
Hun-jae Jang Mechanical and Aerospace Engineering The Graduate School Seoul National University
Needle syringe injection is a widely used transdermal drug delivery method because of its low cost and high efficiency. However, needle syringes have disadvantages such as affliction of needle phobia and pain, generation of medical waste, and potential contamination due to reuse. Therefore, there is a need for an alternative that will replace the existing needle-based drug delivery system.
The transdermal drug delivery systems penetrate the skin barrier using various chemical or physical processes including diffusion and permeation.
Among them, use of liquid jet has attracted significant attention as one of the effective drug delivery methods. Unexpectedly, the liquid injection method has the potential for cross-contamination due to splash back during injection.
Furthermore, if the liquid jet dose not have high speed and narrow cross-
2
section, this method yields poor reliability in terms of delivering correct dosage at appropriate depth as well as insignificant or no reduction in pain.
In the current study, a breakthrough in the efficient transdermal drug delivery of a laser-generated microjet has been reported. Such a microjet injector systems accelerate and deliver drugs without needles to overcome the weaknesses of traditional jet injectors. For example, microjets with reduced jet diameter and jet volume per pulse and repetitive injection have been implemented in order to achieve better performance in terms of the reliability by controlling the penetration depth and delivered drug dose.
Simultaneously, a detailed analysis of the injection mechanism was carried out by studying the process of bubble growth and drug release with a high speed camera. The high speed visualization provided an improved understanding of the basic driving mechanism of the microjet injector developed in this study. The efficiency of the present drug delivery scheme was also evaluated by injection tests on animal skin.
In conclusion, all aspects of the drug delivery system have been discussed.
The study achieves the enhancements in microjet ejection and repetitive jet generation process, making the injector suitable for general clinical applications. The reported results provide a design guideline to build a reliable and functionally optimized microjet injector system.
Keywords: Drug delivery, Transdermal injection, Pain reduction, Microjet, Laser, Bubble dynamics
Student Number: 2011-20747
3
Contents
Abstract ... i
Contents ... iii
List of Tables ... vi
List of Figures ... vii
Preface ... xv
Chapter 1. Introduction ... 20
Chapter 2. Experimental Apparatus ... 23
2.1 Laser ... 23
2.2 High Speed Camera ... 25
2.3 Microjet Injector ... 26
Chapter 3. Characteristics of Laser-generated Microjet ... 28
3.1 Bubble and Microjet Characteristics Generated by Laser ... 28
3.1.1 Background and Motivation ... 28
3.1.2 Experimental Approach ... 29
3.1.3 Results and Discussion ... 31
4
3.2 Penetration Using Nd:YAG Laser-generated Microjet ... 38
3.2.1 Background and Motivation ... 38
3.2.2 Experimental Approach ... 40
3.2.3 Results and Discussion ... 43
3.3 Penetration Using Er:YAG Laser-generated Microjet ... 50
3.3.1 Background and Motivation ... 50
3.3.2 Experimental Approach ... 52
3.3.3 Results and Discussion ... 55
3.4 Pulsed and Repetitive Microjet Generation ... 64
3.4.1 Background and Motivation ... 64
3.4.2 Experimental Approach ... 66
3.4.3 Results and Discussion ... 70
3.5 Optimization of Confined Vapor Bubble for Efficient Microjet Generation ... 85
3.5.1 Background and Motivation ... 85
3.5.2 Experimental Approach ... 87
3.5.3 Results and Discussion ... 90
Chapter 4. Drug Delivery System Using Laser-generated Microjet and Additional Functions ... 104
4.1 Pre-ablation and Microjet Injection ... 104
5
4.1.1 Background and Motivation ... 104
4.1.2 Experimental Approach ... 106
4.1.3 Results and Discussion ... 110
4.2 Synchronization of Skin Ablation and Microjet Injection ... 121
4.2.1 Background and Motivation ... 121
4.2.2 Experimental Approach ... 122
4.2.3 Results and Discussion ... 126
4.3 Deep Tissue Penetration Using Combined Pre-ablation and Microjet Injection Technique ... 142
4.3.1 Background and Motivation ... 142
4.3.2 Experimental Approach ... 144
4.3.3 Results and Discussion ... 150
Chapter 5. Conclusions ... 162
References ... 118
Abstract in Korean ... 130
6
List of Tables
Table 3.1. Calculated Reynolds and gaseous Weber numbers for the Nd:YAG-driven micro-jet ... 50 Table 3.2. Parameters of the microjet injector ... 70 Table 3.3. Experiment results for enhancement of the ejected jet volume ... 72 Table 3.4. Experimental condition for each case ... 89 Table 3.5. Unconfined bubble characteristics depending on stand- off distance ... 94 Table 3.6. Both growth time of confined bubble and membrane determined by combination of stand-off distance and cylinder height ... 96 Table 3.7. Both unconfined and confined bubble characteristics depending on stand-off distance and cylinder height, respectively .... 101 Table 4.1. Depth and diameter of the ablation hole on the target skin at given laser fluence ... 109 Table 4.2. Efficiency parameters (Penetration depth and Injected volume) of microjet injection are less sensitive to gel strength w/
Ablation than w/o Ablation ... 116
7
Table 4.3. Porcine skin test result on Microjet injection w/ and
w/o ablation ... 120
Table 4.4. Bubble characteristics determined by the pulse duration .. 137
Table 4.5. Ablation data for the mid-infrared-range beam: pulse
duration, energy, ablation rate and ablated diameter ... 146
Table 4.6. Relation between density of micro-holes and drug
delivery efficiency ... 161
8
List of Figures
Fig. 2.1. Image of Powerlite, Continuum Inc. ... 24
Fig. 2.2. Images of Spectra (left) and Action (right), Lutronic Corp. ... 24
Fig. 2.3. Image of Anybeam, B&B sys. Corp. ... 25
Fig. 2.4. Image of phantom, Komi Corp. ... 26
Fig. 2.5. Schematic and images of microjet injector ... 27
Fig. 3.1. Schematic of the microjet generation experiment using an injector with 150μm nozzle. ... 30
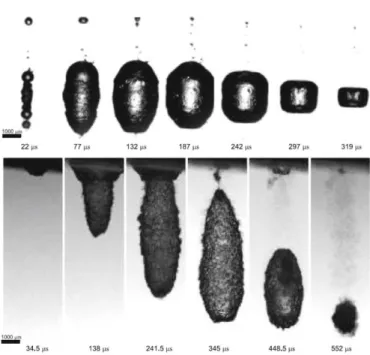
Fig. 3.2. Sequential images of bubble expansion for Nd:YAG (top panels) and Er:YAG (bottom panels) cases ... 32
Fig. 3.3. Measured bubble radius as function of time for Nd:YAG (a) and Er:YAG (b) cases with analytical approximation given by the solid line ... 33
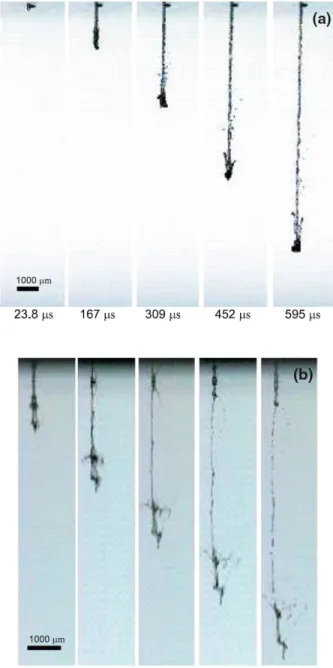
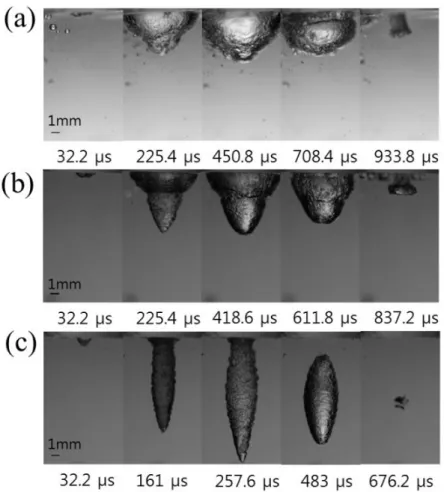
Fig. 3.4. Sequential images of microjet for Er:YAG (a) and Nd:YAG (b) cases ... 36
Fig. 3.5. (a) Basic mechanism of micro-jet formation based on the
elastic membrane response to bubble expansion; (b) the
abdominal guinea pig skin sample for micro-jet injection; (c)
handheld injector for projected skin therapy ... 42
9
Fig. 3.6. Penetration depth measured: (a) different target toughness; (b) 1× and 10× drug viscosities ... 44 Fig. 3.7. Biotin IHC results showing natural, maximum, and positive staining results for (a) no control, (b) regular syringe, and (c) micro-jet injection ... 46 Fig. 3.8. Transdermal FITC staining results: the guinea pig’s abdominal skin treated with micro-jet injections. The epidermis extends up to 60 μm, and staining shows the uniform distribution of fluorescence well below the epidermal layer ... 46 Fig. 3.9. Sequential images of cavitation bubble growth and collapse inside the driving fluid of a micro-jet injector. The maximum bubble size of ... 48 Fig. 3.10. (a) The first jet due to a shock wave shown with a breakup length of 5.47 mm, (b) the second jet resulting from the bubble expansion shown ... 49 Fig. 3.11. Ejected microjet in air, (a) Images of Er:YAG microjet at 408 mJ, 250 μs pulse duration showing jet velocity of ~ 30 m∕s, (b) Jet velocity shown for varying laser energy
0.5 ( 2) jet
E
r u t. ... 54
Fig. 3.12. FITC staining of guinea pig abdominal skin treated with .... 56
10
Fig. 3.13. FITC staining of guinea pig dorsal skin treated with (a)
1.19 J ∕pulse and (b) 1.57 J ∕pulse ... 57
Fig. 3.14. (a) Microjet injection shown with no splash-back, 150
μm diameter, and gel penetration of drug at 408 mJ. (b)
penetration depth and width for varied laser energy. ... 59
Fig. 3.15. (a) Laser-induced vapor bubble: (a) radius of expanding
bubble wall (data: symbol; theory: curve) and (b) images of 408
mJ beam-initiated bubbles in water. ... 62
Fig. 3.16. (a) Mechanism of microjet generation, (b) a schematic
of experiment ... 67
Fig. 3.17. (a) 2D schematic of injector, (b) 3D schematic of drug
refill system, and (c) typical signal of laser and motor ... 69
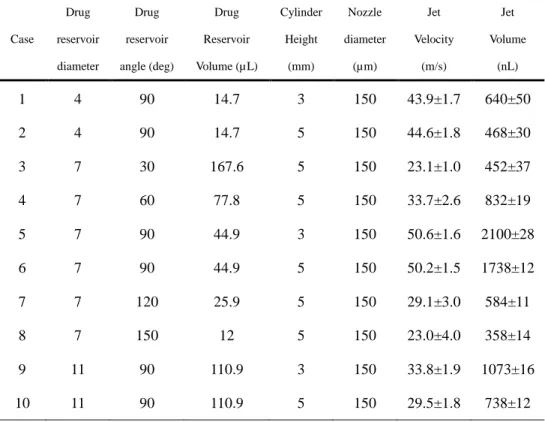
Fig. 3.18. Resultant jet volume due to (a) drug reservoir diameter
and cylinder height, (b) angle of drug reservoir ... 73
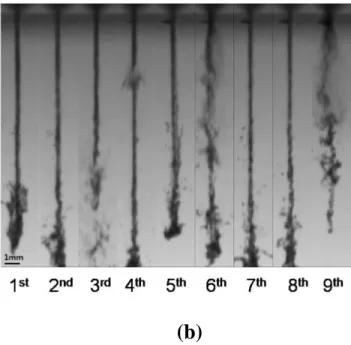
Fig. 3.19. Repetitive microjet jets without the refill pump: (a) jet
volume and (b) images of repetitive microjet ... 75
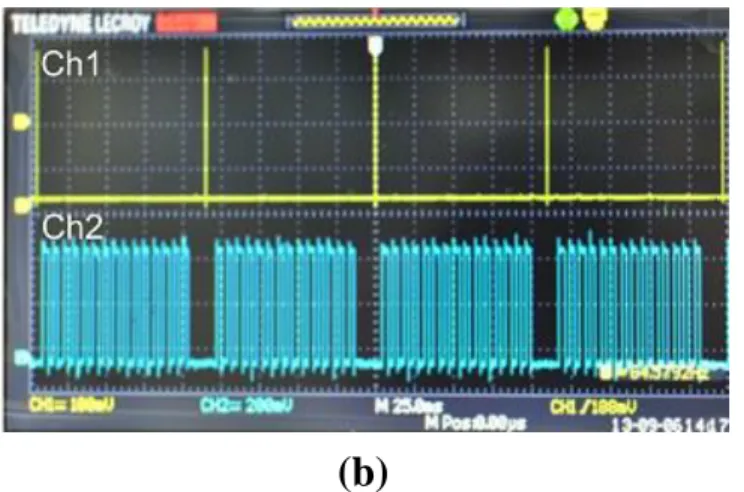
Fig. 3.20. Motor signals for (a) first critical flow rate (13.8 µL/s)
and (b) second critical flow rate (68.8 µL/s) ... 77
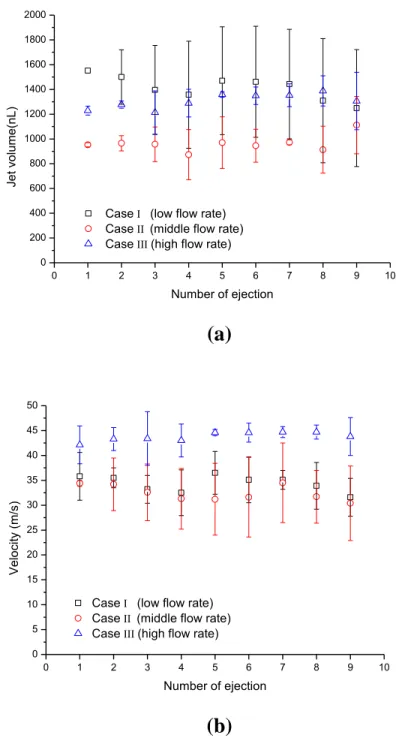
Fig. 3.21. Images of ejected jet according to the flow rates (a)
Case I, (b) Case II, and (c) Case III ... 79
11
Fig. 3.22. Relationships between (a) ejected volume of jet and flow rate of drug refill and (b) between jet velocity and flow rate ... 81 Fig. 3.23. The temperature change of the working fluid inside the chamber ... 82 Fig. 3.24. Rate of increase in (a) Epidermal Growth Factor and (b) Human Growth Hormone. EC and HC are comparison group.
Numbers (100, 10) indicate concentration in ng/mL. Laser energies (408mJ, 816mJ) are also shown. ... 84 Fig. 3.25. (a) Mechanism of microjet generation, (b) experimental condition of unconfined bubble and (c) confined bubble ... 89 Fig. 3.26. Shape of unconfined bubble generated by laser depending on stand-off distance: (a) 45mm stand-off distance case, (b) 65mm stand-off distance case and (c) 85mm stand-off distance case ... 92 Fig. 3.27. Evolution of equivalent radius with respect to time for unconfined bubble according to stand-off distance and each case of average error is following: Case 1: ±9.18% , Case 10:
±10.56% ,Case 15: ±12.26% ... 93
Fig. 3.28. Sequential images of bubble and membrane (dashed
line) : (a) 45mm stand-off distance case, (b) 65mm stand-off
12
distance case and (c) 85mm stand-off distance case and all case,
cylinder height is 11mm ... 95
Fig. 3.29. Equivalent radius with respect to time and Case 1
represents unconfined case and other cases have confined
geometry. (a) Confined cases have same cylinder height as 11mm
but beam spot size is different and (b) confined cases have same
beam spot size but have different cylinder height. Each case of
average error is following: Case 1: ±9.1% , Case 2: ±9.0% ,Case
3: ±5.6% , Case 4: ±7.5% , Case 5: ±11.6% , Case 12: ±8.1% ,
Case 17: ±9.2% ... 98
Fig. 3.30. Growth rate of confined bubble up to (a) pulse duration
and (b) 354μs ... 100
Fig. 3.31. (a) Jet velocity, (b) growth rate of bubble volume and
(c) growth rate of membrane volume of each case depending on
stand-off distance and cylinder height ... 103
Fig. 4.1. Schematic of drug delivery with pre-ablation followed by
a microjet injection using a beam splitter ... 108
Fig. 4.2. Sequential images of bubble (upper chamber) and a
membrane (dashed line) that separates upper water and lower drug .. 111
Fig. 4.3. (a) Extended lengths of bubble and membrane taken
13
from high speed camera images and (b) calculated pressure
incurred on thin membrane ... 113
Fig. 4.4. Sequential images of microjet ejection for (a) Microjet
Only and (b) Pre-ablation Microjet case... 114
Fig. 4.5. Penetration parameters ((a) depth, (b) injected volume)
for each case ... 115
Fig. 4.6. Microjet Only case: sequential images of penetration of
10% PAAG with black ink ... 116
Fig. 4.7. Pre-ablation Microjet case: sequential images of
penetration of 10% PAAG with black ink ... 117
Fig. 4.8. Confocal microscopy image of penetration of porcine
abdominal skin with FITC (Microjet Only) ... 118
Fig. 4.9. Confocal microscopy image of penetration of porcine
abdominal skin with FITC (Pre-ablation Microjet) ... 118
Fig. 4.10. Merged confocal microscopy image of (a) Microjet
Only case and (b) Pre-ablation Microjet case ... 119
Fig. 4.11 Variation of skin penetration depth with varying hole
width ... 120
Fig. 4.12 Schematic of (a) microjet injector, (b) (former system)
combined ablation and microjet injector, and (c) (new) L-shape
14
injector and ablation system ... 124 Fig. 4.13 Typical sequential images of microjet ejection ... 126 Fig. 4.14 Sequential images of vapor bubble and membrane motion in a cylindrical chamber ... 127 Fig. 4.15 Sequential images of vapor bubble formation and membrane motion in an L-shape chamber ... 127 Fig. 4.16 Evolution of (a) radius and (b) rate of volume change of bubble with respect to time for cylindrical and L-shape chambers .... 129 Fig. 4.17 Microjet velocity for L-shape chamber 80%, 100%
energy, and cylindrical chamber ... 131
Fig. 4.18 Combined ablation and microjet injection system: (a)
sequence diagram, and (b) overall schematic ... 132
Fig. 4.19 Sequential images of pre-ablation and microjet injection
into 10% PAAG ... 133
Fig. 4.20 Sequential images of bubbles generated by different
pulse durations: (a) 150μs, (b) 200μs, (c) 250μs, (d) 300μs ... 135
Fig. 4.21 (a) Equivalent radius with respect to time affected by
laser pulse duration and (b) variation in growth rate depending on
pulse duration ... 136
Fig. 4.22 Top view images of repetitive injection (single spot) in a
15
porcine skin with black ink for (a) microjet only and (b) combined ablation and microjet ... 138 Fig. 4.23 Side view images of porcine skin for (a) No penetration, (b) microjet only, and (c) combined ablation and microjet ... 140 Fig. 4.24 Side view images of repetitive injection along a line of the porcine skin with black ink for (a) microjet only and (b) combined ablation and microjet ... 142 Fig. 4.25 (a) Two stage procedure of pre-ablation followed by microjet injection, and (b) a compact combined system using a dual function revolver. ... 145 Fig. 4.26 Top view of burn pattern for each ablation type: (a) Type 1 bulk ablation, (b) Type 2 fractional ablation, and (c) Type 3 fractional–rotational ablation ... 148 Fig. 4.27 Cross sectional view of pre-ablation by type, shown with increasing pulse repetition: (a) Type 1 bulk ablation, (b) Type 2 fractional ablation, and (c) Type 3 fractional–rotational ablation ... 150 Fig. 4.28 Ablation efficiency compared for each pre-ablation type based on (a) total ablation depth and (b) ablation depth per pulse.
The fluence is the same at 8 J/cm2 for all cases. ... 153
Fig. 4.29 Ablation efficiency compared for each pre-ablation type
16
by (a) total mass removed and (b) mass removed per pulse. The
fluence is the same at 8 J/cm2 for all cases. ... 154
Fig. 4.30 Cross sectional view of a single spot with indicated
number of injections (or time) for blue dye: (a) 100 injections, (b)
300 injections, and (c) 500 injections ... 156
Fig. 4.31 Penetration depth per injection time compared for
microjet only, bulk ablation and microjet, fractional ablation and
microjet, and fractional–rotational ablation and microjet. For all
pre-ablation types, 18 reps of laser pulses and 8 J/cm2 are used. ... 157
Fig. 4.32 Cross sectional view of a single spot with 300 injections
and 18 pre-ablation pulses for (a) microjet only, (b) bulk ablation
and microjet, (c) fractional ablation and microjet, and (d)
fractional–rotational ablation and microjet... 158
Fig. 4.33 Penetration depth per injection time compared for
microjet only, bulk ablation and microjet, fractional ablation and
microjet, and fractional–rotational ablation and microjet. For all
pre-ablation types, 18 reps of laser pulses and 8 J/cm2 are used. ... 159
Fig. 4.34 Cross sectional view of the multi-spots (10 spots) at 500
injections per spot and 18 pre-ablation pulses for (a) microjet only,
(b) bulk ablation and microjet, (c) fractional ablation and microjet,
17
and (d) fractional–rotational ablation and microjet. ... 161
18
Preface
This thesis is based on the following publications and manuscripts.
Paper 1
Mi-ae Park, Hun-jae Jang, Fedir V. Sirotskin and Jack J. Yoh. Er:YAG laser pulse for small-dose splashback-free microjet transdermal drug delivery. Optics Letters, 2012, 37.18
Paper 2
Hun-jae Jang, Mi-ae Park, Fedir V. Sirotskin and Jack J. Yoh. Laser- induced microjet: wavelength and pulse duration effects on bubble and jet generation for drug injection. Applied Physics B, 2013, 113.3
Paper 3
Hun-jae Jang, Hyeonju Yu, Seonggeun Lee, Eugene hur, Yoonkwan Kim, Seoul-Hoon Lee, Naegyu Kang and Jack J. Yoh. Towards clinical use of a laser induced microjet system aimed at reliable and safe drug delivery.
Journal of Biomedical Optics, 2014, 19.5 .
Paper 4
Hun-jae Jang, Eugene Hur, Yoonkwan Kim, Seol-Hoon Lee, Nae G.
Kang and Jack J. Yoh. Laser-induced microjet injection into preablated skin for more effective transdermal drug delivery. Journal of Biomedical Optics, 2014, 19.11
19 Paper 5
Jack J. Yoh, Hun-jae Jang, Mi-ae Park, Tae-hee Han, Jung-moo Hah. A bio-ballistic micro-jet for drug injection into animal skin using a Nd:YAG laser. Shock Waves, 2016, 26.1
Paper 6
Hun-jae Jang, Seonggu Yeo and Jack J. Yoh. Synchronization of skin ablation and microjet injection for an effective transdermal drug delivery.
Applied physics A, 2016, 122.4
Paper 7
Hun-jae Jang, Seonggu Yeo and Jack J. Yoh. Skin pre-ablation and laser assisted microjet injection for deep tissue penetration. Lasers in Surgery and Medicine, 2016
The contents are reproduced with permission of the co-authors and the publishers. Copyright of the publications remains with the publishers.
20
Chapter 1. Introduction
Transdermal drug delivery method based on needle syringe has been widely adopted because of its low cost and high efficiency. However, the use of needle syringe has known drawbacks such as affliction of needle phobia, site lesions, pain associated with the invasive procedure, disposal of medical waste, possible contamination from reuse of needles. Therefore, there have been calls for an alternative for the conventional needle-based drug delivery system by overcoming already acknowledged drawbacks.
Still, percutaneous drug delivery is one of the most effective method and it can be improved by understanding the skin structure. Human skin can be divided into three layers: stratum corneum, the viable epidermis and the dermis. The thickness of these layeres are 10-20 µm, 50-100 µm and 1-2mm, respectively. The stratum corneum which is main obstacle to deliver drug is the physical and chemical barrier composed of dead cells and free of blood vessels and verves. The amount of blood vessels and nerves increases with the penetration depth and significantly increases in dermis. Viable epidermis contains relatively small amount of blood vessels and nerves. Therefore, the significant reduction of the pain with acceptable delivery efficiency can be achieved when a drug is delivered into the viable epidermis. The key to this approach is the need for external forces breach the skin barrier, called stratum corneum.
The transdermal drug delivery systems penetrate the skin barrier using
21
various chemical or physical processes including diffusion and permeation.
Among them, use of liquid jet has attracted significant attention as one of the efficient drug delivery methods. Because this needle free drug delivery system is expected to overcome the disadvantages of needle syringes. However, contrary to expectations, liquid jet injectors have the potential for cross- contamination from splash-back during injection. Furthermore, if the liquid jet dose not have high speed and narrow cross-section, resulting in poor reliability in terms of delivering correct dosage at appropriate and depth as well as insignificant or no reduction in pain.
As an improvement, microjet is adopted for safe and efficient drug delivery.
Several different mechanisms of generating the microjet range from spring, compressed gas, piezoelectric transducer, linear Lorentz force piston, electronic driven bubble, and laser-induced wave or bubble. In the spring or gas-powered devices, it is difficult to control drug dose or jet speed with its piston unit, whereas in the piezoelectric transducer, rather precise control of drug dose was deemed possible. The Lorentz force driven injector has shown quite reliable performance in comparison to aforementioned devices.
In currnet study, laser-generated microjet is chosen to solve potential concerns addressed by the medical practitioners. The injector design is evolved around the use of two separate chambers that independently contain driving water (in the upper chamber) and drug (in the lower reservoir), separated by a thermally resistant silicon rubber membrane. The laser ablation occurs within the upper driving chamber only, while the drug solution beneath the membrane is protected from the laser ablation. The strong bubble
22
generation in the driving chamber gives rise to an elastic deformation of the membrane which then causes an instantaneous ejection of the drug solution from a drug reservoir through a narrow micro nozzle. The microjets with a reduced jet diameter and volume per pulse, and repetitive injections have been implemented in order to achieve better performance in terms of the reliability by controlling the penetration depth and delivered drug dose.
Simultaneously, a careful analysis of the injection mechanism was carried out by studying the process of bubble expansion and microjet ejection with high speed camera. Furthermore, bubble motion in confined condition was analyzed to describe real bubble behavior inside of microjet injector. The efficiency of the present drug delivery scheme was also evaluated by injection tests on animal skin.
In conclusion, all aspects of the system including laser parameters effects on bubble growth, microjet generation and skin penetration aspects, repetitive and reliable microjet generation, bubble expansion in confined condition, laser-assisted drug delivery system have been discussed. The reported results provide a design guideline to build a reliable and functionally optimized non- invasive transdermal drug delivery system based on laser-generated microjet.
23
Chapter 2. Experimental Apparatus
Laser induced microjet is necessary to apply transdermal injection. In this study, drug delivery system based on microjet is introduced to transfer various type of drug into tissue. Microjet is accelerated up to 100 ~ 200m/s with narrow diameter by using focused laser beam in water. Explosive phase change occurs inside of microjet injector and this bubble expansion is main power source to release drug as microjet. The high speed camera provided good understand characteristics of bubble and microjet behavior as main diagnostic tool.
2.1 Laser
Powerlite (Continuum Inc.) and Spectra (Lutronic Corp.) Q-switched Nd:YAG laser are used as driving sources for microjet generation. Action (Lutronic Corp.) and Anybeam (B&B sys. Corp.) Er:YAG laser are also used.
Powerlite emits a laser pulse at maximum 3 J with 1064 nm wavelength, 9 ns duration. Spectra emits dual wavelength laser beams of 1064 and 532 nm with 7 ns pulse width. Maximum energy is 1200 and 400 mJ at 1064 and 532 nm, respectively. Action emits a laser pulse at maximum 2.2J with 2940nu wavelength, 250 μs duration. Anybeam emits a laser pulse at maximum 1J with 2940 nm wavelength and there is a variable laser pulse mode with intervals of 50 μs from 100 to 300 μs.
24
Fig. 2.1. Image of Powerlite, Continuum Inc.
Fig. 2.2. Images of Spectra (left) and Action (right), Lutronic Corp.
25
Fig. 2.3. Image of Anybeam, B&B sys. Corp.
2.2 High Speed Camera
Phantom v711 (Komi Corp.) high speed camera is used to capture the bubble and microjet motion. Widescreen 1280x800 CMOS sensor allows long time tracking of moving targets. 7,500 frames per second is possible at full resolution and maximum shooting speed is 1,400,000 (fast option). The standard exposure time is 1μs and optional 300ns exposure time mode is also available.
26
Fig. 2.4. Image of phantom, Komi Corp.
2.3 Microjet Injector
Microjet injector can be divided into two areas. The first area consists of transparent window and chamber. This window prevents the liquid in the chamber from escaping while allowing the laser beam to pass through and water is contained inside of chamber. Explosive phase change due to focused laser beam occur inside of chamber. The second part is composed of membrane and nozzle as the space filled with the drug. Water in chamber and drug in nozzle are separated by elastic membrane. This membrane transport generated momentum from chamber to nozzle while prohibit unfavorable heat transfer. . Chamber is sealed with M4 screw and O-ring to prevent any drug contamination problems and the volume of drug reservoir is 327 mm3 (327μL).
27
Fig. 2.5. Schematic and images of microjet injector
28
Chapter 3. Characteristics of Laser-generated Microjet
3.1 Bubble and Microjet Characteristics Generated by Laser
3.1.1 Background and Motivation
The use of needle-free injection may potentially remedy known drawbacks such as needle phobia and possible contamination from reuse of needles[1-3].
A drug delivery system based on the microjet can penetrate topmost skin layer by using the kinetic energy of a microjet[4, 5].
Generation of a microjet is possible in several ways. Use of an actuator based on spring, gas powered, Lorentz-force, piezoelectric element, or laser has been reported [2, 4-6]. We revisit the laser-induced microjet injector [5, 6]
where a laser beam is focused inside a small container filled with water. A bubble forms upon the laser irradiation, and expansion of the bubble pushes the membrane separating drug from driving liquid, causing fast ejection of the drug. The discharged liquid forms a jet with the typical velocity in 20–100 m/s range. The dynamics of bubble depends on laser parameters such as wavelength and pulse duration [7-9]. In particular, the resulting penetration depth, which determines performance of the microjet injector, depends on the jet velocity and jet length.
In this study, Nd:YAG and Er:YAG lasers are compared for analyzing the
29
efficiency of the microjet device. The paper is divided into two parts. First part deals with dynamics of bubble generated by the laser beams of different wavelength and pulse duration. Both dimensional and dimensionless analyses are used to understand the dependence of bubble characteristics on the laser parameters by using images taken from high-speed camera. Second part deals with the characteristics of jets and their relation to the driving bubble that allows the microjet ejection for drug delivery.
3.1.2 Experimental Approach
Two experiments that are performed are (1) formation and evolution of the laser-induced bubble in a water tank and (2) generation of the microjet. The applied lasers used are skin treatment lasers (Spectra Nd:YAG and Action Er:YAG by Lutronics Co., Korea). In both experiments, we use the same laser energy of 408 mJ, while wavelength and the pulse duration are kept different.
The Nd:YAG laser has wavelength of 1064 nm and the pulse duration of 7 ns, while the Er:YAG laser has 2940 nm wavelength and pulse duration of 250 μs.
Both lasers have built-in focusing system with focal length of 78 mm (Nd:YAG) and 67 mm (Er:YAG). The high-speed camera Phantom V710 is used for visualization.
In the first experiment, the laser is focused into the water tank of 10 5.5
5.5 cm in dimension. The difference in wavelength leads to a different penetration depth p = 1/α, where α is the absorption coefficient. For the
30
given wavelength, the optical penetration depths are 1.65 cm and 0.8 μm for Nd:YAG and Er:YAG, respectively [10]. Because of high water absorption in Er:YAG case, the bubble forms near to the water surface. In order to isolate the bubble from ambient air, the interface is kept separate by a glass (MgF2) window. The process of bubble development is recorded by the high-speed camera at 90,909 fps in the Nd:YAG case and at 28,986 fps in the Er:YAG case.
A schematic of the microjet injector experiment is given in Fig. 3.1. The laser is focused inside of the chamber which contains a driving liquid (water).
The generated bubble gives rise to chamber pressure and pushes the elastic membrane which separates the drug reservoir underneath the membrane from upper driving liquid chamber. The membrane deflection pushes the drug out of the reservoir through a nozzle. The discharging liquid forms a jet. The process of microjet development is recorded by a high speed camera at 37,016 fps in the Nd:YAG case and at 42,001 fps for the Er:YAG case, respectively.
Fig. 3.1. Schematic of the microjet generation experiment using an injector with 150μm nozzle.
31
3.1.3 Results and Discussion
The bubble dynamics is essential for the present microjet device. The expansion of the bubble starts with the formation of an initial nucleus. The nucleus is formed at a spot where the optical breakdown occurs. The energy of the laser pulse per unit area increases toward the focal point and the laser energy density reaches breakdown threshold at some distance. The shape of the bubble nuclei is far from spherical because it is affected by the spherical aberrations [11].
The behavior of the bubble triggered by the Er:YAG beam is distinct from that of Nd:YAG. Since the optical penetration depth is much shorter for Er:YAG laser, the beam cannot penetrate deeper into the water. Instead, the bubble starts growing from the water surface. A transparent window is used to keep the vapor from escaping and to prevent the pressurized gas inside the bubble from interacting with the water surface.
The sequential images of the bubble development in both cases are given in Fig. 3.2. The temporal evolution of the bubble radius is given in Fig. 3.3 with black dots where vertical bars illustrate the error. The behavior of the bubble which is triggered by Nd:YAG laser is typical to that observed in many studies, while Er:YAG case is seemingly distinct.
32
Fig. 3.2. Sequential images of bubble expansion for Nd:YAG (top panels) and Er:YAG (bottom panels) cases
33
Fig. 3.3. Measured bubble radius as function of time for Nd:YAG (a) and Er:YAG (b) cases with analytical approximation given by the solid line
The temporal dependence of the radius in Nd:YAG case can be approximated with a well-known equation:
1/ 3 0 max
( )
sin
l
t t
R R
(3.1)
where l = 249 ± 18 μs is the bubble lifetime, t0 is the shift between the first captured image and the start of the bubble expansion. The high speed camera and the laser are not synchronized so that t0 27.02 μs and t0 23.81 μs in Nd:YAG and Er:YAG cases, respectively. The approximation given by Eq.
(3.1) is illustrated in Fig. 3.3(a) with the solid red line. Maximum radius is
34
estimated as Rmax = 1.530.08 mm with Eq. (3.1)for the Nd:YAG case. The average velocity Rcan be estimated as
2 max l
R R
(3.2)
Using R and Rmax, we estimate the inertia timescale in
max in
R
R (3.3)Combining (3.2) and (3.3) leads to in = 0.5l. For Nd:YAG case, the pulse duration is much shorter than the inertia timescale, so that the laser energy is assumed to be transformed (deposited) into the bubble energy instantly.
In Er:YAG case, the pulse duration
= 250 μs is comparable with the bubble lifetime. The bubble reaches the maximum diameter when the laser pulse is over, so that formation of the bubble nuclei was observed during half of the life time. The detailed description of this stage requires explicit description of the processes such as absorption, ionization and recombination.However, we found that the temporal evolution of the radius during a pulse duration can be approximated by the following power-law dependence
1/ 2
(
0)
RC t tR (3.4)
35
where CR = 0.1253 ± 0.0009 and t0 = 23.8 ± 1 μs is the time shift between the first captured image and the start of the laser pulse. This dependence is illustrated in Fig. 3.3(b) with the solid blue line. The power in Eq. (3.4) is the same as in the Plesset and Prosperetti [12] equation which describes the temporal evolution of the vapor bubble:
1/ 2
1/ 2 1/ 2
12
l bv l
k T T
R t
L D
(3.5)
where Tb is the boiling temperature, v=
v( )
Tb is the equilibrium vapor density at the boiling temperature, L is the latent heat, Dl is thermal diffusivity and kl is the conductivity. Adopting typical values of L, Dl, and kl, we estimate T = 156℃. Therefore, the expansion of the bubble is similar to a vapor bubble which expands in superheated liquid. While initial stage is strongly affected by the thermal effects in Er:YAG case, the collapse of the bubble and its subsequent rebound is typical for cavitation bubble in both cases.The mechanism of the jet formation in the microjet device can be described as follows. The laser is focused at the driving liquid (water) inside of a chamber, the laser induces formation of the bubble, the bubble expansion increases the pressure inside of the chamber, the increment of the pressure leads to the deflection of the elastic membrane and the membrane pushes the drug in the reservoir out through the nozzle. The discharging liquid forms a jet shown in Fig. 3.1. Figure 3.4(a), 3.4(b) are the sequential images of microjet
36
development for Er:YAG and Nd:YAG cases, respectively.
Fig. 3.4. Sequential images of microjet for Er:YAG (a) and Nd:YAG (b) cases
37
The velocity of the jet and breakup length are important parameters which determine the skin penetration ability when dealing with transdermal drug delivery. The average velocity of the jet generated by Nd:YAG laser is 74 ± 8 m/s while for Er:YAG case, the velocity is 28 ± 4 m/s. Since the main driving mechanism of the jet generation is bubble expansion, the difference in estimated jet velocity can be explained in terms of the average growth rate of the bubble. The average growth rate is twice higher when the bubble is triggered with Nd:YAG laser than that with Er:YAG one, while the life time is comparable. This leads to a higher pressure gradient in Nd:YAG case and consequently, to a higher jet velocity.
The microjet which is generated by Nd:YAG laser breakups into small drops earlier comparing to that for Er:YAG case. The ratio of breakup length to nozzle diameter is 36.9 ± 8.9 and 67.1 ± 0.4 for Nd:YAG and Er:YAG, respectively. The nozzle diameter is 150 μm. Such behavior of liquid jets imply that they belong to a common jet regime where the breakup length decreases with the jet velocity. In this regime, the aerodynamic force is the main factor which induces atomization process. Aerodynamic effects acting on the microjet can be seen from the jet head shape which is illustrated in Fig.
3.4(a) and 3.4(b).
38
3.2 Penetration Using Nd:YAG Laser-generated Microjet
3.2.1 Background and Motivation
In transdermal drug delivery systems, external forces breach the skin barrier (stratum corneum) and deliver drugs into the underlying viable epidermis [13- 16]. While utilizing the kinetic energy of an accelerated jet via the ballistic method, microjets with a reduced jet diameter and jet volume achieve better performance in terms of the reliability of delivery dose and depth by reducing splash-back. Moreover, laser energy in the laser-based method can provide a faster jet, which would exceed speeds obtained by other means of generating microjets [6].
The outer dermal layer called the epidermis is an important site for painless drug delivery because it lacks blood vessels and sensory nerve endings.
Systemic drug delivery through the skin has been used since the introduction of transdermal scopolamine patches for treating motion sickness [2]. This type of delivery creates micro-pores using several different methods, and drugs are delivered actively through the pores. A micro-needle patch has an array of microscopic needles which creates micron-scale pathways into the skin [13].
In other techniques, micro-pores are created via a vaporization process or the reversible disruption of lipid bilayer structures in the skin using electric pulses or ultrasound [13, 17].
Ballistic methods based on a liquid jet or a powder jet deliver drugs directly, with a reduced release time. Liquid jet injectors generate a high-velocity jet
39
with a small diameter of greater than 100 μm while powder jet injectors deliver drugs in their dry form. Contrary to expectations, liquid jet injectors have the potential for cross-contamination from splash-back during injection If the speed is not fast enough and is not a narrow jet, resulting in poor reliability of delivery dose and depth, and insignificant or no reduction in pain [18]. As an improvement, Arora et al. [16] introduced a piezoelectric transducer to generate a pulsed microjet. The microjet with a reduced injection diameter and volume improved jet performance but with a limited penetration depth of up to 200 μm. It is to be noted that the epidermal layer of the human skin extends from 100 to 400 μm below the outer layer and in the animal skin, particularly the guinea pig’s abdominal skin, it extends from 40 to 200 μm.
A micro-jet injector (see Fig. 3.5) consists of a micro-nozzle with liquid drugs of various viscosities, a driving fluid with 3 % salt concentration, a heat-resistant flexible elastic membrane separating the liquid drug from the driving fluid and confinement glass. A high energy nanosecond infrared laser beam pulse generates a shock wave which is released in a few tens of microseconds upon the laser irradiation. Approximately 150 μs later, the diameter of the cavitation bubble in the driving fluid reaches its maximum before the bubble starts collapsing. The displaced volume of driving liquid, in correspondence with the degree of bubble expansion in the driving liquid, then pushes the elastic membrane separating the blue driving fluid from the yellow liquid drug (see Fig. 3.5(a)).
The resulting high pressure stretches the elastic membrane, and the drug
40
content inside the nozzle is squeezed out of the nozzle at high velocity, reaching 230 m/s before breakup. The instant pressure peak during the single laser pulse based cavitation process may reach several thousand bars, which results in 2–3 squirts of micro-jets within 150 μs. Previously, degassed water was successfully injected into 3–5 % gelatin samples and a pig fat tissue sample, verifying the feasibility of the needleless transdermal drug delivery scheme, which is both dose and depth controlled by a laser beam pulse [19].
In this study, we demonstrate that our method of laser based microjet drug delivery is capable of penetrating a guinea pig’s skin tissue sample to deliver a controlled dose of a drug to the targeted region 10–400 μm beneath the outermost layer of the skin. Imaging of the skin after injection of fluorescein isothiocyanate and biotin revealed that the epidermal and dermal layers were stained well below 60 μm underneath the outer layer of the abdominal guinea pig’s skin sample.
3.2.2 Experimental Approach
A Q-switched Nd:YAG laser beam was focused within the driving fluid by a set of three lenses (bi-convex: focal length 50 mm; plane-convex: focal length 145 mm; and plane concave: focal length 100 mm). Laser energy was varied from several hundred milli-joules up to 3 J to identify the optimal energy needed for delivery. Three percent salt water was used in the driving liquid chamber for maximization of atomic breakdown as well as for generation of
41 strong cavitation.
A gelatin gel was used as the skin model. The gelatin (Geltech Co. Ltd., Korea) of 60 bloom was dissolved in 70 ◦C water at 3–7 percent. The bloom number, a measure of surface tension, indicates the toughness of gels. Liquid gelatin samples were poured into a 4 × 4 × 4 cm3 acrylic box and cooled at 5
◦C for 1 h.
The injection liquid was prepared by dissolving fluorescein isothiocyanate (FITC, 0.05 mg/ml) and biotin (0.1 mg/ml) in a dimethyl sulfoxide (DMSO) solution. Both FITC and biotin were used to verify the performance of micro- jet penetration. The positive controlled skin from the FITC test was analyzed using a fluorescence microscope (Nikon Eclipse Ti-U) and the immunohistochemistry (IHC) method was used to monitor the biotin staining of the skin layer.
A male Hartley guinea pig was purchased from Reference Biolabs (Seoul, Korea). The guinea pig was between 250 and 260 g in weight. A skin sample of the guinea pig abdomen was first disinfected in a phosphate-buffered saline (PBS) solution before sectioned into a 15×15 mm target. The skin was epilated with wax for 24 hours before sectioning. The prepared skin sample was affixed on a foam board with pins, as shown in Fig. 3.5(b).
42
Fig. 3.5. (a) Basic mechanism of micro-jet formation based on the elastic membrane response to bubble expansion; (b) the abdominal guinea pig skin sample for micro-jet injection; (c) handheld injector for projected skin therapy
43
3.2.3 Results and Discussion
The target toughness was varied to identify the optimal laser energy for penetration. A range of gelation concentration from 3 to 7 % was considered for the test target. 7 % gelatin replicated the toughness of animal skin. Figure 3.6 (a) shows the penetration depth measurements for various levels of target toughness. Laser energy above 1400 mJ per pulse was required to successfully penetrate 7% gelatin, whereas lower laser energy ranging from 400 to 1200 mJ was required to reach 400–1800 μm in depth for softer targets.
The drug viscosity was varied. De-gassed water and hyaluronic acid (HA) filler with viscosity which is 10 times greater than that of water were injected into a gelatin (3 %) target. As shown in Fig. 3.6 (b), even at much higher viscosity, the HA solution of a common anti-wrinkle filler showed only about 20% decrease in the resulting penetration depth.
44
Fig. 3.6. Penetration depth measured: (a) different target toughness; (b) 1×
and 10× drug viscosities
Conventional light microscopy of the guinea pig abdominal skin sample was used to evaluate the drug delivery efficiency. Two types of staining techniques were adapted to verify the transdermal delivery of a liquid drug into a skin sample. A fluorescent microscope was used to analyze the injected fluorescein dye in the epidermis and dermis, and biotin IHC staining was used to confirm the additional content of the biotin protein in the cellular region of the guinea pig dermis.
Figure 3.7 demonstrates IHC micrographs of skin from the guinea pig abdomen, showing the cross-sections of epidermis and dermis. Biotin is a water-soluble B-complex vitamin which is naturally present in uncontrolled skin, as shown in Fig. 3.7 (a). With the addition of biotin delivered by a micro-jet, we expected to see an enhanced level of staining. The epidermis
45
and thick bundles of collagen are visible in Fig. 3.7 (b) and (c) for the (+) control groups. The existence of biotin in the (−) control result (Fig. 3.7 (a)) suggests the selection of an alternative substance, such as FITC, for further identification of the delivered drug dose in the epidermal layer.
46
Fig. 3.7. Biotin IHC results showing natural, maximum, and positive staining results for (a) no control, (b) regular syringe, and (c) micro-jet injection
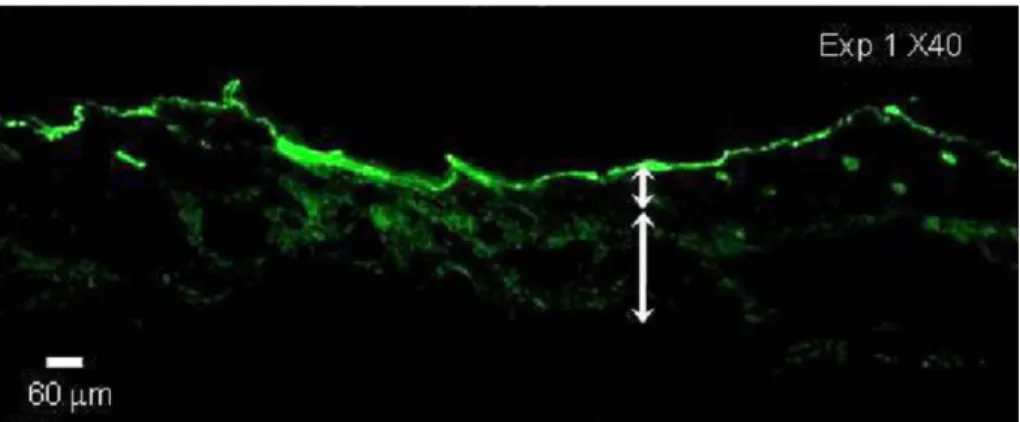
In the laser-assisted micro-jet injection (Fig. 3.8), we noticed well spread sites of FITC in the epidermis and the uniform distribution of fluorescence several tens of microns deeper in the dermal layer. More than 10 pulses of microjets amounted to about 1 μl of FITC solution were applied to achieve uniform distribution of the administered dose in the target region of the guinea pig skin sample. No hot spot of coagulated drug was seen; instead, a smoothly distributed stain of FITC was observed, as in the microscope image shown in Fig. 3.8.
Fig. 3.8. Transdermal FITC staining results: the guinea pig’s abdominal skin treated with micro-jet injections. The epidermis extends up to 60 μm, and
staining shows the uniform distribution of fluorescence well below the epidermal layer
47
The vapor formed upon laser focusing in the driving fluid above the rubber membrane has a low density, and the latent heat flow effect is not important.
The inertia of the liquid plays the dominant role in the generation of the cavitation bubble; the process of bubble expansion and collapsing due to the pressure gradient across the interface separating the liquid and vapor phase becomes significant. During this isothermal expansion and collapse, the pressure gradient across the bubble interface controls the dynamics of interface motion governed by the following relation [20]:
2
1/ 23
Pv P dRdt
(3.6)
where R is the bubble radius; t is time; Pv and P∞ are pressures of the inner and outer bubble interface, and ρ is the fluid density. Figure 3.9 shows snapshot images taken under 408 mJ irradiation in water, resulting in a maximum bubble diameter of 3.2 mm at 151 μs.
48
Fig. 3.9. Sequential images of cavitation bubble growth and collapse inside the driving fluid of a micro-jet injector. The maximum bubble size of
3.22 mm is achieved at 151 μs
The images captured during the Nd:YAG laser-induced cavitation bubble expansion inside the chamber indicate the approximate time duration in which the microjet was ejected. After a focused laser pulse was delivered, 7 ns later bubble expansion starts from the optical breakdown point. Vapor and non- condensable gas reduce the rate of heat transfer between the hot breakdown point and cold liquid. As the bubble expands, the increased chamber pressure exerts tensile loading on the chamber and ultimately the elastic membrane that effectively ejects the drug into the reservoir below, out from the micro-nozzle at several hundred meters per second.
The cavitation bubble formation (shock generation) and expansion result in the ejection of a high-speed micro-jet out of the nozzle as visualized in Fig.
3.10. Increasing the micro-jet breakup length helps to delay atomization,
49
causing a clean jet head impact on the target surface and allowing deeper and more efficient delivery of the drug to the targeted depth beneath the skin surface. In all the animal tests, we allowed less than 2 mm standoff distance between the target and the injector, and therefore the resulting micro-jets were expected to be stable and free from atomization, ensuring good penetration efficiency.
Fig. 3.10. (a) The first jet due to a shock wave shown with a breakup length of 5.47 mm, (b) the second jet resulting from the bubble expansion shown
with a breakup length of 3.53 mm
Furthermore, the characteristics of the observed microjet driven by the Nd:YAG laser system were analyzed. The calculated Reynolds and Weber numbers based on the nozzle diameter (Table 3.1) suggest that the present micro-jet is a fully developed turbulent jet. The gaseous Weber number of both the first and second microjets is well above the critical Weber number of 0.4 [21], suggesting that the breakup length is inversely proportional to the jet
50
velocity. The key to stable penetration of a micro-jet into a tissue is the breakup length ‘long enough’ to delay any disintegration of the liquid jet body into droplets, as clearly is the case in our animal tests.
Table 3.1. Calculated Reynolds and gaseous Weber numbers for the Nd:YAG- driven micro-jet
Re Weg
1st jet due to shock wave 11,078 13.5 2nd jet due to bubble growth 7081 7.8
3.3 Penetration Using Er:YAG Laser-generated Microjet
3.3.1 Background and Motivation
The laser-based microjet injection system uses the hydrodynamic impact of a narrow liquid jet onto skin. The immediate delivery would enable minimized prescription of topical drugs intended to work on the outer layers of the skin, avoiding any skin irritation or allergic reaction and preventing uncontrolled evaporation of active ingredient and unpleasant odor associated with noninvasive procedures. Several types of injection mechanism have been considered, including spring compression, expansion of piezoelectric transducer, linear Lorentz force driven piston actuator, and expansion of laser- initiated waves in water [6, 22, 23]. Such mechanisms would eliminate
51
abundant needle wastes, and they are favored for highly needle-phobic patients [3].
A narrow, high pressure jet of 100 to 200 m/s velocity is required to accelerate the drug to penetrate the animal skin with 20 MPa of yield strength [3]. Reducing the jet diameter to a 100 μm size has shown the advantage in drug delivery of minimizing damage to the tissue [22]. The present scheme of injection via Er:YAG laser beam at 250 μs pulse duration generates pressure by the displacement of liquid via laser-induced vapor bubbles and the elastic pumping of the drug through a nozzle by a membrane separating the driving liquid from the drug.
Success in jet injection requires sufficient impulse of the jet to penetrate the target tissue. In the case of an Nd:YAG laser at 7 ns pulse duration, high irradiance of a Q-switched beam produced instantaneous expansion of bubbles and generated multiple shockwaves [6]. The consequent jets due to both shock and bubble expansion reached up to 230 m/s while the short length of the jet is insufficient for ensuring a sizable dose of drug targeting a treatment site.
Here we adopted a quasi-long pulsed Er:YAG beam at 250 μs to power source of injector. The high absorbance of the beam to water (2940 nm) also enables a stronger generation of a jet at lower laser energies. We present the enhanced controllability and dosage of delivered drug into a guinea pig’s skin through fluorescent staining on both postmortem abdominal and living dorsal skins. Furthermore, to verify test results, the Plesset equation of the vapor bubble theory has been adopted to confirm the measured jet velocity resulting
52 from the laser-initiated microjet.
3.3.2 Experimental Approach
When the low irradiance laser energy reaches the driving liquid in the upper chamber of the injector [6], the temperature rise in a focal point in water admits a sudden vaporization and generation of a vapor bubble [20]. The process of constant pressure phase transformation is marked by a superheated liquid formation of vapor voids. The Er:YAG laser has 250 μs pulse duration and wavelength of 2940nmat which water best absorbs the beamed energy.
Once vapor is accumulated in the bubble, any additional radiation passes through the expanding bubble without being directly absorbed by the vapor.
Elongation of the bubble discontinues as the initiation of the bubble stabilizes beyond 250 μs and reaches a maximum radius.
We adopt explosive bubble expansion induced by a laser irradiation as an actuator for ejecting a coherent microjet. The present injector consists of a micro nozzle for storing liquid drug, a chamber for driving fluid separated by a heat resistant flexible membrane between drug and water, and air-tight confinement glass at the beam incident and with O-ring type sealing. A highly water absorbant Er:YAG beam irradiates the water for vapor bubble generation within the driving liquid chamber. Ideally sealed in the chamber, growth of the bubble would cause a sizable pressure impulse on the elastic membrane. The elastic response of the membrane ejects liquid drug out from
53
a 150 μm nozzle at a velocity needed to penetrate skin.
In Fig. 3.11(a), the ejected jet shown in an air background reaches up to 30 m/s, which has larger injection volume than the speed previously attainable by a nanosecond pulsed Nd:YAG laser system [6]. The laser system offers various jet properties with a change in laser energy. The flow through a narrow nozzle experiences turbulent and frictional losses. Figure 3.11(b) indicates that friction at the nozzle exit causes velocity reduction in the region below 800 mJ and the turbulence shortens the jet length in the region beyond 800 mJ [24]. The instability causes spray and a decrease in energy of the jets, a process known as atomization. In all injections of the present scheme, the stand off distance between the nozzle and the skin is less than 3 mm to avoid any instability due to these jet properties.
(a)
54
Fig. 3.11. Ejected microjet in air, (a) Images of Er:YAG microjet at 408 mJ, 250 μs pulse duration showing jet velocity of ~ 30 m∕s, (b) Jet velocity shown
for varying laser energy E 0.5 (
r u t2) jet .The injection liquid was prepared by dissolving fluorescein isothiocyanate (FITC, 0.05 mg ∕ml) in dimethyl sulfoxide (DMSO) solution for verifying microjet penetration performance. The treated skin from the FITC test was analyzed by a fluorescence microscope (Nikon Eclipse Ti-U), and hematoxylin and eosin (H&E) staining was used to monitor alteration of tissue after injection.
The stained skin samples were frozen and chopped by cryotome (Leica).
Three pieces of a sample were made with the injection point being the center.
Each cross section was vertical to the injected area and made into a slide to
(b)
55
analyze with a microscope. The embedded sites of fluorescent trace observed with the microscope would confirm drug penetration and the range of spread underneath the outer skin layer.
A male Hartley guinea pig was laid on a table to perform jet injection on the back for a dorsal skin test. In the abdominal case, the relevant skin was first sectioned into a 15 × 15 mm target and cleaned to remove fat and subdermal tissues. The prepared skin sample was affixed on a foam board with pins. The laser irradiated the driving fluid, and the jet was ejected from the nozzle vertically to a target material. The guinea pig used was 250 grams of weight.
The skin was epilated with wax for 24 h before the experiment and immediately used without freezing.
For the skin mockup for instant visualization of penetration, a gelatin gel was used, which offers controllable mechanical properties depending on its weight percent. Gelatin of 60 Bloom was dissolved in water at 5 percent. The Bloom number indicates the toughness of gels, and 60 meets the typical animal skin toughness.
3.3.3 Results and Discussion
Figure 3.12 is the staining result on a sectioned sample of guinea pig abdominal skin. The fluorescence is dispersed in all directions around an impact point. The microjet initiated with a 1.19 J laser beam delivers the drug over the epidermis and dermis within 280 μm from the skin (Fig. 3.13).
56
Figure 3.13 shows the results of microjet injection on dorsal skin as administered on a living guinea pig laid on a table. The drug is evenly dispersed on the skin tissue similar to the abdominal case. The dorsal skin is thicker (500 μm) than the abdominal skin such that deeper wetting of the relevant layers is effectively treated with FITC.
The H&E staining shown in the upper-right windows after microjet injection displays the architecture of the treated sites, and it shows that the drug is delivered with no alteration of skin morphology adjacent to the injection site.
The microjet initiated with a 1.57 J laser beam, however, achieves a targeted local delivery rather than dispersion [Fig. 3.13(b)]. Unlike the abdominal case of a sectioned sample affixed to an acrylic plate, the underlying structure of dorsal skin supports jet propagation, allowing a deeper penetration. Even though the injection spot had been ruined following the path of a jet, these microstructural changes are expected to be recovered by the barrier recovery process [25].
Fig. 3.12. FITC staining of guinea pig abdominal skin treated with
57 1.19 J ∕pulse.
Fig. 3.13. FITC staining of guinea pig dorsal skin treated with (a) 1.19 J ∕pulse and (b) 1.57 J ∕pulse
The jet produced with 1.19 J of laser pulse showed smaller volume than the case of 1.57 J. The jet energy is mostly dissipated at the upper layer of skin.
However, increased jet energy reaches deeper layers of skin with higher energy. The jet energy is converted to deformation of the skin barrier or
(b)
(a)
58
propagation of the stress wave depending on the skin properties. The jet achieves farther delivery of drugs when more energy is converted to deformation energy than to stress wave.
Gel models are used for visualization and mimicking of the skin elasticity to evaluate jet injection. Jet injection consists of three events: jet impingement, absorbed into the skin, and dispersion under skin [Fig. 3.14(a)]. Jet impact creates a hole on the gel with an estimated impact pressure or water hammer pressure from Eq. (3.7), where the impact pressure depends on the sound velocity a as well as the jet velocity ujet. Then at a lower jet pressure proportional to the square of the velocity, the ejected dose is delivered into the gel making a path of jet stream. A thin cylindrical jet of 150 μm generated from an injector causes virtually zero splash-back at the contact surface as seen in Fig. 3.14(a), allowing smooth penetration. In gel models, the dense structure with no porosity forces the jet to agglomerate and causes bounce of the drug in the gel:
0 jet
P
u a (3.7)This is the pressure needed to overcome the ultimate strength of a target for the surface erosion. For a typical skin strength of 20 MPa, Eq. (3.7) suggests a minimum jet velocity of 13 m∕s for water density 1000 kg/m3 and sound speed of 1500 m/s in water.
59
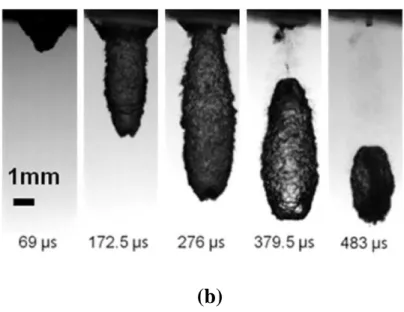
Fig. 3.14. (a) Microjet injection shown with no splash-back, 150 μm diameter, and gel penetration of drug at 408 mJ. (b) penetration depth and width for
varied laser energy.
The penetrated depth and injected volume are evaluated with varying laser energy on a gel model [Fig. 3.14(b)]. The penetrated depth increases as the
(b)
(a)
60
laser energy is intensified up to 800 mJ. At 600 mJ, the injection efficiency is reduced due to the recovery response of the gel. Above 800 mJ, increased jet velocity shortens the jet length according to the jet breakup. The spray characteristic and instability of the weakening jet beyond a high critical Weber number may be responsible for this observation.
The jet velocity may be analytically determined. We consider a 408 mJ (low- energy) case for illustration purposes. We used the empirical data for temporal development of the bubble radius and the Rayleigh–Plesset approximation [12] to estimate the pressure and temperature gradients on the driving liquid wall for jet ejection. For vapor bubbles, the thermal effects play a dominant role and the effect of liquid inertia can be neglected. The Plesset model considers the evaporation and the heat conduction. The temporal evoluti