저작자표시-비영리-변경금지 2.0 대한민국 이용자는 아래의 조건을 따르는 경우에 한하여 자유롭게
l 이 저작물을 복제, 배포, 전송, 전시, 공연 및 방송할 수 있습니다. 다음과 같은 조건을 따라야 합니다:
l 귀하는, 이 저작물의 재이용이나 배포의 경우, 이 저작물에 적용된 이용허락조건 을 명확하게 나타내어야 합니다.
l 저작권자로부터 별도의 허가를 받으면 이러한 조건들은 적용되지 않습니다.
저작권법에 따른 이용자의 권리는 위의 내용에 의하여 영향을 받지 않습니다. 이것은 이용허락규약(Legal Code)을 이해하기 쉽게 요약한 것입니다.
Disclaimer
저작자표시. 귀하는 원저작자를 표시하여야 합니다.
비영리. 귀하는 이 저작물을 영리 목적으로 이용할 수 없습니다.
변경금지. 귀하는 이 저작물을 개작, 변형 또는 가공할 수 없습니다.
이 학 박 사 학 위 논 문
Identification of adaptive signatures and genomic features in response to selective
pressure in mammals
포유류 유전체 내 선택압에 의한 적응 흔적 및 특성 발굴
2019 년 8 월
서울대학교 대학원 협동과정 생물정보학과
김 권 도
Identification of adaptive signatures and genomic features in response to selective
pressure in mammals
By
Kwondo Kim
Supervisor: Professor Heebal Kim
Aug, 2019
Interdisciplinary Program in Bioinformatics
Seoul National University
포유류 유전체 내 선택압에 의한 적응 흔적 및 특성 발굴
지도교수 김 희 발
이 논문을 이학박사 학위논문으로 제출함 2019 년 6 월
서울대학교 대학원 협동과정 생물정보학과
김 권 도
김권도의 이학박사 학위논문을 인준함 2019 년 6 월
위 원 장 김 선 (인) 부위원장 김 희 발 (인) 위 원 한 재 용 (인) 위 원 조 서 애 (인) 위 원 유 재 웅 (인)
i
Abstract
Identification of adaptive signatures and genomic features in response to selective
pressure in mammals
Kwondo Kim Interdisciplinary Program in Bioinformatics The Graduate School Seoul National University
The central goal of evolutionary biology is to understand the genetic basis of evolutionary processes and adaptive traits. In this regard, the recent advances in sequencing technologies and the explosion of sequence data provide a better opportunity to reach this goal. Various genomic variations are now easily and precisely obtained for large-scale of samples. They are expanding the scope of typical genomic studies, allowing us to take into account diverse evolutionary processes. The aim of this thesis is to demonstrate the applications of such genomic variations while taking into account diverse evolutionary scenarios and time scales. As such, this thesis will fill in the gaps in the knowledge of mammalian genetic background underlying adaptive traits through genome- wide scan and comparative genome analysis.
ii
This thesis consists of five chapters and includes results of genome analysis for detecting evolutionary signatures in three mammal species;
pinnipeds, primates, and cattle. The basic background, terminologies and recent example studies related to this thesis were introduced in chapter 1. Chapter 2 and 3 focused on divergence between species (macroevolution), while chapter 4 and 5 focused on polymorphism within species (microevolution).
Pinnipeds are a remarkable group of marine animals with unique adaptations to semi-aquatic life. However, their genomes are poorly characterized. In chapter 2, evolutionary signatures of pinnipeds have been investigated using amino acid substitutions. Novel genome assemblies of 3 pinniped species; Phoca largha, Callorhinus ursinus, and Eumetopias jubatus have been generated. These genome assemblies have been used to detect rapidly evolving genes and substitutions unique to pinnipeds associated with their specificities. As a result, unique substitutions were found within the TECTA gene and are likely related to the adaptation to amphibious sound perception in pinnipeds. In addition, several genes (FASN, KCNA5, and IL17RA) containing substitutions specific to pinnipeds were found to be potential candidates of phenotypic convergence in all marine mammals. It indicates the weak link between molecular and phenotypic convergence, and confirms the results of previous studies. This study provides candidate targets for future studies of gene function, as well as backgrounds for convergent evolution of marine mammals.
iii
Humans have the largest brain among extant primates with specialized neuronal connections. However, how the human brain rapidly evolved compared to that of closely related primates is not fully understood. In chapter 3, a genome-wide survey has been performed to find an explanation for the rapid evolution of human brain. Based on the hypothesis that tandem repeats could play a key role in introducing genetic variations due to their unstable nature, a genome-wide survey detected 152 human-specific TRs (HSTR) that have emerged only in the human lineage. The HSTRs are associated with biological functions in brain development and synapse function, and the expression level of HSTR-associated genes in brain tissues was significantly higher in human than in other primates. These results suggest a possibility that de novo emergence of TRs might have contributed to the rapid evolution of human brain.
The genetic history of cattle is complex, but contains plentiful information to comprehend mammalian evolutionary process such as domestication, and environmental adaptations. In chapter 4, the genomic influence of recent artificial selection has been examined in the case of Korean native cattle, Hanwoo. Using runs of homozygosity (ROH), an increase of inbreeding for decades has been shown, and at the same time, it has been demonstrated that inbreeding has been of little influence on body weight trait. In chapter 5, admixture between two cattle populations; Bos taurus, and Bos indicus has been examined in Indigenous African cattle populations., Several evidences based on single nucleotide polymorphism (SNP) support that adaptive admixture is at
iv
the root of the success of African cattle’s rapid dispersion across African continent.
The findings in this thesis demonstrated applications of various genomic variations under diverse evolutionary scenarios and time scales, and thus may contribute to the understanding of evolutionary processes in mammals.
Key words: genomic variation, evolution, adaptation, positive selection, introgression, mammal
Student number: 2016-30124
v
Contents
ABSTRACT ... I CONTENTS ... V LIST OF TABLES ... VII LIST OF FIGURES ... IX GENERAL INTRODUCTION... XIV
CHAPTER 1. LITERATURE REVIEW... 1
1.1GENOMIC VARIATIONS ... 2
1.2SIGNATURES OF POSITIVE SELECTION ... 7
1.3SIGNATURES OF INTROGRESSION ... 13
CHAPTER 2. DECIPHERING THE EVOLUTIONARY SIGNATURES OF PINNIPEDS USING NOVEL GENOME SEQUENCES: THE FIRST GENOMES OF PHOCA LARGHA, CALLORHINUS URSINUS, AND EUMETOPIAS JUBATUS ... 17
2.1ABSTRACT ... 18
2.2INTRODUCTION ... 19
2.3MATERIALS AND METHODS ... 23
2.4RESULTS ... 37
2.5DISCUSSION... 66
CHAPTER 3. DE NOVO EMERGENCE AND POTENTIAL FUNCTION OF HUMAN-SPECIFIC TANDEM REPEATS IN BRAIN-RELATED LOCI ... 70
3.1ABSTRACT ... 71
3.2INTRODUCTION ... 72
3.3MATERIALS AND METHODS ... 75
3.4RESULTS ... 89
3.5DISCUSSION... 109
CHAPTER 4. ARTIFICIAL SELECTION INCREASED BODY WEIGHT BUT INDUCED INCREASE OF RUNS OF HOMOZYGOSITY IN HANWOO CATTLE ... 114
vi
4.1ABSTRACT ... 115
4.2INTRODUCTION ... 116
4.3MATERIALS AND METHODS ... 121
4.4RESULTS ... 128
4.5DISCUSSION... 150
CHAPTER 5. THE MOSAIC GENOME ARCHITECTURE OF INDIGENOUS AFRICAN CATTLE AS A UNIQUE GENETIC RESOURCE FOR ADAPTATION TO LOCAL ENVIRONMENTS ... 154
5.1ABSTRACT ... 155
5.2INTRODUCTION ... 157
5.3MATERIALS AND METHODS ... 161
5.4RESULTS ... 174
5.5DISCUSSION... 199
GENERAL DISCUSSION ... 204
REFERENCES ... 207
요약(국문초록) ... 234
vii
List of Tables
TABLE 2.1SUMMARY OF SEQUENCING DATA... 27
TABLE 2.2SUMMARY OF ASSEMBLY STATISTICS (>2000BP) ... 39
TABLE 2.3SUMMARY OF GENOME ASSESSMENT RESULTS ... 40
TABLE 2.4SUMMARY STATISTICS FOR REPEAT ELEMENTS ... 41
TABLE 2.5SUMMARY STATISTICS OF GENE PREDICTION RESULTS ... 42
TABLE 2.6SUMMARY OF FUNCTIONAL ANNOTATION RESULTS ... 43
TABLE 2.7GENE ONTOLOGY (GO) ENRICHMENT ANALYSIS OF PINNIPEDS SPECIFIC GENE FAMILIES (P-VALUE <0.05) ... 49
TABLE 2.8GENES WITH ACCELERATED EVOLUTION IN THE PINNIPED LINEAGE. H1_FG_OMEGA: DN/DS VALUE (Ω) ON FOREGROUND GIVEN H1(Ω VARIES ACROSS THE BRANCHES);H0_LNL: LOG LIKELIHOOD GIVEN H0(Ω DOES NOT VARY ACROSS THE BRANCHES);H1_LNL: LOG LIKELIHOOD GIVEN H1;H0_LNL: LOG LIKELIHOOD GIVEN H0 ... 53
TABLE 2.9GENES WITH SEQUENCE CHANGES LIKELY TO OCCUR IN ONLY THE PINNIPED LINEAGE WHEN GENE-LEVEL CONVERGENCE TOOK PLACE IN MARINE MAMMALS. H1_FG_OMEGA: DN/DS VALUE (Ω) ON FOREGROUND BRANCHES GIVEN H1(Ω VARIES ACROSS THE BRANCHES);H0_LNL: LOG LIKELIHOOD GIVEN H0(Ω DOES NOT VARY ACROSS THE BRANCHES);H1_LNL: LOG LIKELIHOOD GIVEN H1. ... 64
TABLE 3.1INFORMATION OF 24 HIGH COVERAGE DATA FROM 1000 GENOME PROJECT (CONSORTIUM 2015) ... 79
TABLE 3.2INFORMATION OF RNA-SEQUENCING DATA FROM SRP007412(BRAWAND, SOUMILLON ET AL.2011) ... 82
TABLE 3.3INFORMATION OF RNA-SEQUENCING DATA FROM GSE86207(MORA- BERMÚDEZ,BADSHA ET AL.2016). ... 84
TABLE 3.4INFORMATION OF 49CHIP-SEQ DATA FROM ENCODE DATABASE (CONSORTIUM 2007) ... 86
TABLE 3.5THE NUMBER OF LOCI SATISFYING THE CRITERIA FOR ORTHOLOGOUS FLANKING SEQUENCES.THE FIGURES INDICATE THE NUMBER OF LOCI SATISFYING OR NOT SATISFYING CRITERIA IN EACH FILTERING STEP (SEE MATERIALS AND METHODS).RBH: RECIPROCAL BEST HITS ... 91 TABLE 3.6THE NUMBER OF TR LOCI THAT DID NOT PASS CRITERIA FOR DETERMINING
HSTR.THE FIGURES IN EACH COLUMN INDICATE THE NUMBER OF LOCI THAT DID NOT PASS EACH CRITERIA.LENGTH CRITERIA ARE:1)HUMAN TR(HTR) LENGTH ≥ INTERVENING SEQUENCE (IS) LENGTH IN NHP*2 AND 2)HTR LENGTH –IS LENGTH IN NHP≥ UNIT LENGTH OF HTR.IDENTITY SELECTS LOCI WITH PERCENT IDENTITY >95% BETWEEN SEQUENCE UNITS OF THE HTR AND IS IN NHP.TABLE INDICATES THE NUMBER OF HSTRS THAT REMAIN AFTER FILTERING TRS THROUGH
viii
THE PREVIOUS THREE CRITERIA (“LENGTH &IDENTITY”,“LENGTH” AND
“IDENTITY”) ... 92
TABLE 3.7THE NUMBER OF MICROSATELLITES (UNIT LENGTH ≤10BP) THAT DID NOT PASS CRITERIA FOR DETERMINING HSTR ... 93
TABLE 4.1CANDIDATE REGIONS ASSOCIATED WITH YEARS.STATISTICAL TEST USING ANALYSIS 1 WAS PERFORMED.ONLY THE REGIONS WITH PVALUE LESS THAN 0.01 ARE SHOWN ... 143
TABLE 4.2CANDIDATE REGIONS ASSOCIATED WITH CATTLE BODY WEIGHT.STATISTICAL TEST USING ANALYSIS 2 WAS PERFORMED.ONLY THE REGIONS WITH PVALUE LESS THAN 0.01 ARE SHOWN ... 147
TABLE 5.1SUMMARY INFORMATION OF CATTLE BREEDS USED IN THIS STUDY ... 162
TABLE 5.2VARIANT CALLING STATISTICS ... 167
TABLE 5.3VARIANT ANNOTATION STATISTICS ... 167
ix
List of Figures
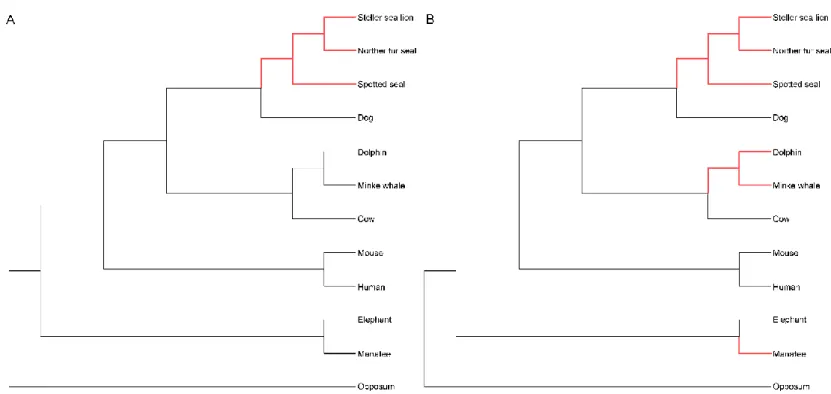
FIGURE 2.1EXAMPLES OF (A)PHOCA LARGHA;SPOTTED SEAL,(B)CALLORHINUS URSINUS;NORTHERN FUR SEAL, AND (C)EUMETOPIAS JUBATUS;STELLER SEA LION ... 22 FIGURE 2.2ESTIMATION OF THREE PINNIPEDS’ GENOME SIZES BASED ON 19-MER ... 26 FIGURE 2.3FOREGROUND BRANCHES USED IN (A) BRANCH-SITE MODEL, AND (B)
BRANCH MODEL.RED LINE INDICATES FOREGROUND BRANCHES IN EACH
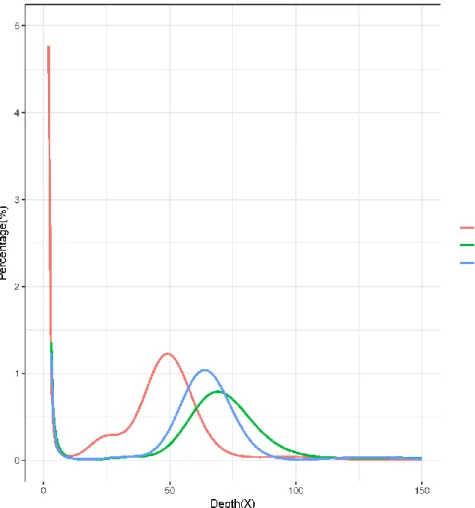
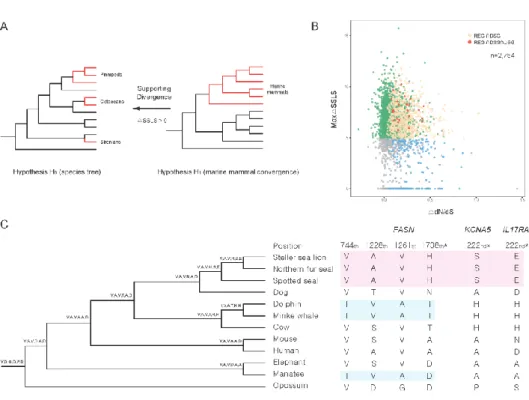
ANALYSES... 32 FIGURE 2.4ANALYSIS OF RAPIDLY EVOLVING GENES, DIVERGENT SUBSTITUTION GENES,
AND UNIQUE SUBSTITUTION GENES.(A)HYPOTHESES USED TO CALCULATE ΔSSLS.(B)ΔDN/DS AND ΔSSLS DISTRIBUTION IN 2,754 ORTHOLOGS.(C)UNIQUE SUBSTITUTIONS OF FASN,KCNA5, AND IL17RA.ASTERISKS, SUBSTITUTIONS UNIQUE TO PINNIPEDS. OTHER POSITIONS REPRESENT SUBSTITUTIONS UNIQUE TO CETACEANS + SIRENIANS ... 34 FIGURE 2.5DISTRIBUTION OF GC CONTENT FOR THE PINNIPEDS GENOMES ... 44 FIGURE 2.6PHYLOGENOMICS AND PROTEIN-CODING GENE FAMILIES OF PINNIPEDS.(A)
SPECIES TREE OF 12 TERRESTRIAL AND MARINE MAMMALS CONSTRUCTED BY THE MAXIMUM-LIKELIHOOD METHOD.(B)ORTHOLOGOUS GENE CLUSTERS IN THREE PINNIPEDS.(C)NUMBER OF INTACT (COVERAGE ≥90%) AND PARTIAL (COVERAGE
<90%) GENES THAT BELONG TO PROTOCADHERIN GENE FAMILIES, NAMED FAMILY 34 IN OUR DATASET (DOL, DOLPHIN;MAN, MANATEE;MIN,MINKE WHALE;NOR, NORTHERN FUR SEAL;SPO, SPOTTED SEAL;STE,STELLER SEA LION) ... 47 FIGURE 2.7GENE FAMILY EXPANSION OR CONTRACTION ACROSS 6 MARINE MAMMALS
... 48 FIGURE 2.8RESULTS OF A BRANCH-SITE MODEL ANALYSIS OF TECTA.(A)BAYES
EMPIRICAL BAYES (BEB) POSTERIOR PROBABILITY IN TECTA.SHADED AREA, CONSERVED DOMAIN REGIONS.(B)SEQUENCE OF SITES WITH SIGNIFICANT BEB (> 0.95).RED AND BLUE SHADED AREAS, PINNIPEDS AND OTHER MAMMALS, RESPECTIVELY ... 54 FIGURE 2.9AMINO ACID SEQUENCES ACROSS 100 VERTEBRATES AT THE SITE WITH
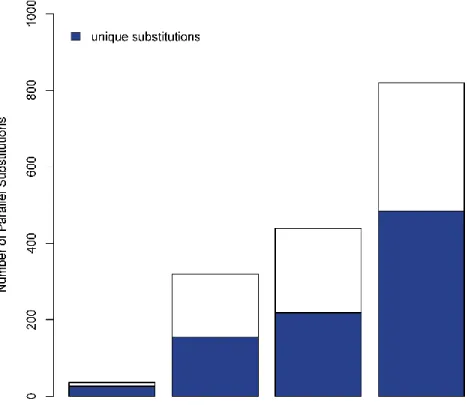
RAPID EVOLUTION OR SUBSTITUTION UNIQUE TO THREE PINNIPEDS (SPOTTED SEAL,NORTHERN FUR SEAL, AND STELLER SEA LION).SITES AT TECTA,FASN, KCNA5 AND IL17RA ARE SHOWN.** INDICATES SUBSTITUTIONS UNIQUE TO PINNIPEDS.* INDICATES SUBSTITUTION UNIQUE TO CETACEANS + SIRENIANS... 55 FIGURE 2.10NUMBER OF PARALLEL AND UNIQUE SUBSTITUTIONS ACROSS MARINE
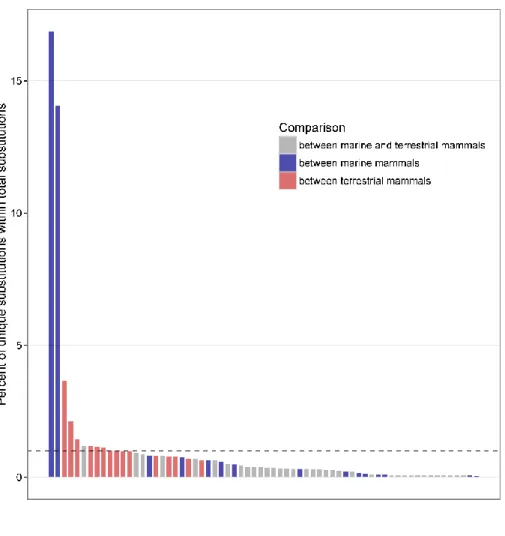
MAMMAL CLADES ... 60 FIGURE 2.11PERCENTAGE OF UNIQUE SUBSTITUTIONS IN TOTAL SUBSTITUTIONS FOR
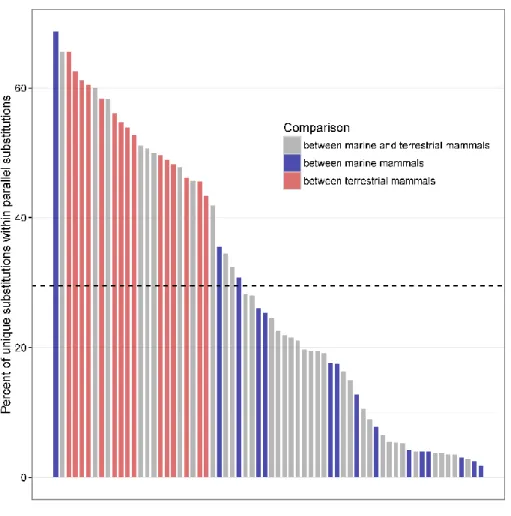
ALL PAIRWISE COMPARISONS AMONG ALL 12 SPECIES IN THE PHYLOGENY.THE DASHED LINE INDICATES THE AVERAGE ... 61 FIGURE 2.12PERCENTAGE OF UNIQUE SUBSTITUTIONS IN PARALLEL SUBSTITUTIONS
FOR ALL PAIRWISE COMPARISONS AMONG ALL 12 SPECIES IN THE PHYLOGENY.THE DASHED LINE INDICATES THE AVERAGE ... 62 FIGURE 2.13CONVERGENT EVOLUTION AT MULTIPLE LEVELS.SIMILAR PHENOTYPES
CAN EVOLVE AT:(A) MOLECULAR;(B) GENE;(C) PHENOTYPIC LEVEL (MANCEAU, DOMINGUES ET AL.2010).WE HAVE FOCUSED E ON THE GENE-LEVEL
CONVERGENCE (B) IN THIS STUDY ... 63
x
FIGURE 2.14INTERSECT BETWEEN THE POSITIVELY SELECTED GENES FROM BRANCH MODEL ANALYSIS AND BRANCH-SITE MODEL ANALYSIS FOR ALL MARINE
MAMMAL’S BRANCHES WITH CONTINUOUS P-VALUE CUTOFFS.RED LINE INDICATES THE NUMBER OF POSITIVELY SELECTED GENES FROM BRANCH MODEL ANALYSIS AND TURQUOISE LINE INDICATES THE NUMBER OF POSITIVELY SELECTED GENES DETECTED IN BOTH OF BRANCH MODEL AND BRANCH-SITE MODEL ANALYSIS ... 69 FIGURE 3.1WORKFLOW FOR DETECTING HUMAN-SPECIFIC TANDEM REPEAT.(A)A
DIAGRAM REPRESENTING WHOLE ANALYSIS STEPS TO DETECT HSTR.TRS WERE FILTERED BY THE CRITERION OF EACH STEPS (SEE MATERIALS AND METHODS).(B) A SCHEMATIC OF METHOD FOR DETECTING HSTRS.THE CONCEPT OF METHOD WAS MODIFIED FROM A PREVIOUS STUDY (SEN,HAN ET AL.2006).(C)THE NUMBER OF TRS DETECTED IN EACH COMPARISON (HUMAN VS CHIMPANZEE, HUMAN VS GORILLA AND HUMAN VS ORANGUTAN).(D)A TYPE OF TRS (HSTR) WE EXPECT TO IDENTIFY IN THIS STUDY ... 77 FIGURE 3.2CHARACTERISTICS OF TOTAL TRS AND HSTRS.CHARACTERISTICS (UNIT
LENGTH, NUMBER OF REPEATS, TOTAL LENGTH AND PERCENTAGE OF MATCH) OF TOTAL TR AND HSTR... 94 FIGURE 3.3DISTRIBUTION OF BOOTSTRAPPED PERCENTAGES OF MATCHES.DASHED
LINE INDICATES THE MEAN PERCENTAGE OF MATCH OF HSTRS ... 95 FIGURE 3.4DELETION FREQUENCY OF IDENTIFIED HSTRS AND FLANKING SEQUENCES.
(A)PER BASE DELETION FREQUENCIES ACROSS 100 VERTEBRATE’S ALIGNMENTS BETWEEN SEQUENCE OF HSTRS AND FLANKING SEQUENCES.THE 152HSTRS HAVE EXTREMELY HIGH FREQUENCY OF DELETIONS COMPARED TO FLANKING SEQUENCES (WILCOXON RANK SUM TEST, P-VALUE <2.2E-16).(B)AN EXAMPLE OF DELETION FREQUENCY TREND FOR THE HSTR IN PRKG1 GENE ALONG WITH FLANKING SEQUENCES.ALMOST ALL SPECIES HAVE DELETION AT THE HSTR REGION EXCEPT HUMAN.(C)MULTIPLE SEQUENCE ALIGNMENT OF SHADED AREA IN (B).OF 100 VERTEBRATES, ONLY THE ALIGNMENT OF 12 PRIMATES WERE SHOWN ... 98 FIGURE 3.5VALIDATION AND FIXATION OF HSTRS.(A)DISTRIBUTION OF SAMPLES
THAT HAVE INTACT HSTR SEQUENCES.(B)MEAN COUNT OF COMMON VARIANTS WITHIN HSTRS.CONTROL SETS GENERATED BY RESAMPLING 10,000 TIMES WERE PLOTTED AS GREY DOTS, AND THE HSTR SET WAS PLOTTED AS A RED DOT.X AND Y-AXIS INDICATE MEAN LENGTH OF TR AND MEAN COUNT OF COMMON VARIANTS FOR EACH SETS, RESPECTIVELY ... 99 FIGURE 3.6MEAN COUNT OF COMMON VARIANTS WITHIN HSTRS IN (A) GENIC REGION
AND (B) INTERGENIC REGION.CONTROL SETS GENERATED BY RESAMPLING 10,000 TIMES WERE PLOTTED AS GREY DOTS, AND THE HSTR SET WAS PLOTTED AS A RED DOT.X AND Y-AXIS INDICATE MEAN LENGTH OF TR AND MEAN COUNT OF
COMMON VARIANTS FOR EACH SETS, RESPECTIVELY ... 100 FIGURE 3.7GENOMIC LOCATION AND FUNCTIONAL ENRICHMENT OF HSTRS.(A)
GENOMIC LOCATION OF TOTAL TR AND HSTR.THE RATIO FOR THE LOCATION OF TRS (INTRON,INTERGENIC,EXON AND BOUNDARIES OF INTRON AND EXON) WAS ILLUSTRATED WITH PIE CHART.AMONG TRS LOCATED IN EXON, THE RATIO OF TR IN CDS(CODING SEQUENCE) AND UNTRANSLATED REGION (NONCDS) WERE ALSO SHOWN.(B)RESULT OF GENE SET ENRICHMENT ANALYSIS FOR THE GENE SET WHICH CONTAIN HSTRS... 103 FIGURE 3.8GENE SET ENRICHMENT ANALYSIS FOR A GENE SET NEARBY HSTRS (WITHIN
100KB).GENE RATIO INDICATES RATIO FOR THE NUMBER OF GENES TO TOTAL NUMBER OF GENES IN A GENE ONTOLOGY CATEGORY ... 104
xi
FIGURE 3.9EXPRESSION OF HSTR GENES ACROSS SEVEN TISSUES.DISTRIBUTIONS OF MEAN LOGFC(LOG2 FOLD CHANGE) FOR RANDOM SAMPLES IN SEVEN TISSUES. DASHED LINE COLORED BY RED INDICATES MEAN LOGFC FOR TOTAL
ORTHOLOGOUS GENE SETS.DASHED LINE COLORED BY BLUE INDICATES MEAN LOGFC FOR HSTR GENE SET ... 107 FIGURE 3.10AN EXAMPLE OF CANDIDATE HSTR THAT MIGHT BE RELATED TO HUMAN
BRAIN FUNCTION.(A) IN VITRO VALIDATION OF HSTR IN SSTR1 GENE.WE AMPLIFIED THE HSTR LOCI WITHIN SSTR1 GENE BY PCR USING HUMAN, CHIMPANZEE, GORILLA AND ORANGUTAN GENOMIC DNA SAMPLES AND CONFIRMED THAT THE PCR PRODUCTS WERE LONGER ONLY IN THE HUMAN SAMPLE.THE NUMBERS BELOW INDICATE FRAGMENT LENGTH.(B)BOXPLOT OF NORMALIZED EXPRESSIONS IN CEREBELLUM TISSUE (LOGFC:2.4328,WILCOXON RANK SUM TEST P-VALUE :0.0339).(C)GAP FREQUENCY DISTRIBUTION FOR THE HSTR IN SSTR1 GENE ALONG WITH FLANKING SEQUENCES.ALMOST ALL SPECIES HAVE GAP AT THE HSTR REGION EXCEPT HUMAN.(D)MULTIPLE SEQUENCE ALIGNMENT OF SHADED AREA IN (C).OF 100 VERTEBRATES, ONLY THE ALIGNMENT OF 12 PRIMATES WERE SHOWN.(E)FOLD ENRICHMENT OVER CONTROL AT THE HSTR REGION IN SSTR1 GENE FOR HISTONE MODIFICATION H3K27AC.SHADED AREA INDICATES KNOWN ENHANCER REGION (GH14I038206) IN GENEHANCER DATABASE (FISHILEVICH,NUDEL ET AL.2017).RED LINE INDICATES HSTR
LOCATION IN SSTR1 GENE ...113 FIGURE 4.1MEAN COUNT, LENGTH, AND FREQUENCY OF ROH IN 126 CATTLE
ACCORDING TO THE CHANGE OF ROH THRESHOLD.ROH THRESHOLD WAS
CONTROLLED FROM 0 TO 2000KB WITH 1000KB AS A UNIT ... 131 FIGURE 4.2INDIVIDUAL GENOME-WIDE AUTOZYGOSITIES (FROH).COMPARISON OF (A)
FROH AND (B)FSNP BETWEEN SELECTED (N =126) AND UNSELECTED (N =10) CATTLE POPULATIONS.SELECTED AND UNSELECTED CATTLE POPULATIONS WERE SIGNIFICANTLY DIFFERENT IN BOTH FROH AND FSNP (WILCOXON RANK SUM TEST, P-VALUE =9.704E-05 AND 2.979E-04, RESPECTIVELY).(C)CHANGE OF FROH DURING THE PAST ~20 YEARS.KPN NUMBER WAS USED INSTEAD OF CATTLE BIRTH YEAR ... 132 FIGURE 4.3DISTRIBUTION OF MEAN FROH AND P-VALUES OF 1000 DATA SETS
GENERATED BY SAMPLING 10 INDIVIDUALS FROM SELECTED POPULATION
ITERATIVELY.FROH VALUES FOR EACH DATA SET WERE AVERAGED, AND P-VALUES WERE CALCULATED BY WILCOXON’S RANK SUM TEST BETWEEN 10 SELECTED INDIVIDUALS AND UNSELECTED INDIVIDUALS (N=10).NOTE THAT THE VERTICAL RED LINE INDICATES MEAN FROH AND P-VALUE OF UNSELECTED POPULATION, RESPECTIVELY ... 133 FIGURE 4.4GENOME-WIDE DISTRIBUTION OF ROH IN 126 CATTLE.(A)DISTRIBUTION
OF ROH MEAN LENGTH IN 10MB BIN.(B)FREQUENCY OF ROH LONGER THAN 500KB IN 10MB BIN.(C)CHANGE OF ROH MEAN LENGTH WHEN COMPARING ROH MEAN LENGTH OF TWO GROUPS (GROUP A:KPN≤486, AND GROUP B:KPN>486) ... 137 FIGURE 4.5DIRECTION OF REGRESSION COEFFICIENTS IN TWO ASSOCIATION TEST
(ANALYSIS 1, AND ANALYSIS 2).(A)BIN COUNTS ACCORDING TO THEIR DIRECTION OF REGRESSION COEFFICIENTS IN ASSOCIATION TEST BETWEEN ARTIFICIAL
SELECTION AND ROH(ANALYSIS 1).(B)BIN COUNTS ACCORDING TO THE DIRECTION OF REGRESSION COEFFICIENTS IN ASSOCIATION TEST BETWEEN ROH AND BODY WEIGHT (ANALYSIS 2) ... 138
xii
FIGURE 4.6ROH LENGTH OF EACH INDIVIDUALS IN A BIN
(BTA2:70,000,001~80,000,000) OVERLAPPED WITH A PREVIOUS STUDY (LEE, CHUNG ET AL.2013).X AXIS INDICATES THE INDIVIDUAL ID SORTED BY THEIR
KPN NUMBER, AND Y AXIS INDICATES ROH LENGTH IN MB.. ... 139
FIGURE 4.7DISTRIBUTION OF ROH SEGMENTS IN CANDIDATE REGIONS WITH VALIDATION DATASET.Y AXIS INDICATES THE INDIVIDUAL ID SORTED BY THEIR KPN NUMBER WITH INCREASING ORDER, AND X AXIS INDICATES COORDINATES ON UMD3.1 REFERENCE GENOME.ROH SEGMENTS IN ORIGINAL DATASET (N=136), AND IN VALIDATION DATASET (N=77) ARE MARKED BY GREY AND ORANGE COLOR, RESPECTIVELY.NOTE THAT THE FIRST 10 INDIVIDUALS ARE “UNSELECTED POPULATION” WITHOUT KPN NUMBERS ... 140
FIGURE 4.8SIGNATURES OF INBREEDING AT THE CANDIDATE REGION IN BTA25.(A) DISTRIBUTION OF ROH SEGMENTS IN THE CANDIDATE REGION.“COMPLETE OVERLAP REGION” REFERS TO THE GENOMIC REGIONS THAT HAVE THE MAXIMUM NUMBER OF SAMPLES WHICH HAVE AT LEAST ONE ROH SEGMENT.(B)INBREEDING SIGNATURES OF CANDIDATE REGION ARE PRESENTED BY AVERAGE LD AND F COEFFICIENT.“COMPLETE OVERLAP REGION” ARE SHADED IN GREY.UNSELECTED INDIVIDUALS,GROUP A(INDIVIDUALS WITH KPN≤486), AND GROUP B (INDIVIDUALS WITH KPN>486) ARE REPRESENTED BY DARK BROWN, RED AND GREEN COLOR, RESPECTIVELY ... 142
FIGURE 4.9SCATTERPLOTS FOR KPN,FROH,BODY WEIGHT.CORRELATION BETWEEN EACH ELEMENTS WAS TESTED BY SPEARMAN’S METHOD.KPN VS FROH : Ρ = 0.46697, P-VALUE =5.203E-08;FROH VS BODY WEIGHT : Ρ =-0.03930, P-VALUE = 0.69900;KPN VS BODY WEIGHT : Ρ =0.33921, P-VALUE =0.00059 ... 146
FIGURE 4.10SELECTIVE SWEEP REGIONS IDENTIFIED BY INTEGRATED HAPLOTYPE SCORE (IHS).THE HORIZONTAL RED LINE INDICATES TOP 1% PROPORTION OF SNPS WITH |IHS|>2 IN A 100KB WINDOW ... 149
FIGURE 5.1(A)DISTRIBUTION OF INDIGENOUS AFRICAN CATTLE BREEDS USED IN THIS STUDY.ONLY EASTERN AFRICAN BREEDS WERE SHOWN, EXCLUDING N’DAMA BREED.(B)SCHEME OF COMPARATIVE ANALYSIS IN THIS STUDY.TWO ANALYSIS HAVE BEEN PERFORMED TO IDENTIFY ADAPTIVE SIGNATURE IN INDIGENOUS AFRICAN CATTLE; ① TO IDENTIFY INTROGRESSION LOCI IN AFRICAN INDICINE CATTLE ② TO IDENTIFY BARRIER LOCI AGAINST INTROGRESSION IN AFRICAN TAURINE CATTLE... 160
FIGURE 5.2POPULATIONS STRUCTURE OF INDIGENOUS AFRICAN CATTLE.(A) MAXIMUM LIKELIHOOD TREE RECONSTRUCTED BY 235 CATTLE SAMPLES.THE SIZE OF DOT AT EACH NODE INDICATES BOOTSTRAP VALUE.(B)PCA PLOT OF 235 CATTLE SAMPLES.THE SHAPE AND COLOR OF POINTS INDICATE TYPE AND GROUP INFORMATION, RESPECTIVELY.(C)THE RESULTS OF ADMIXTURE ANALYSIS BY USING CLUSTER FROM K=2 TO K=6 ... 179
FIGURE 5.3VARIANCE EXPLAINED BY MODEL IN TREEMIX ANALYSIS ... 180
FIGURE 5.4POPULATION-BASED PHYLOGENY WITH 13 MIGRATION EDGES ... 181
FIGURE 5.5MEAN PAIR-WISE FST VALUE BETWEEN CATTLE BREEDS ... 182
FIGURE 5.6OBSERVED HETEROZYGOSITY OF ALL CATTLE BREEDS IN THIS STUDY ... 183
FIGURE 5.7RUNS OF HOMOZYGOSITY PATTERNS OF ALL CATTLE BREEDS IN THIS STUDY ... 183 FIGURE 5.8ADMIXED SIGNATURES IN AFRICAN INDICINE GENOMES.(A)Z
TRANSFORMED ABBABABA STATISTICS.THE DOTTED RED LINE INDICATES EXPECTED STATISTIC AT A NEUTRAL LOCUS (B)ADMIXTURE PROPORTIONS
xiii
MEASURED BY F-STATISTICS.THE INSET INDICATES A PHYLOGENY ASSUMED IN CALCULATING BOTH OF ABBABABA AND F-STATISTICS ... 188 FIGURE 5.9AN EXAMPLE OF INTROGRESSION LOCI IN AFRICAN INDICINE GENOMES (A)
INDICINE ANCESTRY INFERRED BY LOTER.(B)INDICINE ANCESTRY ACCORDING TO GENOMIC REGIONS.(C)RESULT OF GENE SET ENRICHMENT ANALYSIS.(D)PAIR- WISE FST VALUE IN THE CANDIDATE LOCUS.(E)GENOME-WIDE DISTRIBUTION OF PAIR-WISE FST VALUES COMPARED TO THAT OF THE CANDIDATE LOCUS ... 189 FIGURE 5.10DISTRIBUTION OF RIBD VALUES AT A GENOME-WIDE LEVEL. RIBD HAS
BEEN CALCULATED WITH 20KB WINDOW AND 10KB STEP.RED:IBD SHARING TOWARD ASI,BLUE:IBD SHARING TOWARD EUT ... 192 FIGURE 5.11SELECTION SIGNATURES OF AFRICAN TAURINE CATTLE AFTER SPLIT FROM
EUROPEAN TAURINE CATTLE.(A)GENOME-WIDE DISTRIBUTION OF PBS VALUES WITH 50KB WINDOW AND 2KB STEP.(B)FST-BASED PHYLOGENY AMONG AFT, EUT, AND ASI.THE BRANCH LENGTH INDICATES FST VALUE.(C)PAIR-WISE FST VALUE BETWEEN AFT AND EUT AROUND THE PEAK WITH HIGHEST PBS ... 196 FIGURE 5.12DISTRIBUTION OF PAIR-WISE FST VALUES FOR TWO COMPARISONS;EUT
VS.AFT, AND ASI VS.AFT ... 197 FIGURE 5.13COMPARISONS WITH OTHER BREEDS FOR THE CANDIDATE LOCUS AT
BTA25.(A)PAIR-WISE FST VALUES AROUND THE PEAK WITH HIGHEST PBS.(B) HAPLOTYPE CLUSTERING FREQUENCIES AT THE 50KB WINDOW WITH HIGHEST PBS.
FOUR BREEDS HAVE BEEN ADDED INTO THIS ANALYSIS.(BAGARIA,BALE,
MUTURU, AND SEMIEN) ... 198
xiv
General Introduction
Evolution is a continuous process, which leaves distinctive footprints on the genome. Using these footprints, evolutionary parameters and histories can be inferred. However, the footprints could be diverse as much as the complexity of evolutionary history. Especially, different molecular markers should be used to detect signatures under different time scales of evolution.
Macroevolution refers to changes on a scale at or above the species level, while microevolution refers to changes in allele frequencies that occurs within a species or population (Reznick and Ricklefs 2009). Macroevolution and microevolution depend on fundamentally identical processes, but occur on different time scales (Dietrich 2010). For this reason, separate approaches are generally employed into the two categories of evolution. For instance, reference genome sequences are directly compared, and then functional changes are inferred based on amino acid changes at a species level. In contrast, allele frequency difference or length of haplotypes are usually considered at a population level using genotype data.
The rates of evolution are not uniform across genome of an organism, as different genomic regions experience different evolutionary process. For example, mutation rates of tandem repeats are 10 to 100,000 times higher than that in other parts of the genome (Legendre, Pochet et al. 2007). In addition, gene flow among populations could significantly increase genetic variation and rates of evolution at a particular genomic region (Verhoeven, Macel et al. 2010).
xv
Although such non-uniform evolutionary rates definitely increase the complexity of evolutionary process, they could be useful in some cases such accelerated evolution or adaptation of a species. For instance, many recent studies attempted to explain rapid adaptation of a species that has been exposed to new environmental challenges by genetic variation from gene flow (Hedrick 2013).
This thesis is largely divided into three categories (Terminologies and recent example studies, macroevolution studies, and microevolution studies).
The basic background and recent example studies related to this thesis were introduced in the first category (chapter 1). The second category consist of two macroevolution studies with novel analysis using tandem repeat variation (chapter 3) as well as conventional evolutionary analysis (chapter 2). The third category consist of two microevolution studies with novel analysis for very recent evolutionary event (chapter 4) as well as analysis for gene flow (chapter 5). Each study of latter two categories has been performed based on different genomic variations under different time scales. Given these results, this thesis suggests relevance of each genomic variations corresponding to different time scales of evolution.
1
Chapter 1. Literature Review
2
1.1 Genomic variations to detect evolutionary signatures
1.1.1 Overview of genomic variations
Genomic variations or genetic polymorphisms are generally referred to as heritable DNA sequence differences among individuals or populations. They arise through several types of mutations; a change from one type of nucleotide to another, an insertion or a deletion, or a rearrangement of nucleotides (Ismail and Essawi 2012).
Due to its polymorphic nature, genomic variation has been used in a variety of research fields including population genetics, phylogenetics, and forensic science. As it also has close relationship with phenotypic difference or disease, one of the major scientific challenges in human genetics field is decoding the genomic basis of human health and disease (Sharp, Cheng et al.
2006, Frazer, Murray et al. 2009).
Genomic variations can be classified into two broad categories; single nucleotide variants (e.g. SNP) and structural variants (e.g. copy number variation, and translocation). They can be analyzed by conventional methods such as polymerase chain reaction (PCR), gel electrophoresis, and fluorescence in situ hybridization (FISH). However, the recent development of new sequencing technologies has provided an opportunity to directly examine the sequences of genomic variations (Frazer, Murray et al. 2009).
3
1.1.2 Single nucleotide polymorphism (SNP)
Single nucleotide polymorphism (SNP) is a single nucleotide variant that is caused by a point mutation at a particular nucleotide site (Sharp, Cheng et al.
2006). SNPs are the most abundant type of genomic variation in the human genome. On the basis of sequencing results, SNP has been estimated to occur at 1 out of every 1,000 bases in the human genome (Syvänen 2001).
SNP information of an individual can be produced by genotyping or using sequence-based methods. Generally, genotype-based methods are cost- effective, but only previously defined loci can be assayed. Sequencing-based methods, in the other hand, cost more than genotyping methods but they can expand the range of loci to whole genome scale.
The vast majority of SNPs are located outside of genic regions with minor effects for phenotypic variations. However, sometimes, SNPs are located within coding regions of a gene, which can lead to several types of changes for its protein products. In detail, a synonymous SNP, or silent mutation does not result in a change of amino acid due to the degeneracy of the genetic code, whereas a substitution from one amino acid to the other occurs for a nonsynonymous SNP, or missense mutation. If the nonsynonymous SNP result in a premature termination of polypeptide by introducing an internal stop codon, it is called nonsense mutation (Frazer, Murray et al. 2009).
SNP is a major type of genomic variation that is widely used in a variety of current research fields including population genetics, phylogenetics, and
4
evolutionary genetics. In population genetics, it is often used to infer population structure or history, and to detect positive selection signatures based on linkage disequilibrium (Sabeti, Varilly et al. 2007) or allele frequency spectrum (Chen, Patterson et al. 2010). Evolutionary genetics, in particular, used it as a marker for molecular clock (Hasegawa, Kishino et al. 1985) or detecting positive selection signatures based on a ratio of non-synonymous and synonymous SNPs (Nielsen 2005).
1.1.3 Tandem repeats (TR)
Tandem repeats (TR) refers to a repetitive pattern of one or more nucleotides that are connected directly each other (Consortium 2001). Since they were initially detected as a form of satellite bands in density-gradient centrifugal DNA separation, TRs are also known as satellite DNA, and can be divided into microsatellite and minisatellite according to their unit length. Microsatellites is usually used to define short tandem repeats with a unit length shorter than 10 nucleotides, while the unit length of minisatellite is longer their size being up to 100bp (Vergnaud and Denoeud 2000, Gemayel, Vinces et al. 2010).
Traditionally, TRs could be detected by DNA amplification as in human identity testing (Butler 2006), while sequencing technologies now enables to detect TRs across whole genome sequence. Therefore, many TR detection algorithms and software have been developed so far to identify TRs comprehensively for a haploid sequence of whole genome (e.g. Tandem repeat
5
finder (Benson 1999)). Moreover, the recent explosion of sequence data led by next generation sequencing (NGS) facilitates the production of a catalog of TRs at a population level.
TRs are ubiquitously distributed in eukaryotic genomes. Since they are often found in genic regions as well as intergenic regions, TRs could have diverse effects on cellular processes, depending on their locations (Usdin 2008).
For example, the expansion of repeats in HTT (huntingtin) gene leads to a modification of protein product, which result in Huntington’s disease (Hannan 2018). TRs also have higher mutation rates than that in other parts of the genome, as mutations around them is caused by strand slippage or homologous recombination errors rather than point mutations (Gemayel, Vinces et al. 2010).
TRs together with other repeat sequences, have been regarded as junk DNA (Gemayel, Cho et al. 2012). However, the unstable nature of TRs along with their possible biological effects is recently attracting the researchers’
attention. According to recent studies, TRs might have more diverse and important roles in gene expression and regulation than expected (Sonay, Carvalho et al. 2015, Gymrek, Willems et al. 2016, Quilez, Guilmatre et al.
2016). Furthermore, TRs give an opportunity to provide insights into evolutionary processes, especially when evolution occurred rapidly as it is the case in human.
6
1.1.4 Runs of homozygosity (ROH)
Runs of homozygosity (ROH) refers to a continuous DNA segment where all loci are homozygous. Although ROH could be created by chance, ‘autozygous segment’, created by inbreeding is generally a target to study (McQuillan, Leutenegger et al. 2008).
The autozygous segment is generally shortened over generations due to meiotic recombinations (Kirin, McQuillan et al. 2010), and can present a degree of inbreeding in one population. Hence, the frequency and length of ROH could be different across different populations according to their genetic histories (McQuillan, Leutenegger et al. 2008).
Several recent studies have highlighted the link between ROH and phenotypes (Yang, Guo et al. 2010, Keller, Simonson et al. 2012, Ghani, Reitz et al. 2015), although their causal relationship is still not clear. For instance, the deleterious effect of inbreeding on a reproductive trait has been examined by ROH in a pig population (Saura, Fernández et al. 2015). In addition, ROH correlates relatively well with pedigree-based methods to measure inbreeding, and provides inbreeding information at both population and individual-level (Saura, Fernández et al. 2015). In livestock population, controlling the level of inbreeding and maintaining genetic diversity is of major concern to maximize livestock’s productivity. Therefore, ROH could be a promising marker for monitoring inbreeding in livestock population.
7
1.2 Signatures of positive selection
1.2.1 Overview of positive selection
Positive selection, a type of natural selection, is the force that drives the increase in prevalence of a favored phenotype, causing adaptive evolution of a species (Biswas and Akey 2006). Although the contribution of positive selection could be diverse in each evolutionary process, it is clear that it has played a major role in the evolutionary history of all extant species.
The evidences of positive selection can be found in extant genomes in many different forms. For example, it might induce an excess of derived allele at a locus, and reduce the level of genetic variation compared to a neutral locus (Nielsen 2005, Biswas and Akey 2006). The putative targets of positive selection can be obtained when it is possible to identify such genomic features.
A common way of identifying the target is to study the genomic features of a few loci that are hypothesized to have been under positive selection. However, whole genome sequences produced by rapid development of sequencing technologies have enabled obtaining genomic features and the identification of targets under positive selection in a genomic scale.
Although the functional significance is still challenging to verify, the
‘genome scan’ searching whole genome sequence has given numerous candidates worth investigating further. Recently, the field and laboratory experiments combined with genomics directly demonstrated the functional connections between candidate loci, phenotype, and fitness (Barrett, Laurent et
8
al. 2019). Moreover, genome-wide survey facilitate the examination of non- coding genomic regions that have not been extensively studied compared to coding regions (Kelley and Swanson 2008).
1.2.2 Measures to detect positive selection
Many methods have been developed to detect positive selection, however, they could be classified into two fundamental categories; polymorphism-based methods, and divergence-based methods.
Polymorphism-based methods are used to identify recent positive selection within a species. Most of them are focus on identifying the signatures of ‘selective sweeps’ that are caused by the rapid fixation of an advantageous mutation and by the hitchhiking of beneficial mutations on linked neutral loci.
The signatures of selection sweep include 1) an excess of rare alleles, 2) reduced levels of genetic variation, and 3) elevated frequency of long haplotypes relative to neutral expectations.
Tajima’s D