저작자표시-비영리-변경금지 2.0 대한민국 이용자는 아래의 조건을 따르는 경우에 한하여 자유롭게
l 이 저작물을 복제, 배포, 전송, 전시, 공연 및 방송할 수 있습니다. 다음과 같은 조건을 따라야 합니다:
l 귀하는, 이 저작물의 재이용이나 배포의 경우, 이 저작물에 적용된 이용허락조건 을 명확하게 나타내어야 합니다.
l 저작권자로부터 별도의 허가를 받으면 이러한 조건들은 적용되지 않습니다.
저작권법에 따른 이용자의 권리는 위의 내용에 의하여 영향을 받지 않습니다. 이것은 이용허락규약(Legal Code)을 이해하기 쉽게 요약한 것입니다.
Disclaimer
저작자표시. 귀하는 원저작자를 표시하여야 합니다.
비영리. 귀하는 이 저작물을 영리 목적으로 이용할 수 없습니다.
변경금지. 귀하는 이 저작물을 개작, 변형 또는 가공할 수 없습니다.
공학석사학위논문
Chronic Low Back Pain Recognition Using a Smart Chair
스마트 의자를 활용한 만성요통 진단에 관한 연구
2023 년 2 월
서울대학교 대학원
산업공학과
이 욱 재
i
Chronic Low Back Pain Recognition Using a Smart Chair
스마트 의자를 활용한 만성요통 진단에 관한 연구
지도교수 박 우 진
이 논문을 공학석사 학위논문으로 제출함
2022 년 12 월
서울대학교 대학원
산업공학과
이 욱 재
이욱재의 공학석사 학위논문을 인준함
2023 년 2 월
위 원 장 윤 명 환 (인)
부위원장 박 우 진 (인)
위 원 이 재 욱 (인)
ii
Abstract
Chronic Low Back Pain Recognition Using a Smart Chair
Wookjae Lee Department of Industrial Engineering The Graduate School Seoul National University
This study developed a smart chair-based chronic low back pain (CLBP) recognition system. The system analyzes a seated person’s posture-time data during a one-hour sitting session to determine whether the person is a CLBP patient or not . The smart chair is equipped with six pressure and six infrared reflective distance sensors, and, can classify a sitting posture as one of 11 predetermined posture categories in real-time. The smart chair utilizes the light gradient boost machine algorithm to achieve good posture classification performance and is an improvement over a previous version that employed the k-Nearest Neighbor algorithm. Fourteen CLBP patients and fourteen non-patients were recruited for data collection. They performed computer typing sitting on the smart chair for an hour. A dataset consisting of the participants’ sitting posture-time data was constructed using the smart chair. Afterward, the patient and the non-patient group were compared in terms of the sitting posture-time data and a set of features that divide the two groups were selected.
iii
Finally, the CLBP recognition system was successfully developed by utilizing a CatBoost algorithm on a basis of the features selected and its performance was evaluated as well.
This study demonstrated that it is possible to recognize CLBP on the basis of sitting posture-time data. Furthermore, this study reports some findings on the differences
between CLBP patients and non-patients in the postural characteristics during sitting. They are expected to support developing future CLBP diagnosis and prognosis systems.
Keywords: chronic low back pain, recognition system, machine learning, posture classification system, smart chair
Student Number: 2021-22053
iv
Contents
Abstract ii
Contents iv List of Tables vi List of Figures vii Chapter 1 Introduction 1
1.1 Research background ··· 1
1.2 Research objective ··· 3
1.3 Organization of the thesis ··· 4
Chapter 2 Method 5 2.1 Smart chair-based posture classifier ··· 5
2.2 Data collection ··· 7
2.3 Feature engineering for designing the CLBP recognition system ··· 9
2.4 Design and evaluation of CLBP classifier ··· 11
Chapter 3 Results 12 3.1 Posture classification performance ··· 12
3.2 Comparison of CLBP patient and non-patient groups in candidate features ··· 14
3.3 Performance of CLBP classification ··· 19
Chapter 4 Discussion 20 4.1 Discussion ··· 20
v
Chapter 5 Conclusion 25
5.1 Conclusion ··· 25
Bibliography 26
국문초록 32
vi
List of Tables
Table 1 Participant demographic information ··· 8 Table 2 List of candidate features ··· 10 Table 3 Performance of posture classification ··· 13 Table 4 Comparison of CLBP patient and non-patient groups in candidate features: group means and t-test result ··· 15 Table 5 Performance of CLBP classification ··· 20
vii
List of Figures
Figure 1 Eleven sitting posture categories ··· 6
Figure 2 Physical construction of the mixed sensor system ··· 7
Figure 3 The confusion matrix of the posture classification results (LightGBM) ··· 13
Figure 4 Relative frequency of occurrence for all the posture categories ··· 15
Figure 5a Time change of group mean relative frequency distribution across the four 15- minute time periods during the experimental task (CLBP patient group) ·· 18
Figure 5b Time change of group mean relative frequency distribution across the four 15- minute time periods during the experimental task (non-patient group) ··· 18
Figure 6 SHAP output of the CLBP classifier ··· 20
1
Chapter 1 Introduction
1.1 Research background
Low back pain (LBP) is a musculoskeletal disorder that occurs in the lumbar vertebrae of the spine, which is known as the most common disorder worldwide (Muslim, 2013). If LBP persists for more than three months, it is defined as chronic low back pain (CLBP). CLBP is also quite common. Its prevalence is known to be about 23% globally (Al-Eisa, 2006).
LBP and CLBP cause enormous economic and social losses. A total healthcare expenditure for low back pain patients was estimated to be around US$17.7 billion in 2005 (Roer, 2005). Furthermore, there are huge productivity losses caused by absenteeism at workplace. In the United States, CLBP is the main cause of absenteeism at workplace, resulting in an economic loss of about 12 to 24 billion (Mychaskiw, 1992). In another study, the aggregate annual productivity losses from back pain were reported to be $34 billion (Rizzo, 1998). LBP is one of the most frequent reasons for hospitalization and doctor visits, resulting in high medical care costs (Parthan, 2006).
Regular hospital visits are important for managing and curing LBP because physical exercise and cognitive behavioral therapy are two effective LBP treatments (Chou, 2018). Also, self-home care is no less important (Greene, 2012). However, both hospital- based and self-home care have problems: 1) it is difficult for patients who lived in medically undeserved areas to visit a hospital, and 2) they may not be able to take systematic self-
2
home care due to lack of knowledge. Thus, mobile healthcare (mHealth) has been developed to address the problems by offering telemedicine management (Hamine, 2015). It helps to manage low back pain through various types of communication such as text, call, and survey (Chen, 2021; Mork, 2018). Although it is possible to remotely identify a patient’s condition through mHealth, accurate diagnosis is tricky because mHealth heavily depends on patients' subjective evaluation.
To overcome the above-mentioned problem of mHealth, several studies have developed LBP recognition/diagnosis methods based on physical, physiological and psychological measurements so as to support remote CLBP/LBP management. Hu (2018) developed a system that recognizes CLBP by analyzing motion capture, IMU sensor, and forceplate data in a static standing posture. The system showed an accuracy of 97%.
Abdollahi (2020) created a system that classifies LBP patients into three stages according to severity on the basis of the IMU sensor, center of pressure, and subjective psychological data during a flexion/extension task. Liew (2020) developed a system that performs LBP diagnosis utilizing EMG and motion capture data during a repetitive lifting task. The system achieved an accuracy level over 96%. In addition, there have been many similar attempts that showed good classification performance(Marras, 1995; Zurada, 1997; Sheeran, 2019;
Bacon, 2020). However, most of the methods/systems utilized equipment that are usually not available at users’ home, such as EMG and motion capture systems, and artificial physical tasks like repetitive lifting and flexion/extension. This makes it difficult to use these methods/systems in the daily life of users. In order to support the mHealth for LBP, real- time recognition/diagnosis systems that are readily applicable to the user's daily life settings are required.
Therefore, this study proposed a CLBP recognition system using a smart chair with built-in pressure and distance sensors. The use of a chair provides the following benefits: 1) it is easy to collect a large amount of continuous data because many people spend a lot of time sitting on a chair, 2) a chair is a non-intrusive instrument that is used during daily life.
3
In fact, it is impractical to install equipment such as motion capture systems or force plates at home or in public places. On the other hand, chairs are usually available at users’ home as furniture, and 3) it is likely that CLBP can be diagnosed through the analyses of sitting posture data. Several studies have reported differences between CLBP/LBP patients and non-patients in the kinematic patterns during sitting.
As for the differences between CLBP/LBP patients and non-patients, in the sitting kinematics, some major findings are as follows: 1) patients with LBP exhibited more static sitting rather than dynamic sitting behaviors with infrequent but large shifts in posture (O'Sullivan, 2012; Telfer, 2009; Vergara, 2002), 2) LBP patients showed larger pelvic asymmetry while prolonged sitting, and showed a different trunk range of motion compared to non-patients (Al-Eisa, 2006), 3) LBP patients tend to have a smaller lumbar spinal range of motion during prolonged sitting (Dunk, 2010), 4) CLBP patients are known to adopt fear- avoidance behavioral strategies that affect movement kinematics during sitting (Van, 2009).
In consideration of the above four findings from past research, it was thought that a smart chair system, in particular, our smart chair with built-in pressure and distance sensors (Jeong and Park, 2021), could be used as a basis for collecting sitting posture-time data in real time and accurately recognizing CLBP on the basis of the data.
1.2 Research objective
The long-term goal of our research is to develop a smart chair-based system for predicting the future occurrence of CLBP, which contributes to preventing the disorder before it becomes chronic. As an initial study towards this goal, the purpose of the current study was to: 1) identify the differences between CLBP patients and non-patients in biomechanically and ergonomically relevant features derived from smart chair sensor data, 2) develop a smart chair-based system that is capable of classifying the presence or absence of CLBP utilizing relevant features and validate its performance – the system was named “the smart-chair based CLBP recognition system.” The results of the current study would provide knowledge
4
that enhances our understanding of CLBP and support developing CLBP diagnostic systems for LBP mHealth. Also, the study results would provide an important foundation for developing a CLBP prediction system for the prevention of the disorder.
To accomplish the research objectives, this study conducted three main tasks: first, a new smart chair system for posture classification was developed and evaluated. It was an improvement over a previous one (Jeong and Park, 2021) in terms of prediction performance.
Next, a dataset for developing and validating the smart chair-based CLBP recognition system was constructed. A group of participants (CLBP patients and non- patients) performed a standardized typing task for 1 hour using the smart chair. The smart chair-based posture classifier collected sitting posture-time data from the participants. The CLBP patient and non-patient groups were compared in terms of the sitting posture-time data. Important features were identified and they provided the basis for designing the smart- chair based CLBP recognition system. Finally, the smart-chair based CLBP recognition system was developed, and, its recognition performance was empirically evaluated.
1.3 Organization of the thesis
The thesis is composed of five chapters. Chapter 2 is the method section of this thesis. It describes the design of the smart chair-based posture classifier, the methods used to compare CLBP patients and non-patients in sitting behaviors, and the design of the CLBP recognition system. The smart chair-based posture classifier is a component of the CLBP recognition system and is an improvement over a previous one (Jeong and Park, 2021). The comparative evaluation was to inform the development of the CLBP recognition system by identifying relevant features. Chapter 3 presents the results of the study. It includes the performance evaluation of the smart chair-based posture classifier and that of the CLBP recognition system. Chapter 3 also presents the results from the comparison of the CLBP patients and non-patients in sitting behaviors. Chapter 4 provides a discussion of the study findings.
Finally, some concluding remarks, including possible implications of the research findings, limitations of the study, and future research directions, are given in Chapter 5.
5
Chapter 2 Method
2.1 Smart chair-based posture classifier
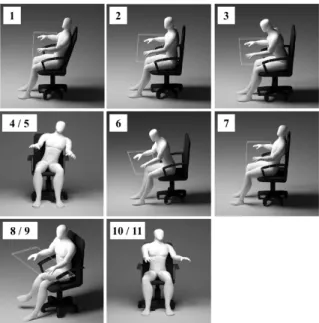
A real-time sitting posture classification system was developed utilizing a sensor-embedded smart chair. The system classifies a sitting posture at a particular time instant as one of eleven predefined sitting posture categories. The eleven sitting posture categories are presented in Figure 1. They are: (1) keeping back against lumbar support, (2) erect sitting, (3) forward inclination, (4) left legs crossed, (5) right legs crossed, (6) leaning left, (7) leaning right, (8) lumbar convex, (9) slumped sitting, (10) left trunk rotation, and (11) right trunk rotation. The eleven posture categories were selected by reviewing previous ergonomics research studies and ergonomics design guidelines relevant to sitting postures and seated work tasks (Jeong and Park, 2021). The smart chair was created by attaching a mixed sensor system, which consisted of six pressure sensors and six infrared reflective distance sensors, to a typical office chair (Figure. 2). The pressure sensors were embedded in the seat pan to collect pressure distribution data in real time. The distance sensors were embedded in the seat back to collect distance between the upper-body and the seat back at different positions in the frontal plane.
Jeong and Park (2021) recruited thirty-six participants to collect sitting posture data, which was utilized to train and test a posture classification system. They employed a k-Nearest Neighbor algorithm for posture classification and the classification accuracy was 0.92.
6
In this study, instead of a k-Nearest Neighbor algorithm, six machine learning algorithms were utilized to develop smart chair-based posture classification models. The six algorithms were: the extreme gradient boosting (XGBoost), random forest, the categorical boosting (CatBoost), the light gradient boosting machine (LightGBM), the gradient boosting, and the logistic regression algorithms/methods. These six algorithms were chosen because they were expected to produce high performance in the development of posture classification model. Zemp (2016) discovered that the use of advanced algorithms such as boosting methods and the random forest were effective for classifying the sitting postures.
Ahmad (2021) achieved the best posture classification performance through the LightGBM among five machine learning algorithms (kNN, SVM, decision tree, random forest, LightGBM). Ran (2021) reported that the accuracy of 95.8% was attained through the logistic regression for classifying the sitting postures.
Figure 1 : Eleven sitting posture categories:
(1) Leaning on the seatback while keeping the back straight, (2) detaching the back from the seatback and keeping the trunk erect, (3) flexing the trunk forward about 45 degrees (slouch), (4) leaning against an armrest with lateral bending (left), (5) leaning against an armrest with lateral bending (right), (6) sitting on the leading edge with convex trunk, (7) leaning back with hips slightly forward (slump), (8) legs crossed (left), (9) legs crossed (right), (10) rotating the trunk about 20 degrees (left), and (11) rotating the trunk about 20 degrees (right)
7
2.2 Data collection
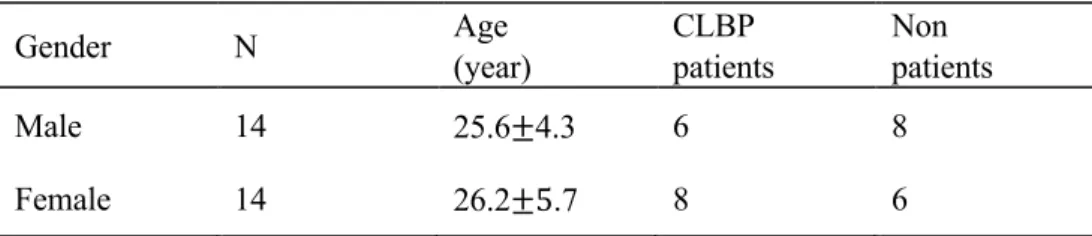
To create a smart chair-based CLBP recognition system on the basis of the smart chair and the posture classifier system, sitting posture-time data were collected from a group of CLBP patients and non-patients. The smart chair and the posture classifier system were utilized for the data collection. Fourteen CLBP patients and fourteeen non-patients were recruited from the Seoul National University community following a screening procedure based on a chronic pain grade (CPG) questionnaire (Von, 1992) (Table 1). The participants were required to complete the CPG questionnaire for assessing pain intensity and pain related functional disability in the previous six months. The CPG questionnaire consists of 7 items, of which scale ranges from 0 ("no pain") to 10 ("worst possible pain"). Using simple scoring rules, pain severity was graded into 4 classes: Grade 1 (low disability, low pain intensity);
Grade 2 (low disability, high pain intensity), Grade 3 (high disability, moderately limiting Figure 2 : Physical construction of the mixed sensor system: (a) placement of sensors, (b) distance and pressure sensors
8
pain intensity), Grade 4 (high disability, severely limiting pain intensity). In this study, the participants in Grade 1 or higher were recruited as CLBP patients, otherwise non-patients (Von, 1992). The exclusion criteria included: (a) participants whose body mass index (BMI) was higher than 40; (b) received a spine or lower extremity surgery or experienced an injury in the body areas during the previous 6 months.
Each participant conducted a one-hour standardized typing task, and, the Bruce’s unusual typing program was utilized for the task. Before beginning the typing task trial, the height of the chair was adjusted so that the knee angle became 90 degrees when the foot touched the ground. The computer monitor was also adjusted to be located at the participant's eye level. The participants were instructed to move as comfortably and naturally as possible during the task trial. The sampling frequency of the sensor data collection was 10Hz.
The study protocol was approved by Seoul National University Institutional Review Board Protocol 2209/002-023 and consent was received from all participants before the experiment.
Table 1 : Participant demographic information
Gender N Age
(year)
CLBP patients
Non patients
Male 14 25.6±4.3 6 8
Female 14 26.2±5.7 8 6
9
2.3 Feature engineering for designing the CLBP recognition system
The smart chair-based CLBP recognition system was conceptualized as utilizing some features computed from a seated person’s posture-time data to perform a binary classification (CLBP vs no CLBP). It was assumed that posture-time data collected over a one-hour time period during a computer typing task would enable CLBP recognition.
To identify useful features, an analysis of the sensor-time data collected from the 28 participants was conducted. The purpose of the data analysis was to identify features that separate the CLBP patient and non-patient group. The data analysis process was as follows:
for each participant, the one-hour sensor data was divided into a series of 5-second data segments. For each 5-second data segment, the median sensor measurement value was determined for each of the 12 sensors (6 pressure and 6 distance sensors). The median values for the 12 values were used together as the input vector to the smart-chair based posture classifier (Section 2.1). Then, the posture classifier determined one of the 11 posture categories as the posture for the 5-second data segment. Thus, each participant’s sitting behavior for the one-hour experimental task trial was represented as a time sequence of 720 postures (each represented as one of the 11 posture categories). A set of numerical summary descriptors of sitting behavior were devised as candidate features for designing the smart chair-based CLBP recognition system (Table 2). They were: a) relative frequency of occurrence for each posture category; b) change of relative frequency of occurrence for each posture category; c) time-averaged peak pressure ratio d) number of posture categories observed; e) number of postural shifts observed. Table 2 provides the definitions of the candidate features. Each of the candidate features summarizes a sitting posture-time sequence consisting of 720 postures.
The CLBP patient and non-CLBP groups were compared for each candidate feature above, and, t-tests were conducted to detect significant statistical differences. The candidate features that showed significant between-group differences were adopted as the features for designing the CLBP recognition system.
10
Table 2 : List of candidate features
Candidate features Definition Relative frequency of
posture category occurrence (for each of the 11 posture categories)
The number of occurrences of each posture category divided by the total number of observations (720 observations in the current study)
Change of relative frequency of posture category occurrence (for each of the 11 posture categories)
The difference between the relative frequency of a posture category for the first 15 minute period and that for the last 15 minute period.
Time-averaged peak pressure ratio
Peak pressure is the maximal pressure around each ischial tuberosity. Time-averaged peak pressure ratio is calculated as the higher PP divided by the lower PP. The higher the PP ratio, the more asymmetrical the sitting posture (Akkarakittichoke, 2016)
Number of posture categories observed
The number of posture categories observed during an experimental task trial (720 observations in the current study)
Frequency of postural category shift
The number of postural category changes that occurred from one 5-second interval to the next one during an experimental task trial (Akkarakittichoke, 2016; Zemp, 2016)
11
2.4 Design and evaluation of CLBP classifier
The dataset for model training and validation was prepared, which consisted of data for the features selected from the data analysis mentioned earlier (Section 2.3). Six machine learning algorithms were utilized to develop CLBP classifier. The six algorithms were: the categorical boosting (CatBoost), the extreme gradient boosting (XGBoost), the gradient boosting, the decision tree, the naïve bayes, and the logistic regression algorithms/methods.
These six algorithms were chosen because they were expected to produce high performance in the development of CLBP classifier. Several studies have shown that bagging/boosting algorithms are effective for classification of LBP/CLBP (Paramesti, 2019; Al Imran, 2020;
Shim, 2021). Besides, decision tree, naïve bayes, and logistic regression still have been actively used and have shown good performance as well (Caza-Szoka, 2015; Sandag,2018;
Paramesti, 2019; Shim, 2021). Selected machine learning algorithms were trained and optimized on the dataset using Python scikit-learn library. Accuracy, precision, recall, and F1-score were considered as major performance metrics, and evaluation was implemented through 10-fold cross validation, which is typically useful when the sample size is small (Vabalas, 2019).
/
12
Chapter 3 Results
3.1 Posture classification performance
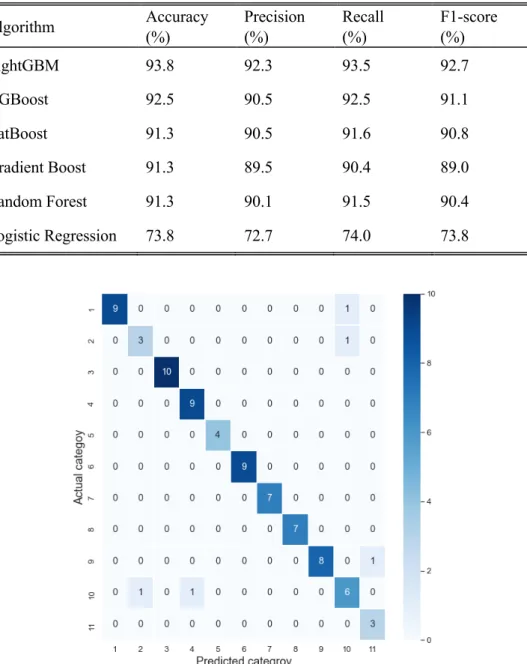
Table 3 presents the performance of the smart chair-based posture classification models produced by the six machine learning algorithms. All the posture classification models showed an accuracy greater than 90% except the logistic regression model. Among the six models, the light gradient boosting machine (LightGBM) model showed the best posture classification performance (accuracy: 93.8%). Thus, this model was utilized as the posture classification model for developing the CLBP recognition system. The confusion matrix for the LightGBM model is presented in Figure 3.
13
Table 3 : Performance of posture classification
Figure 3 : The confusion matrix of the posture classification results (LightGBM)
Algorithm Accuracy
(%)
Precision (%)
Recall (%)
F1-score (%)
LightGBM 93.8 92.3 93.5 92.7
XGBoost 92.5 90.5 92.5 91.1
CatBoost 91.3 90.5 91.6 90.8
Gradient Boost 91.3 89.5 90.4 89.0
Random Forest 91.3 90.1 91.5 90.4
Logistic Regression 73.8 72.7 74.0 73.8
14
3.2 Comparison of CLBP patient and non-patient groups in candidate features
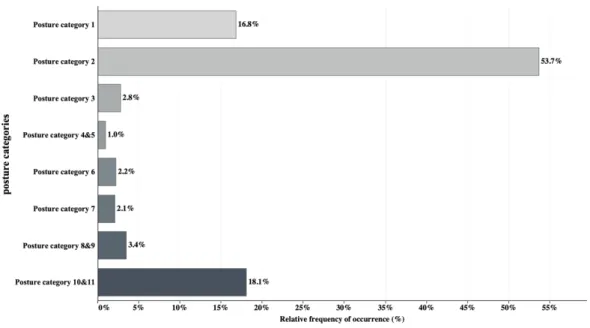
As a result, the relative frequency of occurence for posture category 2 (labeled “detaching the back from the seatback and keeping the trunk erect”) was remarkably high, followed by posture categories 10, 11 (labeled “rotating the trunk about 20 degrees left & right”) and posture category 1 (labeled "keeping back against lumbar support") (Figure 4). It seems to be due to a particular situation that computer typing is performed intensively.
Table 4 presents the results of the between-group comparisons in the candidate features. For each candidate feature in Table 2, the group means and the t-test result are provided. Significant between-group differences were as follows:
l Relative frequency of occurrence for posture category 3 (labeled “flexing the trunk forward about 45 degrees”) was on average larger for the CLBP patient group than for the non-patient group (p-value=0.0193).
l Relative frequency of occurrence for posture categories 4 and 5 (labeled “leaning against an armrest with lateral bending left and right”) was on average larger for the CLBP patient group than for the non-patient group (p-value=0.0058); posture categories 4 and 5 rarely occurred for the non-patient group.
l Change of relative frequency for posture category 2 (labeled “detaching the back from the seatback and keeping the trunk erect”) was on average larger for the CLBP patient group than for the non-patient group (p-value=0.058); the CLBP patients showed positive values and non-patients showed negative values on average, resulting in large differences between the groups.
l Number of posture categories observed was on average larger for the CLBP patient group than for the non-patient group (p-value=0.0124).
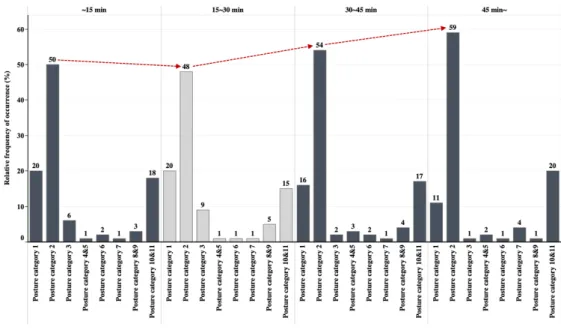
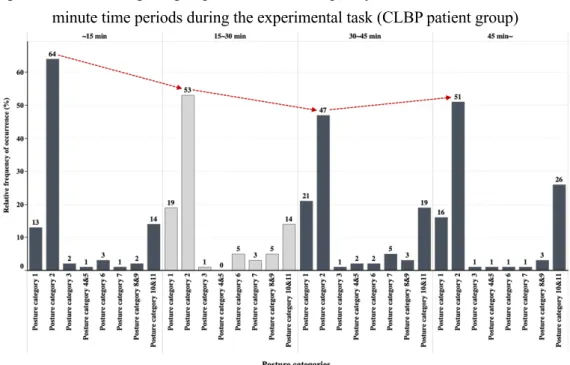
Related to the results on the “change of relative frequency of posture occurrence”
features, Figures 5a and 5b present the time change of the group mean relative frequency
15
distribution across the four 15-minute time periods during the experimental task, respectively for the two participant groups. The two figures show that the time change of relative frequency of occurrence for posture category 2 differed significantly between the two participant groups.
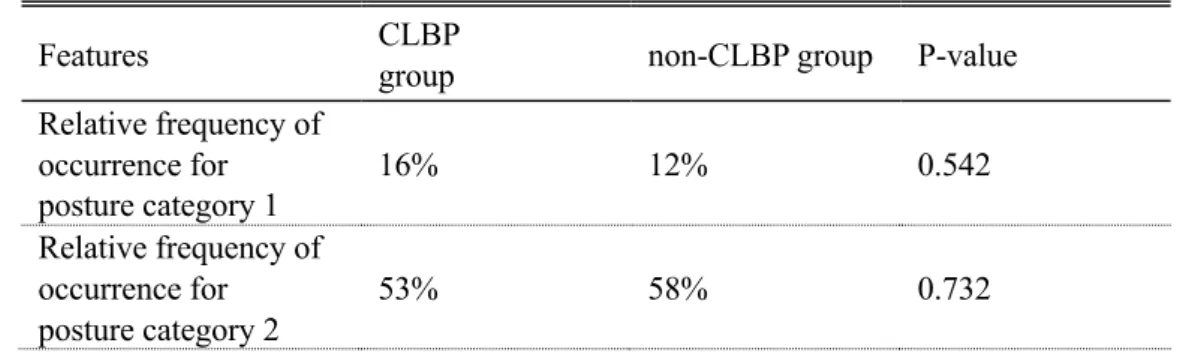
Table 4 : Comparison of CLBP patient and non-patient groups in candidate features: group means and t-test result
Features CLBP
group non-CLBP group P-value
Relative frequency of occurrence for posture category 1
16% 12% 0.542
Relative frequency of occurrence for posture category 2
53% 58% 0.732
Figure 4 : Relative frequency of occurrence for all the posture categories
16 Relative frequency of
occurrence for posture category 3
4% 1% 0.019*
Relative frequency of occurrence for posture category 4&5
2% 0% 0.006*
Relative frequency of occurrence for posture category 6
1% 3% 0.951
Relative frequency of occurrence for posture category 7
2% 3% 0.827
Relative frequency of occurrence for posture category 8&9
4% 3% 0.824
Relative frequency of occurrence for posture category 10&11
18% 20% 0.761
Change of relative frequency of occurrence for posture category 1
-9% 3% 0.179
Change of relative frequency of occurrence for posture category 2
9% -13% 0.058*
Change of relative frequency of occurrence for posture category 3
-5% 0% 0.113
Change of relative frequency of occurrence for posture category 4&5
2% 0% 0.289
Change of relative frequency of occurrence for posture category 6
0% -2% 0.598
17 Change of relative
frequency of occurrence for posture category 7
3% 0% 0.420
Change of relative frequency of occurrence for posture category 8&9
-1% 1% 0.430
Change of relative frequency of occurrence for posture category 10&11
2% 12% 0.335
Time-averaged
peak pressure ratio 1.23 1.18 0.134
Number of posture
categories observed 6.7 4.9 0.013*
Frequency of postural
category shift 91.5 88.3 0.854
18
Figure 5a : Time change of group mean relative frequency distribution across the four 15- minute time periods during the experimental task (CLBP patient group)
Figure 5b : Time change of group mean relative frequency distribution across the four 15- minute time periods during the experimental task (non-patient group)
19
3.3 Performance of CLBP classification
Through the comparative analysis above, the relative frequency of occurrence for posture category 3, 4&5, the change of relative frequency of occurrence for posture category 2, and the number of posture categories observed were adopted as the key features for the smart chair-based CLBP recognition model training.
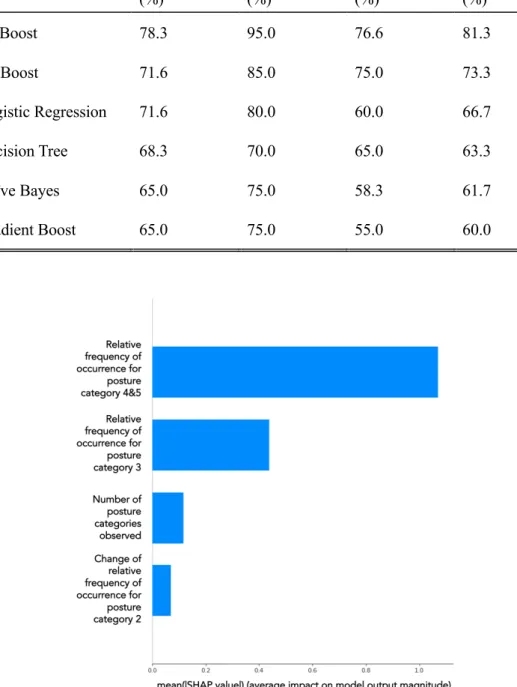
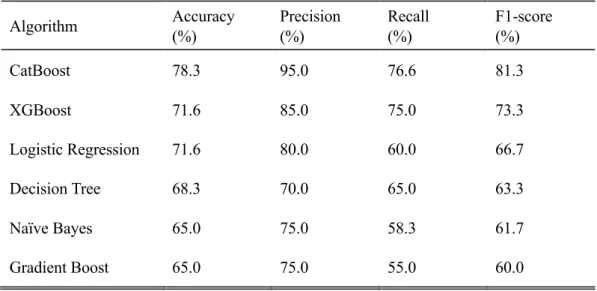
As mentioned earlier, a total of six machine learning algorithms were considered for training the binary classification model for recognizing the presence of CLBP. After training and optimizing, the six resulting models were tested and evaluated using the 10- fold cross-validation scheme. As shown in Table 5, the CatBoost model achieved the best performance (accuracy of 78.3% and F1-score of 81.3%), followed by the XGBoost, the logistic regression, the decision tree, the naïve bayes, and the gradient boost model.
To find out reasoning process underneath the algorithmic decisions, SHAP (SHapely Additive exPlanation) was employed to investigate how much each feature contributes to the CatBoost-based model's final prediction. Figure 6 shows the contribution of influencing features in descending order according to the mean absolute SHAP values.
The relative frequency of occurrence for posture category 4&5 was the most influencing feature, followed by the relative frequency of occurrence for posture category 3. The remaining two features (number of posture categories observed, change of relative frequency of occurrence for posture category 2) were not relatively influential on the final prediction.
20
Table 5 : Performance of CLBP classification
Algorithm Accuracy
(%)
Precision (%)
Recall (%)
F1-score (%)
CatBoost 78.3 95.0 76.6 81.3
XGBoost 71.6 85.0 75.0 73.3
Logistic Regression 71.6 80.0 60.0 66.7
Decision Tree 68.3 70.0 65.0 63.3
Naïve Bayes 65.0 75.0 58.3 61.7
Gradient Boost 65.0 75.0 55.0 60.0
Figure 6 : SHAP output of the CLBP classifier
21
Chapter 4 Discussion
4.1 Discussion
This study developed a smart chair-based system to recognize CLBP by analyzing sitting posture-time data during a one-hour seated typing task. The system classified sitting postures into 11 pre-defined posture categories in real-time. Furthermore, it performed various posture analyses such as the relative frequency of occurrence for each posture category, the number of postural categories observed, etc. Finally, the CLBP recognition system was developed by utilizing the CatBoost algorithm on a basis of the posture analysis, and its performance was evaluated as well.
The sensor-embedded smart chair system capable of classifying the sitting postures using the kNN algorithm achieved an accuracy of 0.92 (Jeong and Park, 2021). In this study, the performance of the posture classifier was improved by using LightGBM instead of the kNN algorithm, achieving accuracy of 0.94.
Afterward, development of the binary classification of CLBP was tried, and total of six algorithms (CatBoost, XGBoost, gradient boost, decision tree, naïve bayes, logistic regression) were trained and tested in 10-fold cross validation. CatBoost algorithm showed the best performance in terms of accuracy (0.78) and F1-score (0.81).
The CLBP patients took posture category 3 (labeled “flexing the trunk forward
22
about 45 degrees”) more than the non-patients (Table 4). Van (2009) found that people with CLBP showed higher angular deviation in the anterio-posterior direction than normal people while sitting, and which would be reflected in a higher relative frequency of occurrence for posture category 3 in the CLBP group. Akkarakittichoke (2016) discovered that the CLBP group took more slumped sitting posture (posture category 3) than normal people during an hour of computer work, which is aligned with our experimental result.
The CLBP patients also took posture categories 4&5 (labeled “leaning against an armrest with lateral bending left and right”) more than the non-patients (Table 4). Al-Eisa (2006) showed that there is a significant difference between the CLBP group and the non- CLBP group in lumbar lateral flexion. The range of lumbar lateral flexion during sitting was higher in the CLBP group than in the control group, and which would be reflected in a higher relative frequency of occurrence for posture categories 4&5 in the CLBP group as well in this study.
The difference in posture categories 3, 4&5 between the two groups may be attributed to the CLBP impacts on postural sway during prolonged sitting. The postural sway of LBP patients increased more than that of the healthy people over time (Hamaoui, 2003).
Higher postural sway is highly correlated to larger angular deviation of anterio-posteior movement of trunk (Van, 2009) and the range of lumbar lateral flexion (Al-Eisa, 2006), which resulted in a high relative frequency of posture category 3, 4&5.
The two participant groups exhibited different patterns in the time change of relative frequency of occurrence for posture category 2 (labeled “detaching the back from the seatback and keeping the trunk erect”) (Table 4). For the CLBP patient group, from the first 15-min period to the last, relative frequency of occurrence for posture category 2 increased (Figure 5a). On the other hand, the non-patient group showed a gradual decrease in relative frequency of occurrence for posture category 2 (Figure 5b). The longer they sit, the greater the discomfort (Waongenngarm, 2015) so that they try to relieve the discomfort by keeping the trunk erect.
23
There was also a difference in the number of posture categories observed (Table 4). CLBP patients took more diverse postures (6.7) than non-patients (4.9) on average.
CLBP patients were likely to have taken more diverse sitting postures to avoid and relieve the pain caused by prolonged sitting. As described above, this study contributed to producing knowledge about the postural characteristics of people CLBP patients.
The development of the smart chair-based CLBP recognition system was successful. The final model developed based on the CatBoost algorithm achieved the accuracy of 78.3% and the F1-score of 81.3%. The precision and recall of the model were 95.0% and 76.6%. Interestingly, the precision was much higher than the recall, and this phenomenon was identified in the remaining other algorithms as well (Table 5). That is, if the CLBP recognition system diagnoses the user as a CLBP patient, it is a highly reliable result. However, if the CLBP recognition system predicts the user as a non-patient, it is not a credible result. In most of cases, algorithms should have a good balance between recall and precision.In case of medical diagnosis, the recall is more favorable metric because it is more important not to miss a disease than to have more false positives. (Roblot, 2019).
Therefore, it is essential to improve the recall to increase the acceptance of the smart chair- based CLBP recognition system.
It was possible to classify the presence or absence of CLBP with only four adopted features (the relative frequency of occurrence for posture category 3, 4&5, the change of relative frequency of occurrence for posture category 2, and the number of posture categories observed). However, as shown in Figure 6, the relative frequency of occurrence for posture category 3 and 4&5 played a key role among the four features in CLBP classification. Therefore, the relative frequency of occurrence for posture category 3 and 4&5 should be included as key variables to progress the smart chair-based CLBP recognition system in the future.
24
If a real-time alarm service is provided by linking the system proposed in this study with a sensor or application, it is possible to reduce/prevent the deterioration of disease by recognizing CLBP that was not previously recognized. The results of this study can serve as a cornerstone of future research that utilizes the smart chair system to collect and analyze data of seated people to predict chronic low back pain. In addition, receiving an alarm from the data that future back pain may occur can induce prevention in advance because it can alert the management of CLBP.
This study was about recognizing CLBP using the collected data when performing the typing task for an hour during a prolonged sitting, but there are various tasks other than computer typing in the actual environment. If data would be collected in various situations in the future, the smart chair-based CLBP recognition system would recognize the presence of CLBP in various environments. A further collection of more subjects will be required to improve the accuracy of the model. Finally, research on predicting the future occurrence of CLBP should be conducted to contribute to the prevention of CLBP.
25
Chapter 5 Conclusion
5.1 Conclusion
A smart chair-based CLBP recognition system was successfully developed using the CatBoost algorithm based on the produced knowledge about the difference in sitting postural pattern between the CLBP patient and non-patient groups. Through the success, it was found that the relative frequency of occurrence for posture category 3, 4&5, the change of relative frequency of occurrence for posture category 2 and the number of posture categories observed were effective in recognizing the presence or absence of CLBP. This study demonstrated that it is possible to recognize CLBP on a basis of sitting posture-time data and will support developing future CLBP diagnosis and prognosis systems.
26
Bibliography
[1] Abdollahi, M., Ashouri, S., Abedi, M., Azadeh-Fard, N., Parnianpour, M., Khalaf, K., & Rashedi, E. (2020). Using a motion sensor to categorize nonspecific low back pain patients: a machine learning approach. Sensors, 20(12), 3600.
[2] Akkarakittichoke, N., & Janwantanakul, P. (2017). Seat pressure distribution characteristics during 1 hour sitting in office workers with and without chronic low back pain. Safety and health at work, 8(2), 212-219.
[3] Al-Eisa, E., Egan, D., Deluzio, K., & Wassersug, R. (2006). Effects of pelvic asymmetry and low back pain on trunk kinematics during sitting: a comparison with standing. Spine, 31(5), E135–E143.
https://doi.org/10.1097/01.brs.0000201325.89493.5
[4] Al Imran, A., Rifat, M. R. I. & Mohammad, R. Enhancing the classi!cation per- formance of lower back pain symptoms using genetic algorithm-based feature selection. In Proc. International Joint Conference on Computational Intelligence, 455–469 (Springer, 2020).
[5] Ahmad, J., Sidén, J., & Andersson, H. (2021). A proposal of implementation of sitting posture monitoring system for wheelchair utilizing machine learning methods. Sensors, 21(19), 6349.
[6] Bacon, Z., Hicks, Y., Al-Amri, M., & Sheeran, L. (2020). Automatic Low Back
27
Pain Classification Using Inertial Measurement Units: A Preliminary Analysis.
Procedia Computer Science, 176, 2822-2831.
[7] Caza-Szoka, M., Massicotte, D. & Nougarou, F. Naive Bayesian learning for small training samples: application on chronic low back pain diagnostic with sEMG sensors. In 2015 IEEE International Instrumentation and Measurement Technology Conference (I2MTC) Proceedings, 470–475 (IEEE, 2015).
[8] Chen, M., Wu, T., Lv, M., Chen, C., Fang, Z., Zeng, Z., ... & Zhang, J. (2021).
Efficacy of mobile health in patients with low back pain: systematic review and meta-analysis of randomized controlled trials. JMIR mHealth and uHealth, 9(6), e26095.
[9] Chou, R., Côté, P., Randhawa, K., Torres, P., Yu, H., Nordin, M., ... & Cedraschi, C.
(2018). The Global Spine Care Initiative: applying evidence-based guidelines on the non-invasive management of back and neck pain to low-and middle-income communities. European Spine Journal, 27(6), 851-860.
[10] Dunk, N. M., & Callaghan, J. P. (2010). Lumbar spine movement patterns during prolonged sitting differentiate low back pain developers from matched asymptomatic controls. Work, 35(1), 3-14.
[11] Greene, J., & Hibbard, J. H. (2012). Why does patient activation matter? An examination of the relationships between patient activation and health-related outcomes. Journal of general internal medicine, 27(5), 520-526.
[12] Hamaoui, A., Do, M. C., & Bouisset, S. (2004). Postural sway increase in low back pain subjects is not related to reduced spine range of motion. Neuroscience letters, 357(2), 135-138.
[13] Hamine, S., Gerth-Guyette, E., Faulx, D., Green, B. B., & Ginsburg, A. S. (2015).
28
Impact of mHealth chronic disease management on treatment adherence and patient outcomes: a systematic review. Journal of medical Internet research, 17(2), e3951.
[14] Hu, B., Kim, C., Ning, X., & Xu, X. (2018). Using a deep learning network to recognise low back pain in static standing. Ergonomics, 61(10), 1374-1381.
[15] Jeong, H., & Park, W. (2021). Developing and evaluating a mixed sensor smart chair system for real-time posture classification: Combining pressure and distance sensors.
IEEE Journal of Biomedical and Health Informatics, 25(5), 1805-1813.
[16] Liew, B. X., Rugamer, D., De Nunzio, A. M., & Falla, D. (2020). Interpretable machine learning models for classifying low back pain status using functional physiological variables. European Spine Journal, 29(8), 1845-1859.
[17] Marras, W. S., M. Parnianpour, S. A. Ferguson, J. Y. Kim, R. R. Crowell, S. Bose, and S. R. Simon. 1995. “The Classification of Anatomic- and Symptom-based Low Back Disorders Using Motion Measure Models.” Spine 20: 2531–2546.
doi:10.1097/00007632-199512000-00013
[18] Mork, P. J., & Bach, K. (2018). A decision support system to enhance self- management of low back pain: protocol for the selfBACK project. JMIR research protocols, 7(7), e9379.
[19] Muslim, K., Bazrgari, B., Hendershot, B., Toosizadeh, N., Nussbaum, M. A., &
Madigan, M. L. (2013). Disturbance and recovery of trunk mechanical and neuromuscular behaviors following repeated static trunk flexion: influences of duration and duty cycle on creep-induced effects. Applied ergonomics, 44(4), 643- 651.
[20] Mychaskiw, M. A., & Thomas III, J. (2001). ND1: INDIRECT COSTS DUE TO BACK PAIN IN THE UNITED STATES. Value in Health, 4(6), 416-417.
29
[21] O'Sullivan, K., O'Keeffe, M., O'Sullivan, L., O'Sullivan, P., & Dankaerts, W. (2012).
The effect of dynamic sitting on the prevention and management of low back pain and low back discomfort: a systematic review. Ergonomics, 55(8), 898-908.
[22] Paramesti, M. A., Prawiningrum, A. F., Syababa, A. D., Munggaran, H. R., Harimurti, S., Adiprawita, W., ... & Herman, I. (2019, April). Lower Back Pain Classification Using Machine Learning. In 2019 Asia Pacific Conference on Research in Industrial and Systems Engineering (APCoRISE) (pp. 1-6). IEEE.
[23] Parthan, A., Evans, C. J., & Le, K. (2006). Chronic low back pain: epidemiology, economic burden and patient-reported outcomes in the USA. Expert review of pharmacoeconomics & outcomes research, 6(3), 359-369.
[24] Ran, X., Wang, C., Xiao, Y., Gao, X., Zhu, Z., & Chen, B. (2021). A portable sitting posture monitoring system based on a pressure sensor array and machine learning.
Sensors and Actuators A: Physical, 331, 112900.
[25] Rizzo, J. A., Abbott III, T. A., & Berger, M. L. (1998). The labor productivity effects of chronic backache in the United States. Medical care, 1471-1488.
[26] Roblot, V., Giret, Y., Antoun, M. B., Morillot, C., Chassin, X., Cotten, A., ... &
Fournier, L. (2019). Artificial intelligence to diagnose meniscus tears on MRI.
Diagnostic and interventional imaging, 100(4), 243-249.
[27] Sandag, G. A., Tedry, N. E. & Lolong, S. Classi!cation of lower back pain using K- Nearest Neighbor algorithm. In 2018 Sixth International Conference on Cyber and IT Service Management (CITSM), 1–5 (IEEE, 2018).
[28] Sheeran, L., Sparkes, V., Whatling, G., Biggs, P., & Holt, C. (2019). Identifying non- specific low back pain clinical subgroups from sitting and standing repositioning posture tasks using a novel Cardiff Dempster–Shafer Theory Classifier. Clinical
30 Biomechanics, 70, 237-244.
[29] Shim, J. G., Ryu, K. H., Cho, E. A., Ahn, J. H., Kim, H. K., Lee, Y. J., & Lee, S. H.
(2021). Machine Learning Approaches to Predict Chronic Lower Back Pain in People Aged over 50 Years. Medicina, 57(11), 1230.
[30] Telfer, S., Spence, W. D., & Solomonidis, S. E. (2009). The potential for actigraphy to be used as an indicator of sitting discomfort. Human Factors, 51(5), 694-704.
[31] Vabalas, A., Gowen, E., Poliakoff, E., & Casson, A. J. (2019). Machine learning algorithm validation with a limited sample size. PloS one, 14(11), e0224365.
[32] Van Daele, U., Hagman, F., Truijen, S., Vorlat, P., Van Gheluwe, B., & Vaes, P. (2009).
Differences in balance strategies between nonspecific chronic low back pain patients and healthy control subjects during unstable sitting. Spine, 34(11), 1233-1238.
[33] van der Roer, N., Goossens, M. E., Evers, S. M., & van Tulder, M. W. (2005). What is the most cost-effective treatment for patients with low back pain? A systematic review. Best practice & research Clinical rheumatology, 19(4), 671-684.
[34] Vergara, M., & Page, Á. (2002). Relationship between comfort and back posture and mobility in sitting-posture. Applied ergonomics, 33(1), 1-8.
[35] Von Korff, M., Ormel, J., Keefe, F. J., & Dworkin, S. F. (1992). Grading the severity of chronic pain. Pain, 50(2), 133-149.
[36] Waongenngarm, P., Rajaratnam, B. S., & Janwantanakul, P. (2015). Perceived body discomfort and trunk muscle activity in three prolonged sitting postures. Journal of physical therapy science, 27(7), 2183-2187.
[37] Zemp, R., Tanadini, M., Plüss, S., Schnüriger, K., Singh, N. B., Taylor, W. R., &
Lorenzetti, S. (2016). Application of machine learning approaches for classifying sitting posture based on force and acceleration sensors. BioMed research
31 international, 2016.
[38] Zemp, R., Fliesser, M., Wippert, P. M., Taylor, W. R., & Lorenzetti, S. (2016).
Occupational sitting behaviour and its relationship with back pain–A pilot study.
Applied ergonomics, 56, 84-91.
[39] Zurada, J., W. Karwowski, and W. Marras. 1997. “A Neural Network-based System for Classification of Industrial Jobs with Respect to Risk of Low Back Disorders Due to Workplace Design”. Applied Ergonomics 28: 49–58. doi:10.1016/S0003- 6870(96)00034-8
32
국문초록
본 연구는 스마트 의자를 활용해 오랜 시간 의자에 앉아있을 경우, 그 자세를 분석하여 만성요통의 유무를 진단하고자 하였다. 스마트 의자는 좌판에 압력 센서
6개, 등판에 적외선 거리 센서 6개를 부착하여 개발되었으며, 실시간으로 총
11개의 앉은 자세를 분류해낸다. 본 연구에서는 이전 연구에서 적용되었던 kNN
알고리즘 대신 LightGBM 알고리즘을 적용하여 분류기의 성능을 높였으며, 개선된 스마트 의자는 데이터 수집을 위한 목적으로 실험에 활용되었다. 이후, 만성요통 환자 14명, 정상인 14명을 모집하여 1시간 동안 스마트 의자에 앉아 컴퓨터 타이핑을 실시하도록 하였으며, 스마트 의자를 통해 센서값을 실시간 수집하여 데이터셋을 구축하였다. 구축된 데이터셋을 바탕으로 만성요통 환자와 정상인 간 앉은 자세를 비교 분석하였으며, 분석 결과를 바탕으로 만성요통 진단 시스템 구축을 위한 변수를 채택하였다. 최종적으로, 구축된 데이터셋과 채택된 변수를 중심으로 CatBoost 알고리즘을 적용하여 만성요통 진단 시스템을 성공적으로 개발할 수 있었다. 본 연구를 통해 앉은 자세를 분석하는 것만으로 만성요통의 진단이 가능하다는 점을 밝힐 수 있었으며, 만성요통 환자의 앉은 자세 패턴, 시계열에 따른 자세 변화와 관련하여 새로운 지식을 제공하였다는 점에서 의의가 있다. 이러한 연구 결과는 향후 만성요통 진단 및 예측 시스템 개발에 크게 기여할 것으로 기대된다.
33
주요어: 만성요통, 기계학습, 자세 분류 시스템, 스마트 의자 학번: 2021-22053