1. Introduction
Natural land cover continuously undergoes changes impacted by natural disturbances such as fires and floods as well as human activities such as urbanization and agricultural activity. It is important to detect land cover change, investigate the factors to cause them and produce predictions about long-term dynamics for the sake of environmental management. Remote sensing by satellites has provided a timely and cost-effective source of land cover information and become an important tool
for monitoring changes on the earth’s surface, such as status of vegetation, urbanization, degradation and many other landscape phenomena, because remotely sensed imagery contains various levels of information over a large area. In addition, it also makes long-time environmental monitoring possible allowing a quantitative measurement of the state of the landscape at any point in time. For this, remotely sensed data are processed and analyzed utilizing various landscape models in regional to global scale.
This study focused on providing a methodology to utilize temporal information obtained from remotely
Feature Extraction System for Land Cover Changes Based on Segmentation
Myunghee Jung* and Eui-Jung Yun**
Dept. of Digital Media Engineering, Anyang University*, Dept of Information and Control Engineering, Hoseo University**
Abstract : This study focused on providing a methodology to utilize temporal information obtained from remotely sensed data for monitoring a wide variety of targets on the earth’s surface. Generally, a methodology in understanding of global changes is composed of mapping, quantifying, and monitoring changes in the physical characteristics of land cover. The selected processing and analysis technique affects the quality of the obtained information. In this research, feature extraction methodology is proposed based on segmentation. It requires a series of processing of multitempotal images:
preprocessing of geometric and radiometric correction, image subtraction/thresholding technique, and segmentation/thresholding. It results in the mapping of the change-detected areas. Here, the appropriate methods are studied for each step and especially, in segmentation process, a method to delineate the exact boundaries of features is investigated in multiresolution framework to reduce computational complexity for multitemporal images of large size.
Key Words : Feature, Extraction, Segmentation, Channge Detection, Multiresolution Framework.
Received 5 January 2004; Accepted 21 May 2004.
sensed data for monitoring a wide variety of targets on the earth’s surface. The methodology in the study of global changes is generally composed of mapping, quantifying, and monitoring changes in the physical characteristics of land cover. A variety of digital image processing techniques are utilized to characterize and analyze features in the data. The selected processing and analysis technique is one of the factors which affect the quality of the information. In this research, feature extraction methodology for detection and mapping of land-cover changes is proposed based on segmentation, resulting in the mapping of the change-detected areas.
The process for it is described shortly as follows:
Preprocessing is composed of radiometric and geometric calibrations and corrections, which are fundamental operation to remove remote sensing instrument artifacts and atmospheric path degradation (Song, 2001; Chavez, 1996). In this study, absolute and relative atmospheric correction methods are shortly described with the analysis case to require the radiometric correction. Then, the change detection is carried out by subtracting the corresponding pixel values of multitemporal images. Finally, a segmentation/
classification is applied to the resultant difference layers to extract features. In these processes, meaningless results, so-called noises, are removed with the help of thresholding based on the histogram of normal distribution with zero mean.
Here, the region-based segmentation method is selected to identify the boundaries of the change- detected areas and enable extraction of each aggregated region. Since remotely sensed imagery is naturally of large size and multitemporal images are to be processed, a method to reduce computational complexity is
preferred. Multiresolution framework permits processing at different resolution: properly large, coarser regions are segmented at low resolution and detailed boundary regions at high resolution, since the interior and boundary regions can be separated at higher levels.
In this study, a multiframe segmentation approach based on the anisotropic diffusion pyramid afforded by the nonlinear smoothing of anisotropic diffusion is considered for accurate boundary delineation of extracted feature (Acton et. al., 1994). Furthermore, anisotropic diffusion yields intra-region smoothing compared with other pyramid structure usually producing inter-region smoothing (Burt et. al., 1981).
This paper is organized as follows: Section II describes key processes which constitute a change detection and feature extraction and then the performance of the algorithm is tested and evaluated with a subset image of Landsat TM in Section III.
Finally, some conclusions and further work are mentioned in Section IV.
2. Feature Extraction Methodology
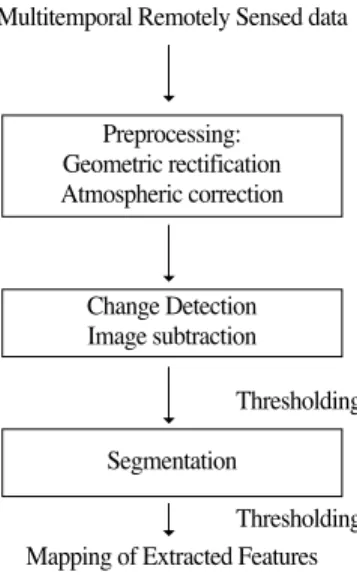
The feature extraction system to detect land-cover changes from the multitemporal remotely sensed data and to extract the detected features as aggregated regions is shown in Fig. 2.
1) Preprocessing
Satellite sensors collect the modified version of the electromagnetic radiation signals due to the scattering and absorption by gases and aerosols from the earth’s surface to the sensor. Radiometric correction is a Fig. 1. Change Detection and Feature Extraction Process.
Multitemporal Image
Preprocessing Data
Change Detection
Feature
Extraction Maps
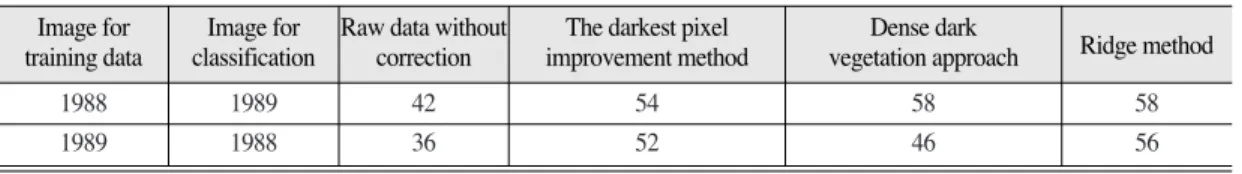
difficult, yet necessary step to correctly utilize the temporal information contained in the spectral data. In processing of multitemporal data set for land use/land cover change, applying the same analysis method to individual images assumes the same bright value distribution for the stable classes and requires radiometric correction due to sensor degradation and atmospheric attenuation, such as the case that image segmentation is applied to each differenced image. Generally, whether atmospheric correction is necessary or not depends on the methodology utilized in applications, which can be briefly summarized in Table 1.
Various correction methods are used to put the images on the same radiometric scale, which are categorized into absolute and relative approaches. While
in absolute correction, a digital number is converted to surface reflectance after atmospheric correction, the same digital number in corrected images is considered as the same reflectance regardless of the actual reflectance value in relative correction. The darkest pixel improvement method is the simplest absolute approach (Chavez, 1988; Chavez, 1989), where the minimum value of the image is subtracted from all the pixels; it is considered to be due to the atmospheric effect. In dense dark vegetation approach, atmospheric optical depth is retrieved based on the relationship between reflectance of mid-infrared and that of blue and red spectra for dense dark vegetation (Kaufman, 1997).
Relative atmospheric correction utilizes the linear relationship between the corresponding bands among successive images, not depending on actual optical properties. First, identify the pseudo-invariant features over the image and determine the linear relationship using their spectral values. Then, normalize all the images to the reference image based on this linear relationship. Various multitemporal images such as Landsat TM, SPOT, and MSS were successfully normalized with properly selected pseudo-invariant features in many change-monitoring researches (Michener and Houhoulis, 1997; schott el. al., 1988).
In a hybrid method, absolute calibration is also applied together with relative method in such that multitemporal images are individually normalized to the reference image and then, absolute approach is applied to them (Song, 2001). In addition, many other correction Fig. 2. Constituent processes in feature extraction system.
Multitemporal Remotely Sensed data
Preprocessing:
Geometric rectification Atmospheric correction
Change Detection Image subtraction
Segmentation
Mapping of Extracted Features Thresholding Thresholding
Table 1. Requirement of atmospheric correction according to image analysis method.
Atmospheric Correction Image Analysis Method
- Usage of a single date data.
- Change detection based on the classified results after each image is individually classified.
Not required - Usage of a composite image which has multitemporal data in single data set after geometric rectification.
- Image differencing pixel by pixel
Required - Analysis assuming the same radiometric characteristics in multitemporal imagery.
Atmospheric Correction Image Analysis Method
methods are further developed based on these basic approaches. It is reported that the complex algorithms don’t consistently provide better results, and all correction algorithms improve the data analysis.
2) Change Detection
The temporal information contained in the spectral data of successive images can be detected with help of radiometric correction. The change detection is performed by subtracting the corresponding pixel values of multitemporal images. At this time, the appropriate bands that best separate certain difference can be selected from multispectral images. For instance, in the case of detection of burned areas, the near-infrared bands give the best results since ash is highly absorptive and vegetation is highly reflective.
In a differenced image, no-change areas show near- zero values and change areas manifest difference values.
However, the noisy information which can not be regarded as the change is also included. A thresholding technique is applied to the difference image to remove the undesirable noisy values, which is based on a histogram of normal distribution with zero mean.
3) Feature Extraction Using Segmentation Based on Anisotropic Diffusion Pyramid In a difference layer obtained from an image sequence, in general, the detected areas are not enclosed by significant edges and don’t form the meaningful features; This is due to spectral error in the image source as well as the applied radiometric correction. The feature extraction system includes region-based segmentation/
classification process that is applied to the pixel-based difference layer for region aggregation, resulting in a map of the extracted features for land cover changes.
In segmentation/classification, a methodology to delineate accurate boundaries is to be considered. In addition, the technique to reduce the computational cost is required since the remotely sensed data are generally
very large and multitemporal images are to be processed. One way to increase the speed of an image analysis algorithm is to reduce the volume of input data.
This approach is naturally related to the concept of multiresolution framework (Rosenfel, 1984). Further- more, it is pointed that multiresolution representations often produce better results in edge detection and region- base segmentation/classification (Rosenfel, 1984). In multiresolution structure, the original high resolution image is at the lowest level and successive levels represent the image of decreasing resolution. Multiscale segmentation approach allows aggregated regions at different resolution and properly segments large, homogeneous regions and detailed boundary regions since the interior and boundary regions can be separated at higher levels.
The Gaussian pyramid is generally utilized in segmentation (Burt et al., 1981) where the initial pyramid levels are constructed through averaging the values of corresponding nodes in previous lower level and image segments are represented by son-to-father links. The inter-level smoothing in the Gaussian pyramid tends to blur and distort region boundaries with increasing levels. The pyramid segmentation method based on the anisotropic diffusion is afforded by the nonlinear smoothing of anisotropic diffusion (Perona and Malik, 1990). The anisotropic diffusion pyramid produces intra-region smoothing which can preserve both boundary and intensity information (Scott et al., 1994). Resolution transformation can be carried out with a progress by the heat diffusion equation in the following,
S
i,j,t= div(c
i,j,tS) (1)
where is the gradient operator, div is the divergence operator, and c
i,j,tis the heat diffusion coefficient at site (i,j) and iteration t.
Anisotropic diffusion where diffusion is allowed to
vary according to the magnitude of the local gradient is
usually operated in four directions (N, S, W, and E) as in Eq. (2).
S
i,j,t+1= S
i,j,t+ D(c
N N+c
S S+c
E E+c
W W) (2)
N
= S
i-1,j,N- S
i,j,NS
= S
i-1,j,S- S
i,j,SE
= S
i-1,j,E- S
i,j,EW
= S
i-1,j,W- S
i,j,Wwhere c is the function of the differenced value of the neighboring pixels and calculated as follows:
c
N= g(||
N||) (3)
There are many possible choices for g( ·) depending on the extent of smoothness. Nonnegative monotoni- cally decreasing functions can be utilized such that neighborhood smoothing is inhibited at the boundary areas where the local image gradient is large. In this study, the following equation,
g(||
N||) = exp(-
2