IEG 환경지질연구정보센터
3
0
0
전체 글
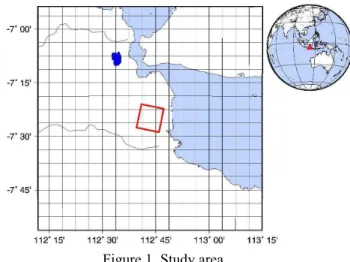
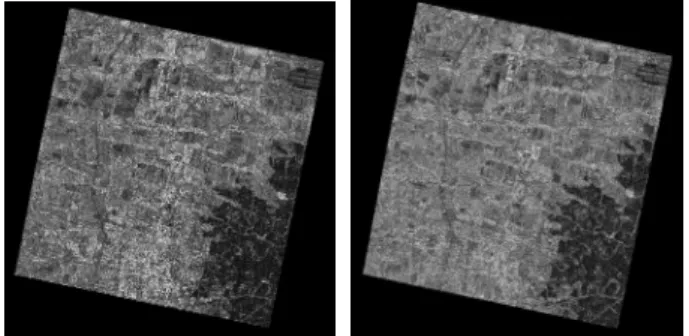
(2) For this area we had a TerraSAR-X SAR images from December, 2007. TerraSAR-X image is processed the Geocoded Ellipsoid Corrected (GEC). Imaging mode is Spot light (SL) mode with pixel spacing is 1.5m in range direction and 1.5m azimuth. Image dimension is 10km in range and 10km in azimuth direction. The GEC product is a multi look detected product. It is projected and re-sampled to the WGS84 reference ellipsoid assuming one average terrain height. Available grid formats are UTM and UPS. As the ellipsoid correction does not consider a DEM, the pixel location accuracy varies due to the terrain. The accuracy measures provided in chapter 4 are valid for flat surfaces. For other types of relief, the terrain induced SAR specific distortions will not be corrected and significant differences can appear in particular for strong relief and steep incidence angles. Resolution mode is processed spatially enhanced (SE). The spatially enhanced product is designed for the highest possible square ground resolution. Depending on imaging mode, polarization and incidence angle the larger resolution value of azimuth or ground range determines the square pixel size. The smaller resolution value is adjusted to this size and the corresponding reduction of the bandwidth is used for speckle reduction (Fritz, T., Eineder, M., 2008).. 2.3. Sigma Naught (Radiometric Calibration). Backscattering from a target is influenced by the relative orientation of the illuminated resolution cell and the sensor, as well as by the distance in range between them. The derivation of Sigma Naught thus requires a detailed knowledge of the local slope (i.e. local incidence angle), as shown in (3) and (4) (Infoterra GmbH, 2008). s 0 = b 0 × sin q LOC. (3). Where: θloc is the local incidence angle. It is derived from the Geocoded Incidence Angle Mask (GIM) that is optional for the L1B Enhanced Ellipsoid Corrected (EEC) product ordering. s 0 dB = b 0 dB + 10log10 (sin q LOC ). (4). Figure 3 show the evolution of Sigma Naught backscattering coefficients from a scene.. Figure 3. Backscattering coefficient images (HH pol.: left, VV pol.:right). 3. RESULTS AND DISCUSSION. Figure 2. Data sets (HH pol.: left, VV pol.:right) Table 1. Main characteristics of TSX image in study area Date 22/DEC/2007. 2.2. Imaging mode Spot light. Inc. angle 36.5. Orbit Descending. Pol. HH,VV. Beta Naught Computation (Radar Brightness). The radar brightness β0 is derived from the image pixel values or digital numbers (DN) applying the calibration factor KS (1). b 0 = K s × DN. 2. (1). where: KS is the calibration and processor scaling factor given by the parameter calFactor in the annotated file. DN is the pixel intensity values, Equation (2) converts β0 to dB b 0 dB = 10glog10 ( b 0 ). (2). As we apply for Equation (1) and (2), in case of HH polarization Beta nought value distributes from -49.5dB to 40.7dB and mean value is -3.5dB. In case of VV polarization Beta nought value distributes from -49.5dB to 40.5dB and mean value is -4.3dB. Beta nought value of HH and VV polarization are shown a little difference. When we compare to backscattering coefficient, HH polarization backscattering coefficient distribute from 50.02dB to 40.70dB and mean value is -3.7dB. In case of VV polarization backscattering coefficient distribute from -51dB to 40.1dB and mean value is 6.5dB. Backscattering coefficient difference of HH and VV polarization are shown more variable than Beta nought values but difference is a little change..
(3) 4. CONCLUSIONS. This study presents the use of dual-polarization X band SAR images to analyze the characteristic agricultural area information and possibility. There are many factors effect to the backscattering coefficient and many error sources. Compared to optical sensors, SAR does not suffer from limitations due to cloud cover and darkness, therefore SAR imagery can be useful in land-oriented studies of any part of the Earth and polarization information can be used to classification in land cover mapping. In this study, we choose the three polarization bands and we perform the assign the RGB color composition(R: VV, G: VV+HH, B: VV) (Figure 5). RGB color composites polarization band shows similar with a little optical image. Dark area shown terrace cropping area and urban road, white and bright color shows artificial structure and some kinds of high tree, blue color appeared coffee cultivated area. Based on chosen the three polarization information, we can analyze the surface monitoring in the future. 5. REFERENCES. Figure 4. Backscattering coefficient of agricultural area by polarization difference When we analyze into the agricultural area by class, backscattering coefficient effects by land cover surface roughness. In case of previous study, the difference between smooth and rough areas varies from 3.5 dB to 5.5 dB at high incidence angles (50°–52°), and from 2 dB to 4 dB at low incidence angles (26°–28°) (Baghdadi N., Zribi M., et al., 2008).. Baghdadi N., Zribi M., et al., 2008, Analysis of TerraSAR-X data and their sensitivity to soil surface parameters over bare agricultural fields, Remote Sensing of Environment, 112, pp. 4370–4379. Fritz, T., Eineder, M., 2008, TerraSAR-X Basic Product Specification Document, TX-GS-DD-3302, Issue 1.5. Fritz, T., 2007, TerraSAR-X Level 1b Product Format Specification, TX-GS-DD-3307, Issue 1.3. Infoterra GmbH, 2008, Radiometric calibration of TerraSAR-X Data, http://www.infoterra.de/fileadmin/ Verzeichnisordner/Dokumente/2_AboutUs/0207_Formal Docs/TSXX-ITD-TN-0049-radiometric_calculations_I1. 00.pdf.. Figure 5. Band composition image (R:VV, G:VV+HH, B:HH).
(4)
수치

관련 문서
벨라루스에서 영업 중인 화장품 판매 오프라인 전문매장 가운데 비교적 인지도가 높은 매장(브랜드)을 꼽자면, 벨라루스 로컬 브랜드 매장으로는 Belita Vitex, Mila,
• Transcortical sensory aphasia is caused by damage just caudal to Wernicke’s area, the left angular gyrus (posterior language area). Transcortical Sensory Aphasia is
depends on the size and shape of the drainage area, type of surface, slope of the drainage area,. rainfall intensity, and whether the flow is entirely over land
Указание ложной информации может привести к аннулированию визы и разрешения на пребывание, а также может повлечь за собой уголовное
벨라루스에서는 특히 간장의 경우 상당 소비량이 소위 초밥과 같은 싸지 않은 식품들과 함께 소비가 되는 편인데, 이에 사람들의 낮아진 가처 분 소득도 간장의 판매량
자료원 : 벨라루스 통계청, 벨라루스 관세청, https://connect.ihs.com(Global Trade Atlas), www.belta.ru, www.news.tut.by,
참고로 대한민국은 2014년 9월에 Hi-Tech Park 내에 ‘한-벨 정보접근센터’를 개소하여, 센터 내 한국문화체험라운지, 인터넷 라운지, ICT랩, 세미나룸을 갖추고
Hairdressing Appliances And Hand Dryers, Space-Heating And Soil-Heating Apparatus, Water Heaters, Immersion Heaters, Smoothing Irons, Microwave Ovens, Ovens,
