PHENOLOGICAL ANALYSIS OF NDVI TIME-SERIES DATA ACCORDING TO VEGETATION TYPES
USING THE HANTS ALGORITHM
Yong Huh, Kiyun Yu, YongIl Kim
Spatial Informatics and Systems Lab, Seoul National University, Sillim-dong, Kwanak-gu, Seoul, Korea
Email : [email protected], [email protected], [email protected]
Annual vegetation growth patterns are determined by the intrinsic phenological characteristics of each land cover types.
So, if typical growth patterns of each land cover types are well-estimated, and a NDVI time-series data of a certain area is compared to those estimated patterns, we can implement more advanced analyses such as a land surface-type classification or a land surface type change detection. In this study, we utilized Terra MODIS NDVI 250m data and compressed full annual NDVI time series data into several indices using the Harmonic Analysis of Time Series(HANTS) algorithm which extracts the most significant frequencies expected to be presented in the original NDVI time-series data. Then, we found these frequencies patterns, described by amplitude and phase data, were significantly different from each other according to vegetation types and these could be used for land cover classification. However, in spite of the capabilities of the HANTS algorithm for detecting and interpolating cloud- contaminated NDVI values, some distorted NDVI pixels of June, July and August, as well as the long rainy season in Korea, are not properly corrected. In particular, in the case of two or three successive NDVI time-series data, which are severely affected by clouds, the HANTS algorithm outputted wrong results.
KEY WORDS: NDVI time-series data, Phenology analysis, HANTS algorithm, Vegetation growth pattern
1. INTRODUCTION
Vegetation growth patterns are mainly determined by the intrinsic phenological characteristics of each land cover types if their environmental conditions such as a precipitation or an atmospheric temperature are nearly the same. Also, these environmental conditions have a strong similarity and an annual periodicity in the same regional area. So, we can monitor or identify vegetation land cover types using the vegetation growth patterns of a certain area.
Most of previous remote sensing researches used a vegetation index, such as NDVI(normalized difference vegetation index) or EVI(enhanced vegetation index) time-series data for monitoring or analysing vegetation growth patterns(Jakubauskas, 2002; Roerink, 2000;
Sakamoto, 2005). These VI are well-established and commonly used vegetation indices because of their roughly correlation with green plant biomass and vegetation cover(Box et al., 1989).
Before NDVI time-series data analysis, two important problems are must be resolved(Azzali, 2000). The first issue is a cloud detection and NDVI reconstruction, and the second is essential information extraction from a vast quantity of time-series data. In general, remote sensing data are affected by several sources on noise, such as the effect of the atmosphere, the instability of sensor response and so on. In particular, NDVI is very easily affected by cloud. So, we should detect and reconstruct these cloud pixels and cloud-contaminated NDVI pixels.
Most of NDVI time-series data consisted of 20~30
images for one year. Some method for extracting meaningful information, which efficiently represent phenological characteristics such as start or end of growing season and the shape of NDVI time-series pattern, should be utilized.
The HANTS (harmonic analysis of NDVI time-series) algorithm was developed to resolve these problems. This algorithm iteratively calculates a Fourier series to approximate a time-series of pixelwise NDVI observation, and at the same time it identifies and omits outliers relative to the approximation model. Then this system re- calculates a Fourier series using the refined time-series data. This process is iteratively executed until certain criteria are met.
In this study, we utilized Terra MODIS NDVI 250m dataset obtained in 2003, and compressed full annual NDVI time series data using the HANTS algorithm. Then we analyzed and compared annual NDVI patterns according to four vegetation land cover types such as a paddy rice area, a crop field area, a coniferous forest area, and a deciduous forest area.
2. DATA AND METHODS 2.1 NDVI time-series data
We accumulated 23 MOD13Q1 products (MODIS /Terra Vegetation Indices 16-Day L3 Global 250m ISIN Grid) which were taken in 2003 to make time-series data.
The MODIS Vegetation Indices (VI) involve
2 transformations of the red (620-670 nm), near-infrared
(841-876 nm), and blue (459-479nm) bands. With these three band data, the VI products contain two indices, the Normalized Difference Vegetation Index (NDVI) and a new Enhanced Vegetation Index (EVI). Originally, the HANTS algorithm was designed for NDVI data and every algorithm parameters also were optimized for NDVI data. So, we chose NDVI data for research.
MOD13Q1 products are made by a compositing scheme, the Constrained View Maximum Value Composite (CV-MVC), with 16 days’ NDVI image stack.
So, MOD13Q1 data are provided every 16 days at a 250- meter spatial resolution. And this product is easily geo- referenced and subset with the MODIS Swath Reprojection Tool (MRTSwath).
2.2 Land cover map
The ministry of environment (Rep. of Korea) made two kinds of land cover map of the whole country using remote sensing data from 1998 to 2004. One was a 1:50,000 scale with 7 classes, and the other was a 1:25,000 scale with 23 classes.
In this research, we used 1:25,000 scale land cover map for training data. With this training data, we subset user- defined area according to land cover types.
2.3 The HANTS algorithm
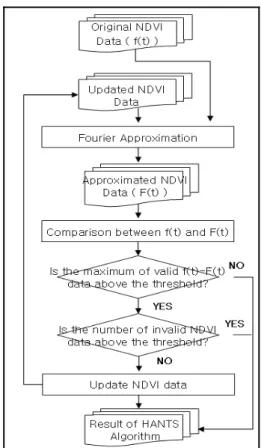
Figure 1. Workflow of the HANTS algorithm This algorithm permits a complex curve to be expressed as the sum of a series of cosine functions using the Fourier approximation (Jakubauskas, 2002). Figure 1
shows the workflow of the HANTS algorithm. At the first approximation process, it uses every NDVI observation values. Then, it compares the original values and smoothed values derived from the Fourier approximation. And the most abnormal NDVI observation value is detected and omitted for next Fourier approximation process. This process is iteratively executed until the user defined conditions are met.
A researcher should design the model to express NDVI time-series data and set up several parameters for stopping the iteration process. The model denotes the number of cosine functions which are represented by amplitude and phase angle. The parameters mean a fit error tolerance (FET) and a degree of over- determinedness (DOD). At a certain iteration process, whole valid NDVI values, the left NDVI valued after the all iterative omission process, can show lesser difference between the Fourier approximation comparing fit error tolerance. Then iteration will stop and the HANTS algorithm outputs a result. And the number of valid NDVI must always be greater than or equal to the number of parameters that describe the curve. DOD decides at least how many NDVI values are used for the HANTS algorithm.
3. IMPLEMENTATION 3.1 Study area
In this research, the study area was located at the boundary between DaeJoen and NonSan, a middle- western area of South Korea. This area has abundant and various vegetation cover. As shown in figure 2, the north-western part of study area is covered by agricultural vegetation and the south-eastern part of the study area is covered by forest vegetation.
Figure 2. Study area of this research 3.2 Model and Parameter settings
Before the HANTS algorithm, a researcher should design a model and parameters to represent whole NDVI time-series data. The HANTS algorithm has an assumption that most of NDVI time-series data have a
3 periodicity within one year and a gentle slope pattern. So,
an entire NDVI data can be compressed with several cosine functions like equation 1
) ) / 2 ( cos ( )
(
1
0
∑
=
− +
= N
n
n
n t n
A A
t
NDVI π ϕ (1)
where t is the time at which a NDVI data was obtained and A0 An, ϕ are amplitude and phase angle. n A0 is the averaged NDVI over whole data. We just determined N, the number of cosine functions. A0 , An , ϕ are n automatically determined by the HANTS algorithm.
Huh (2007) showed that when N = 3, the result was most properly optimised to represent vegetation growth in this study area. And in that paper, FET and DOD were set to 0.05 and 8. As a result, we used these models (N) and parameters (FET and DOD) for this research.
3.3 Research approach to analysis NDVI time-series data analysis
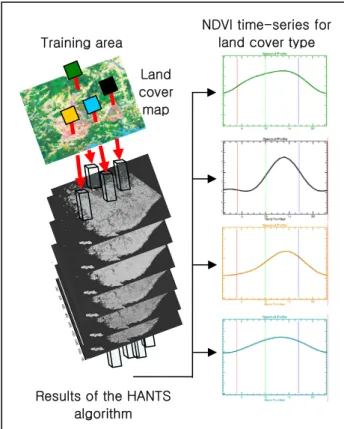
Figure 3. Implementation of this research with land cover map and results of the HANTS algorithm
We used four vegetation types for phenological analysis with NDVI time-series data. These vegetation types were paddy rice, crop field, coniferous forest and deciduous forest. To generate the training area, we used a land cover map with 1:25,000 scale. However, this map was made with an approximate 30m resolution sensor data such as LANDSAT ETM+ and IRS-1D images and many of the paddy rice and crop field are much smaller than the MODIS NDVI resolution(250m). So, many of NDVI pixels were typically mixtures of two or three land
cover types. To identify representative pixels and generate training areas with those pixels, we selected uniform land cover area greater than 0.25km2 using the land cover map. However, most of crop field area could not satisfy this criterion, because they located between large paddy rice areas, forest areas, and urban areas with insufficient sizes for this research project. Then, we subset NDVI time-series data according to the training area and analyzed
4. RESULT
Figure 4. Averaged NDVI time-series and error bar with one standard deviation
Figure 4 shows four averaged and reconstructed NDVI time-series data using the HANTS algorithm according to land cover types with error bar graphs. Crop field and Land
cover map Training area
NDVI time-series for land cover type
Results of the HANTS algorithm
Crop field
Paddy rice
Coniferous forest
Deciduous forest
4 paddy rice areas showed nearly the same growth pattern.
Crop fields had unstable NDVI time-series data as its relatively large standard deviation distribution on the entire time span.
Table 1 showed result of the HANTS algorithm, the amplitude and phase angle to construct a NDVI time- series model. Paddy rice and crop fields showed very similar amplitude and phase angle. It could explain by human activities about regularised and generalised farming processes. Coniferous and deciduous forest areas showed some difference with respect to ϕ . This meant 1 deciduous forest have early starts in the growing season.
Table 1. Amplitude and phase angle values derived from the HANTS algorithm to reconstruct NDVI time-series data
Paddy rice
Crop field
Coniferous forest
Deciduous forest A0 0.48280 0.49213 0.69301 0.71252 A 1 0.29815 0.23416 0.21660 0.25050 ϕ1 -122.250 -113.430 -116.380 -129.000
A2 0.11410 0.09609 0.07829 0.04158 ϕ2 123.630 115.570 50.130 -37.500
A3 0.04404 0.03951 0.05930 0.07532 ϕ3 14.500 -12.000 -31.130 -100.670
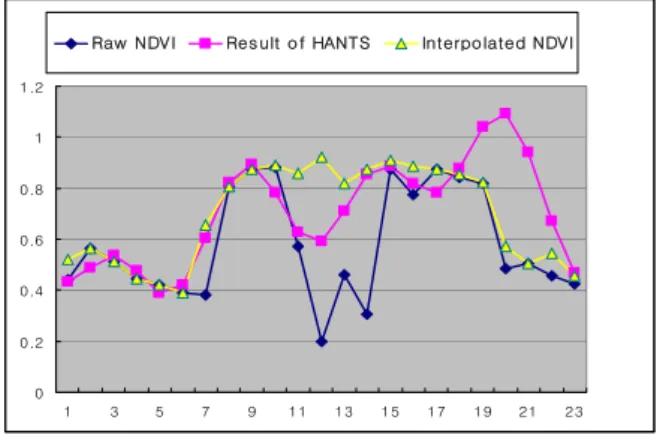
Sometimes there occurred two or three successive cloud-effect NDVI images, which were subsequently inserted into the HANTS algorithm. As shown in figure 5, results were compared with raw NDVI values, or an estimated NDVI, by interpolating with neighboring NDVI values. This figure showed that additional clouds or cloud contaminate NDVI detection and the reconstruction process is necessary.
0 0.2 0.4 0.6 0.8 1 1.2
1 3 5 7 9 11 13 15 17 19 21 23
Raw NDVI Res ult of HANTS Interpolated NDVI
Figure 5. Effect of successive cloud-contaminate NDVI in June and July, the rainy season of study area.
5. CONCLUSION
The purpose of this research was to detect and analyze phenological characteristics of four kinds of vegetation land cover types with NDVI time-series data. As a result, both agricultural areas showed a similar NDVI pattern, and coniferous and deciduous forest showed their
intrinsic NDVI patterns. We could find some possibilities to monitoring and classify land cover types with NDVI time-series data. However, in spite of the capabilities of the HANTS algorithm for detecting and interpolating cloud-contaminated NDVI values, some distorted NDVI pixels from June, July and August, which compose the long rainy season in Korea, are not properly corrected. So, some kind of cloud-detecting and interpolating pre- processing is necessary for further research in this study area.
Acknowledgments
This research is supported in part by Institute of Engineering Science at Seoul National University.
References
Azzali, S., Menenti, M. 2000. Mapping vegetation-soil-climate complexes in southern Africa using temporal Fourier analysis of NOAA-AVHRR NDVI data. Int. J. of remote sensing, 21(5), pp. 973-996.
Box, E., Holben, B., Kalb, V., 1989. Accuracy of the AVHRR vegetation index as a predictor of biomass, primary productivity and net CO2 flux. Vegetation 80, pp.71-89.
Jakubauskas, M.E., Legates, D.R., Kastens, J.H., 2002. Crop identification using harmonic analysis of time-series AVHRR NDVI data. Journal of Computers and electronics in agriculture 37, pp.127-139.
Roerink, G.J., Menenti, M., Verhoed, W. 2000. Reconstruction cloudfree NDVI composites using Fourier analysis of time series. Int.J. of remote sensing 21(9), pp.1911-1917.
Sakamoto, T., Yokozawa, M., et al., 2005. A crop phenology detection method using time-series MODISs data. Remote sensing of environment, 96, pp.366-374.
Huh, Y., Younggi, B., Kiyun, Y,. Yongil K., 2007. A Study of cloud-free MODIS NDVI time series reconstruction using HANTS algorithm. Proceeding of GIS Korea 2007, pp.169-174.