IEG 환경지질연구정보센터
4
0
0
전체 글
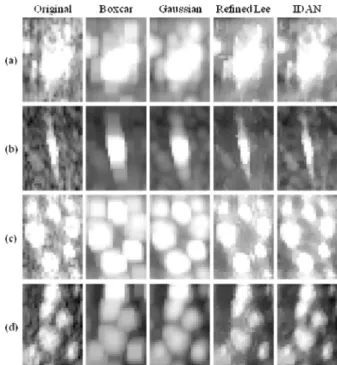
(2) speckle filters such as boxcar, Gaussian, IDAN, and the refined Lee were operated for speckle reduction. In this work, we focused on the analysis of the unsupervised classification results affected by speckle reduction.. bounce reflection and blue color indicates the HH+VV that this is characteristic of scattering over a surface.. Figure 2. Pauli color-coded image (1×4 multilooking).. Figure 1. The GB-SAR system (a), the test site (b and c) inside KIGAM field, and a trihedral corner reflector (d). The GB-SAR image has a dimension of 256×2048 (row×column) pixels and the original data are in the amplitude and phase images after SAR focusing processing. The multi-look image was processed for image compression and reduction of speckle noise and the entropy (H), alpha, and anisotropy (A) decomposition and the combined unsupervised Wishart-H/alpha classification processing for the fully polarimetric GBSAR data were followed. Table 1 shows the cases for multilooking and speckle filtering processing.. Figure 3 displayed the span images from the 5×5 boxcar, Gaussian, the refined Lee, IDAN speckle filter. The original span image is shown in the first column of Figure 3 revealing the typical speckle characteristics of a 1×4 multilook image. A small area of 250×350 pixels was extracted for visual evaluation. The enlarged images of Figure 3 showed a man-made wooden box (a), a trihedral corner reflector (b), tree areas (c and d). The boxcar and Gaussian filter exhibited the severe problem of burring that causes resolution degradation. The refined Lee filter showed its overall good filtering characteristics in retaining subtle details and strong target signatures while reducing speckle effect in homogeneous areas.. Table 1. Multilooking and speckle filtering conditions. Multilooking (row× column) 1×1 1×2 1×3 1×4 2×2 3×3 4×4. Image pixels (row× column) 256×2048 256×1024 256×682 256×512 128×1024 85×682 64×512. Speckle filtering processing (w/s) Boxcar. Gaussian. IDAN. Lee. 3, 5 3, 5 3, 5 3, 5 3, 5 3, 5. 3, 5 3, 5 3, 5 3, 5 3, 5 3, 5. 3, 5 3, 5 3, 5 3, 5 3, 5 3, 5. 3, 5 3, 5 3, 5 3, 5 3, 5 3, 5. 3, 5. 3, 5. 3, 5. 3, 5. 3. RESULTS. The two representations for PolSAR data, named Pauli and Lexicographic (Sinclair) color coding, are generally used. The Pauli color coding is based on a vector representation method of linear combination of scattering matrix elements. The polarimetric channels HH+VV, HH-VV and HV are associated to the blue, red and green colors respectively. As shown in Figure 2, over grass area, the green color indicated a dominant HV component, generally characteristic of vegetated areas. The permanent targets showed that the dominant colors are white and magenta which is the mixture of red and blue. White pixels correspond to equal amplitude over all polarimetric channels, whereas red denote a wave double. Figure 3. The span images of boxcar, Gaussican, IDAN, and the refined Lee speckle filters applying 5 window sizes. The image has a dimension of 250×350 pixels. Figure 4 showed the 2D H/alpha plane described by Cloude and Pottier (1997). The H and alpha plane in Figure 4 is subdivided into 9 zones that characterized different scattering behaviour in order to separate the SAR data into basic scattering mechanisms. The.
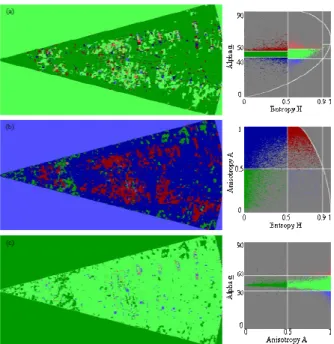
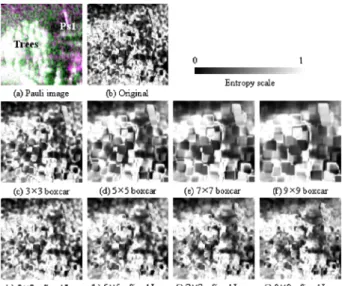
(3) segmentation of the H/alpha plane is offered to illustrate a simple unsupervised classification strategy and to emphasize the geometrical segmentation of physical scattering processing.. Figure 6 displayed the H/alpha occurrence and segmented planes from the original, 1×2, 1×4, and 4×4 multilooking images before and after speckle filtering processing respectively. 2D distribution results applying multilook and speckle filtering processing showed more concentrated on zone 8 and 5 region.. Figure 4. 2D H/alpha plane. Figure 5 showed the unsupervised segmentation images and the distribution results in H/alpha, H/A, and A/alpha spaces based on Cloude and Pottier’s method. The H/alpha results were separated a pixel element of the GB-SAR image into zone 8 and zone 5 mainly as shown in Figure 5(a). The trees and grass area was segmented on zone 5 and 8 that is good agreement with generally vegetated areas. The five permanent scatterers (Ps1 to Ps 5 as shown in Figure 2) were appeared red and blue color pixels in the H/alpha image and the distributed plane.. Figure 5. Unsupervised segmentation of the test site image using the 3-dimenstion H/A/alpha space: (a) H/alpha, (b) H/A, and (c) A/alpha results. Cloude and Pottier’s method was applied with 5 window size before speckle filtering.. Figure 6. The occurrence (left) and segmented (right) planes of H/alpha segmentation results: (a) 1×1, (b) 1×2, (c) 1×4, and (d) 4×4 multilook. Speckle filtering and other averaging processes can affect the inherent scattering characteristics of each pixel. In particular, the results of entropy, anisotropy, and the averaged alpha angle are dependent on the averaging process like a multilooking and a speckle filtering. In general, the entropy value increases with the amount of averaging but anisotropy decreases. The effect of the amount of averaging on the averaged alpha angle is much weaker than that for entropy and anisotropy (Lee and Pottier, 2009). The entropy results shown in Figure 7 were computed from the original 1×4 multilook data (Figure 7(b)). As shown in Figure 7(a), the example image was contained one permanent scatter (Ps1) and trees on a small hillock area. The extracted entropy value increases and the spatial resolution decreases as shown in Figure 7(c) to (f), for the 3×3 to 9×9 boxcar filters. The resolution degradation effect is very noticeable even for the 5×5 boxcar filter, and the square imprints are clearly shown. The high entropy areas, shown in white for values greater than 0.7, increase significantly for the 9×9 boxcar filter, especially in the trees area. The refined Lee filter performed reasonably well as shown in Figure 7(g) to (j). We can observed that the entropy image from the refined Lee filter also shown in white for a high value like the boxcar filter results. And the entropy results showed a higher resolution effect than ones from the boxcar filter..
(4) 4. CONCLUSIONS. In this paper, we discussed about the unsupervised classification results of the obtained GB-SAR images applying several polarimetric speckle filtering methods such as boxcar, Gaussian, IDAN, and the refined Lee filters. The unsupervised classification result based on the H/A/alpha decomposition and the combined WishartH/alpha classification was affected by multilooking and speckle filtering processing. The ones applying 1×4 multilook and the refined Lee filter was shown the better unsupervised classification results than other cases. 5. ACKNOWLEDGEMENTS. Figure 7. Speckle filtering effect on the entropy (H) values: (a) Pauli image, (b) entropy from the original (1×4 multilook), (c) to (f) entropy from the boxcar filter, and (g) to (j) entropy from the refined Lee filter. Figure 8 showed the enlarged images of the WishartH/alpha classification result. The classification image area of Figure 8(a) to (e) correspond to 5 red box areas, A to E as shown in Figure 2. Figure 8(a) and (b) contained trees area, the man-made target was in Figure 8(c). Figure 8(d) and (e) showed 5 permanent scatterers. We can see that the ones using the refined Lee filter showed better result than other’s ones.. Figure 8. Wishart-H/alpha classification results applying boxcar, Gaussian, the refined Lee, and IDAN speckle filters. The window size of H/alpha decomposition processing is 3 and 4% for pixels switching class and 5 for maximum number of iterations was used for this classification processing.. This research was supported by a grant (07KLSGC03) from Cutting-edge Urban Development – Korean Land Spatialization Research Project funded by Ministry of Land, Transport and Maritime Affairs of Korean government. 6. REFERENCES. Cloude, S. R. and Pottier, E., 1997. An Entropy Based Classification Scheme for Land Applications of Polarimetric SAR, IEEE Transactions on Geoscience and Remote Sensing, 35(1), pp. 68-78. Lee, H., Cho, S. -J., Sung, N. -H. and Kim, J. -H., 2007. Development of a GB-SAR (II): Focusing Algorithms, Korean Journal of Remote Sensing, 23(4), pp. 247-256. Lee, J. -S., Grunes, M. R., Ainsworth, T. L., Du, L. -J., Schuler, D. L., and Cloude, S. R., 1999. Unsupervised Classification Using Polarimetric Decomposition and the Complex Wishart Classifier, IEEE Transactions on Geoscience and Remote Sensing, 37(5), pp. 2249-2258. Lee, J. -S. and Pottier, E., 2009. Polarimetric Radar Imaging from Basics to Applications, CRC Press, Boca Raton, FL, USA..
(5)
수치
관련 문서
Several methods are considered for permanent disposal of spent nuclear fuel, which is a high-level radioactive waste, such as disposal of the deep layer, disposal of
The results obtained from this paper will provide important physical properties of opto-electronic devices based on two dimensional materials, and will be
This thesis is the study of natural images seen through the sensible eyes of a researcher, more specifically focusing on the contemplation of nature
As the number of clinical cases requiring supracrestal apical-coronal positioning is increasing, we examined the utility of FEA in such cases. In this study,
In this paper, we consider the texture background of rail track images and the sparse foreground of the defects to construct a low-rank matrix decomposition model
1 John Owen, Justification by Faith Alone, in The Works of John Owen, ed. John Bolt, trans. Scott Clark, "Do This and Live: Christ's Active Obedience as the
Therefore, the main contributions of this paper can be summarized as the following. 1) This paper focuses on the manned SNs receive information from RMHs through the
The goal of this paper is to study curriculum and management status of Arts and Culture Education Instructors focused on Korean music among the
