• 검색 결과가 없습니다.

IEG 환경지질연구정보센터

N/A
N/A
Protected

Academic year: 2021

Share "IEG 환경지질연구정보센터"

Copied!
4
0
0

로드 중.... (전체 텍스트 보기)

전체 글

(1)

FUSING OPTICAL AND SAR IMAGES USING WAVELET TRANSFORM AND MULTISCALE IMAGES

Chul-Soo Ye

School of Ubiquitous IT, Far East University

Gamgok-myeon, Eumseong-gun, Chungbuk 369-700, Republic of Korea [email protected]

ABSTRACT : This paper presents a wavelet-based fusion approach for optical and SAR images. We decompose co- registered optical and SAR images into high- and low-frequency bands by Discrete Wavelet Transform (DWT), respectively. To find the fused DWT coefficients, we define the activity measurement of local window area as the gradient from each denoised image. We create multiscale denoised images by applying a modified mean curvature diffusion (MCD) filtering to the original SAR and optical images iteratively and then select one of the denoised images as the input SAR and optical image for the image fusion, respectively. The fused image is obtained by inverse DWT using the fused DWT coefficients. The fusion performance is demonstrated by quantitative experiments using Ikonos and TerraSAR-X satellite images.

KEY WORDS: Image Fusion, Wavelet-based Fusion, Discrete Wavelet Transform, Activity Measurement

1. INTRODUCTION

Image fusion provides profitable information for earth observation by using multiple satellite images. Fusing different sensor images, such as optical and synthetic aperture radar (SAR) images, gives more information needed for earth surface monitoring and analysis. The Wavelet-based image fusion is very interesting and popular among various image fusion algorithms because of its multiresolution decompositions and signal analysis in both spatial and frequency space. Some wavelet-based fusion algorithms have been applied to the fusion of optical and SAR images (Fatone and Maponi, 2001;

Garzelli, 2002; Jun-chul, et al., 2005; Long and Guangfang, 2007).

Some of the previous researches inject relatively strong SAR signals into the fused image. The SAR signals injected into the fused image is a small amount of the whole SAR image. The most residual SAR signals do not contribute to the fused image. It is desirable for the fused image to contain relatively weak SAR signals. In this case, a fusion rule for determining the contribution of each SAR and optical signal to the fused image is needed.

Moreover, noise removal filtering should be applied to the SAR and the optical images before determining each contribution to the fused image.

We present a wavelet-based image fusion rule, which determines the contribution of each image to the fused image by the gradient of each denoised image. Section 2 presents Discrete Wavelet Transform (DWT). Section 3 presents a framework for wavelet-based image fusion scheme. The proposed fusion rule and de-noising method are also presented. Section 4 presents some experimental results, in which TerraSAR-X and Ikonos satellite images are fused. Finally, conclusions are drawn in Section 5.

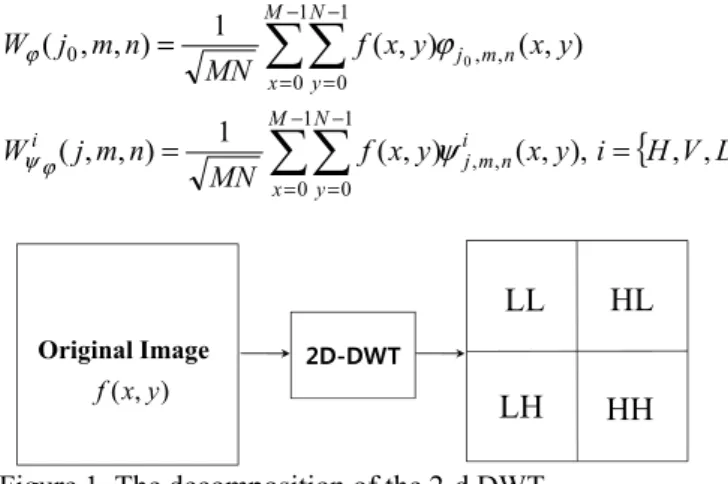
2. 2-D DISCRETE WAVELET TRANSFORM The discrete wavelet transform of image f ( y x , ) of size

N

M × is given as follows (Gonzalez and Woods, 2008) :

{ H V D }

i y x y

x MN f

n m j W

y x y

x MN f

n m j W

i j m n M

x N y i

n m j M

x N

y

, , ), , ( ) , 1 (

) , , (

) , ( ) , 1 (

) , , (

, , 1

0 1 0

, , 1

0 1 0

0

0

=

=

=

∑∑

∑∑

=

=

=

=

ψ ϕ

ψ ϕ ϕ

2D-DWT Original Image

) , ( y x f

LL HL

LH HH

Figure 1. The decomposition of the 2-d DWT.

The 2-d DWT is obtained by applying one-dimensional DWT row-wise and then performing the same process column-wise on the previous one-dimensional DWT result (Figure 1). We write the above equations in the form

).

, ( ) , (

) , ( ) , (

) , ( ) , (

) , ( ) , (

n m W n m I

n m W n m I

n m W n m I

n m W n m I

HH D LH V HL H LL

ψ ψ ψ ϕ

=

=

=

=

where the subscript LL represents a coarse approximation

subband of the original image and the other

subscripts HL , LH and HH represent high-frequency

(2)

subband containing the detail information. The simplest wavelet filter is the Daub4 wavelet with the following four coefficients, c 0 ,..., c 3 :

2 . 4 / ) 3 1 ( , 2 4 / ) 3 3 (

2 4 / ) 3 3 ( , 2 4 / ) 3 1 (

4 3

1 0

⎪⎩

⎪ ⎨

=

=

+

= +

=

c c

c c

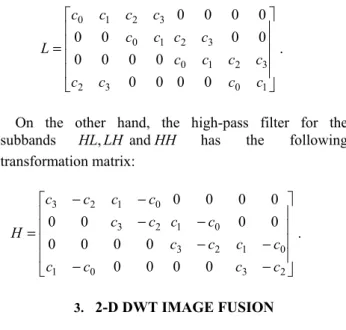
The low-pass filter used for the approximation band LL has the following transformation matrix:

. 0

0

0 0

0 0 0 0

0 0

0 0 0 0

0 0

1 0

3 2 1 0

3 2

3 2

1 0

3 2 1 0

⎥ ⎥

⎥ ⎥

⎢ ⎢

⎢ ⎢

=

c c

c c c c

c c

c c

c c

c c c c L

On the other hand, the high-pass filter for the subbands HL , LH and HH has the following transformation matrix:

. 0

0

0 0

0 0 0 0

0 0

0 0 0 0

0 0

2 3

0 1 2 3

0 1

0 1

2 3

0 1 2 3

⎥ ⎥

⎥ ⎥

⎢ ⎢

⎢ ⎢

=

c c

c c c c

c c

c c

c c

c c c c H

3. 2-D DWT IMAGE FUSION

The proposed 2-D DWT image fusion has three steps.

In the first step, 2-D DWT is applied to co-registered optical and SAR images at one scale, respectively. In the next step, two approximation subbands LL O and LL S are fused by using a fusion rule, which will be explained later.

The three high-frequency subbands, HL , F LH F and HH F of the fused image are formed by inserting those of the optical image (Garzelli, 2002). Finally, the fused image is obtained by applying the inverse 2-D DWT to the wavelet representation in the second step (Figure 2).

2D-DWT

2D-DWT

Weight Decision

Inverse DWT Optical Image

) , ( j i I

O

SAR Image

) , ( j i I

S

LL

O

HL

O

LH

O

HH

O

LL

S

HL

S

LH

S

HH

S

Fusion Rule

LL

F

HL

O

LH

O

HH

O

Fused Image

Figure 2. Block diagram of the proposed image fusion scheme.

3.1 Injecting strong SAR signal into the fused image

Let r ( m , n ) be the ratio between SAR and optical images of size N × , at a pixel location N ( m , n ) in the

LL subband. If the ratio r ( m , n ) is larger than the threshold value k 1 ⋅ T r given as follows, the wavelet coefficient I LL S ( m , n ) is inserted into the fused image.

, )

, ( );

, ( ) ,

( LL S 1 r

LL F m n I m n if r m n k T

I = ≥ ⋅

where .

) , (

) , ( 9

1 1

1 1 1

1 1

∑∑ ∑∑ 1

= = = − = − ⎟ ⎟

⎜ ⎜

+ +

+ +

= ⋅

N m

N

n s t O

LL LL S

r I m s n t

t n s m I N

T N

T r is an global average of the local mean of r ( m , n ) in a 3

3 × window. The constant k 1 controls the level of the threshold value.

3.2 Gradient-based activity measurement

In the case in which the ratio r ( m , n ) is less than the threshold value k 1 ⋅ T r , we use both optical and SAR images to create the fused image. Let us define the activity measurement as the gradient from each image.

The activity measurement determines the amount of contribution of each image to the fused image. If the gradient of a pixel in SAR image is greater than that of the corresponding location in optical image, a larger weight value is assigned to the SAR image during the image fusion. The original SAR image has been affected by speckle noise, it is necessary to compute the gradient after speckle noise filtering. We employ the modified mean curvature diffusion (MCD) filter as a method for the speckle noise filtering, which has the diffusion coefficient as follows:

. 2

|

| 1

1

2 2 2

2 I xx I xy I yy

I

C = + ∇ + + +

This diffusion filter has a good property of thin edge preservation during noise removal. We create multiscale denoised images by applying the modified MCD filtering to the logarithm of the original SAR image iteratively and then reconstruct the denoised image by applying exponential operator to the MCD filtering result. Finally, we select one of the denoised images as the input SAR image for the image fusion. Similarly, apply the MCD filtering to the optical image except the logarithm- exponential operation.

Let G LL O ( m , n ) and G LL S ( m , n ) be the gradient of optical and SAR images, respectively, at the location ( m , n ) in the LL subband. The fused image is obtained via a weighted average of the two images’ gradients as follows :

, )

, (

), , ( ) , , ( ) , ( ) , , ( ) , (

1

2 2 2

1

r

LL S O LL

LL F

T k n m r if

n m I n m k n m I n m k n m I

<

⋅ +

= ω ω

where ,

) , ( ) , (

) , ) (

, ,

( 2 2

1 G m n G m n

n m k G

n m

k S

O LL LL

LL O

⋅ +

ω =

(3)

. ) , ( ) , (

) , ) (

1 ( ) , ,

( 2 2

2 G m n G m n

n m k G

n m

k S

O LL LL

LL S

⋅ +

ω =

The constant k 2 is given by user, to control the contribution of each image to the fused image if necessary.

4. EXPERIMENTS

The proposed fusion algorithm was tested using co- registered TerraSAR-X and Ikonos satellite images (Figure 3). The denoised Ikonos and TerraSAR-X image were obtained after 5 and 50 iterations, respectively, of the MCD filtering (Figure 4). We chose k 1 = 1 . 5 and obtained the fused images with respect to the variation of

k 2 (Figure 5). The value k 2 = 0 . 1 means that 10% of the gradient weight value of optical image is used for image fusion. On the other hand, 90% of the gradient weight value of SAR image is used for image fusion. The value

5 .

2 = 0

k means that the fusion weight values of the optical and SAR images are determined only by the gradient of each image.

(a) (b)

Figure 3. Original images (a) Ikonos (b) TerraSAR-X.

(a) (b)

Figure 4. Denoised images (a) Ikonos (b) TerraSAR-X.

Table 1. Quantitative evaluation of the fused image.

Table 2. Quantitative evaluation of the fused image without gradient-based weighting.

(a)

(b)

(c)

(d)

(e)

Figure 5. The fused images ( k 1 = 1 . 5 ). Right column images represent the area displayed in the white square in

k 2 H ID SF SI

0.1 5.164 25.454 31.830 0.216 0.3 5.193 24.828 30.792 0.193 0.5 5.212 24.018 29.780 0.175 0.7 5.211 22.863 28.591 0.157 0.9 5.155 20.692 26.870 0.131 H ID SF SI No

Grad. 5.109 24.076 30.649 0.198

(4)

Figure 3 (a) k 2 = 0 . 1 (b) k 2 = 0 . 3 (c) k 2 = 0 . 5 (d) 7

.

2 = 0

k (e) k 2 = 0 . 9 .

Four evaluation methods are used to evaluate the performance of the fusion algorithm (Jing et al., 2003;

Kutay et al., 1993).

1) Entropy (H)

image fused the of histogram normalized

is ) ( where

), ( log ) (

255

0

i p

i p i p H

i

=

=

2) Image definition (ID)

. ) ) , ( ( ) ) , ( ( 1

1 1

2

∑∑ 2

= = ∂

+ ∂

= ⋅ N

i N

j j

j i I i

j i I N

ID N

3) Spatial frequency (SF)

2 .

2 CF

RF

SF = +

∑∑

∑∑

=

=

=

=

− +

= −

− +

= −

1 1

1 1

2 1

1 1 1

2

)) , ( ) , 1 ( ) (

1 ( ) 1 (

1

)) , ( ) 1 , ( ) (

1 ( ) 1 (

1

N i

N j N

i N

j

j i I j i N I

CF N

j i I j i N I

RF N

.

4) Speckle Index (SI)

∑∑

=

− =

= − 1

2 1 2 ( , )

) , ( )

2 ( ) 2 (

1 N

i N

j I

I

j i m

j i N

SI N σ ,

image.

fused in the window 3 3 of mean : ) , (

image.

fused in the window 3 3 of deviation std.

: ) , (

×

× j

i m

j i

I

σ I

The quantitative evaluation of the image fusion results is shown in Table 1. The entropy, which measures the overall information in the fused image, is maximum near

5 .

2 = 0

k . As the amount of optical image injected to the fused image increases, the values ID, SF and SI are decreased. Table 2 shows the quantitative evaluation of the fused image created without the gradient-based weighting. In this case, a small amount of SAR signal is injected into the fused image. The entropy of the fused image in Table 2 is smaller than that of any other fused image in Table 1.

5. CONCLUSIONS

We proposed a wavelet-based image fusion method, in which the gradient of denoised image is used as the activity measurement. This fusion method combines relatively strong or weak SAR signal with optical image and increases the entropy of the fused image than conventional fusion method. In the proposed image

fusion, the amount of each image injected into fused image is also able to be adjusted according to application purposes.

REFERENCES

Fatone, L., P. Maponi, et al., 2001. Fusion of SAR/optical images to detect urban areas. Remote Sensing and Data Fusion over Urban Areas, IEEE/ISPRS Joint Workshop 2001 2001: 217-221.

Garzelli, A., 2002. Wavelet-Based Fusion of Optical and SAR Image Data over Urban Area. International Archives of Photogrammetry, Remote Sensing and Spatial Information Sciences 34(3): 59-62.

Jun-chul, K., L. Young-ran, et al., 2005. The fusion of SAR images and optical images based on the use of wavelet transform: to improve classification accuracy, SAR Image Analysis, Modeling, and Techniques VII, Proc.

of SPIE vol. 5980:59800K.

Kutay, M.A., Karaman, M., and Bozdagi, G., 1993.

Enhancement of images corrupted with signal dependent noise: application to ultrasonic imaging, SPIE Visual Communication and Image Processing, 2094, pp.316-323.

Li, Z., Z. Jing, et al., 2003. A region-based image fusion algorithm using multiresolution segmentation. Intelligent Transportation Systems, 2003. Proceedings. 2003 IEEE 2003: 96-101.

Long, Z. and W. Guangfang, 2007. Study on adaptation of SAR/CCD image fusion algorithm, International Symposium on Photoelectronic Detection and Imaging 2007: Image Processing, Proc. of SPIE vol. 6623: 66230.

Rafael C. Gonzalez and Richard E. Woods., 2008. Digital Image Processing. Prentice Hall, New Jersey, pp. 501- 502.

.

수치

Figure 1. The decomposition of the 2-d DWT.
Figure 2. Block diagram of the proposed image fusion  scheme.
Table 2. Quantitative evaluation of the fused image  without gradient-based weighting

참조

관련 문서