http://www.medicinalcrop.org http://dx.doi.org/10.7783/KJMCS.2013.21.3.220
SSR 마커를 이용한 남아시아와 동남아시아 아마란스 자원의 유전적 다양성 비교
왕소강*·박용진*,*†
*공주대학교 산업과학대학 식물자원학과, **공주대학교 두과녹비자원연구센터
Comparison of Genetic Diversity among Amaranth Accessions from South and Southeast Asia using SSR Markers
Xiao Qiang Wang* and Yong Jin Park*,**†
*Department of Plant Resources, College of Industrial Sciences, Kongju National University, Yesan 340-702, Korea.
**Legume Bio-Resource Center of Green Manure (LBRCGM), Kongju National University, Yesan 340-702, Korea.
ABSTRACT : This study was conducted to assess the genetic diversity and population structure of 70 amaranth accessions collected from South and Southeast Asia using 14 simple sequence repeat (SSR) markers. In total, 67 alleles were detected, with an average of 4.79 per locus. Rare alleles comprised a large portion (46.3%) of the detected alleles, and 29 unique alleles associated with rice accessions were also discovered. The mean major allele frequency (MAF), genetic diversity (GD) and polymorphic information content (PIC) of the 14 SSR loci were 0.77, 0.36, and 0.34, respectively. A model-based structural analysis revealed the presence of three subpopulations. The genetic relationships revealed by the neighbor-joining tree method were fairly consistent with the structure-based membership assignments for most of the accessions. All 70 accessions showed a clear relationship to each cluster without any admixtures. We observed a relatively low extent of genetic exchange within or among amaranth species from South and Southeast Asia. The genetic diversity results could be used to identify amaranth germplasms and so facilitate their use for crop improvement.
Key Words : Amaranth, Genetic Diversity, Population Structure, SSRs
INTRODUCTION
Amaranthus, planted mainly for its grain and leaves, is cultivated in many tropical and temperate regions worldwide (Tucker, 1986). The genus Amaranthus includes more than 60 species, but not all are found in daily menus. Amaranth species such as Amaranthus blitus, Amaranthus cruentus, Amaranthus hypochondriacus are often planted for leaves, whereas Amaranthus caudatus, Amaranthus hypochodriacus, Amaranthus cruentus, Amaranthus hybridus are planted for their grain (Caselato-Sousa and Amaya-Farfn, 2012).
Amaranth was consumed as a staple food during ancient times. Ancient amaranth grains still in use today include Amaranthus caudatus, Amaranthus cruentus, and Amaranthus
hypochondriacus; their cultivation is expanding in Central and South America, Africa, and some parts of Asia. In recent years, amaranth has gained attention as a food and fodder crop due to its high seed protein content, balanced amino acid composition, and high lysine content (Caselato- Sousa and Amaya-Farfn, 2012; Zheleznov et al., 1997).
Amaranth leaves are a rich yet inexpensive source of dietary fiber, protein, vitamins and a wide range of minerals.
Vegetable amaranth is an indispensable source of nutrition, especially protein for vegetarian people in developing countries. Vegetable and grain Amaranthus species are tolerant to infestation by herbivorous insects under field conditions, and Amaranthus can grow successfully under varied soil and agro-climatic conditions (Angel and Paulina,
†Corresponding author: (Phone) +82-41-330-1201 (E-mail) [email protected]
Received 2013 April 15 / 1st Revised 2013 May 14 / 2nd Revised 2013 June 7 / Accepted 2013 June 7
This is an open access article distributed under the terms of the Creative Commons Attribution Non-Commercial License (http://creativecom- mons.org/licenses/by-nc/3.0/) which permits unrestricted non-commercial use, distribution, and reproduction in any medium, provided the original work is properly cited.
2011; Brenner et al., 2010; Prakash and Pal, 1991).
Currently, grain amaranths are cultivated in many parts of the world, including Central and South America, Africa, India and China. Amaranth grain can be cooked, popped, toasted, extruded or milled for consumption. In India, food containing amaranth grain can be a succedaneum to wheat and it is easy to incorporate into traditional cuisine (Dixit et al., 2011; Pandey and Singh, 2010).
The medicinal importance of this crop has been known for a long time. Amaranth is a rich dietary source of β- sitosterol and other phytosterols. It has been clearly shown that consumption of phytosterols, plant sterols, significantly reduce plasma cholesterol levels without causing noticeable side effects (Marcone et al., 2003). Amaranth oil is applicable as an effective natural antioxidant supplement, which could be of significant benefit for patients with cardiovascular disease, due to the high content of unsaturated fatty acids and unique presence of squalene (Martirosyan et al., 2007). Tea with the leaves of amaranth for prophylactic and therapeutic purposes was developed in Russia (Kononkov et al., 2007). Amaranth was applied as means of cleaning the stomach, a diuretic, to cure intestinal colic, cough, headaches and tumors (Ofitserov, 2001). These curative effects are often attributed to different antioxidant components. Antioxidant activities of the amaranth seed extract positively correlated with the presence of total polyphenols (Gorinstein et al., 2007).
Flavonoids as one of the natural antioxidants are considered to be effective substances for the prevention of diseases of the higher age. Flavonoids in amaranth, such as rutin and quercetin, are important antioxidants that significantly inhibit the oxidation of high density lipoprotein (HDL) cholesterol. This crop, therefore, is one of the new world super grains and is gaining favor among health-conscious consumers in many countries.
Information on the genetic diversity and relationships within and among crop species is essential for the efficient utilization of plant genetic resource collections (Brown, 1989). Various species of the genus Amaranthus L. can be used as donors of economically valuable genes in the selection of amaranth. These species of amaranth are also of great interest for the development of grain cultivars (Limanskii, 2012). The involvement of various genotypes in genetic selection programs of Amaranthus requires a detailed investigation of this crop. Genebanks,
which served as the major means of genetic resource conservation, encounter problems such as superfluous conservation of crop varieties and the increasing cost of maintenance. Nowadays, core sets represent a more efficient approach to preserving genetic diversity and minimizing sample collection (Brown, 1989; Frankel, 1984;
Kim et al., 2007). A core set of Amaranthus has been developed from a total of 634 accessions and its relatives conserved using a heuristic approach (Khaing et al., 2013).
DNA molecular markers based on PCR have proved to be a useful and informative tool for estimating the genetic diversity and genetic relationships in crop germplasm (Gwag et al., 2010; Li and Park, 2012; Zhao et al., 2010; Zhao et al., 2011). Several molecular approaches have been employed to assess genetic diversity in Amaranthus. Chan and Sun (1997) analyzed the genetic diversity and relationships of 23 cultivated and wild Amaranthus species using random amplified polymorphic DNA (RAPD) markers. Amplified fragment length polymorphism (AFLP) DNA markers have been used to determine the genetic relationship among weedy Amaranthus species (Wassom and Tranel, 2005). SSR markers have been shown to be a particularly powerful tool for this kind of research because of their abundance in eukaryotic genomes, co-dominance, and high frequency of polymorphisms (Gwag et al., 2010; Moe et al., 2010;
Zhao et al., 2012). SSR has also been applied to evaluation of the genetic diversity and population structure in Amaranthus (Khaing et al., 2013). The purpose of the current study was to determine the population genetic structure of Amaranthus accessions from South and Southeast Asia.
MATERIALS AND METHODS
1. Plant materials
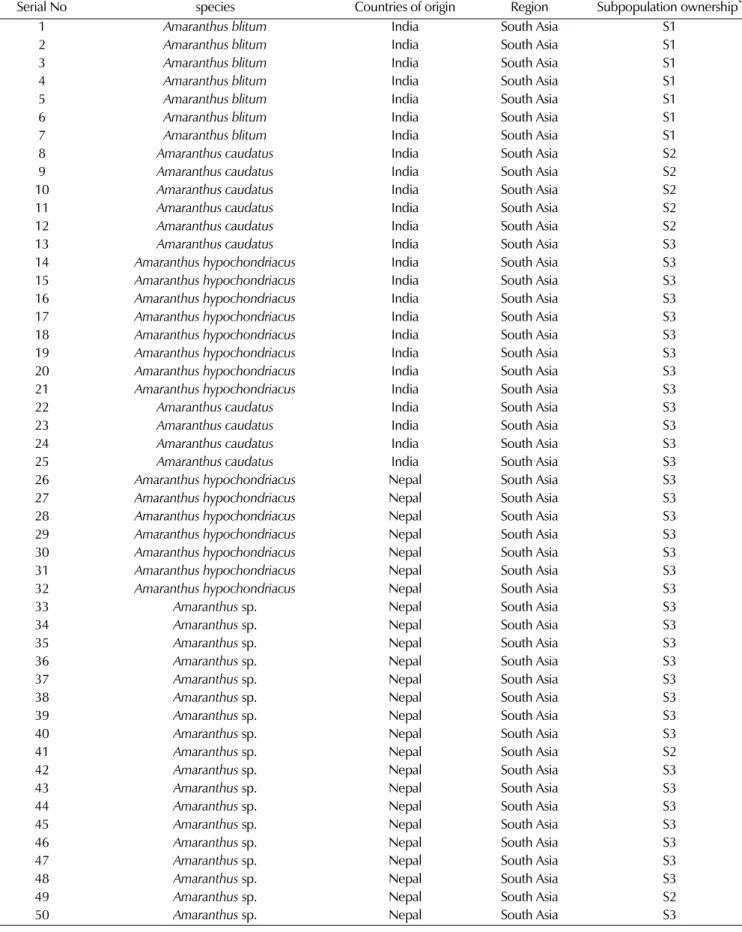
In this study, 70 amaranth accessions from South and Southeast Asia were selected. Of them, 25 accessions were from India, 32 from Nepal, and 13 from Thailand (Table 1). All plant materials collected were obtained from the National Genebank of the Rural Development Administration, Republic of Korea (RDA-Genebank). Total DNA was extracted from all accessions using a Qiagen DNA extraction kit (Qiagen, Seoul, Korea).
Table 1. List of the 70 amaranth accessions used in this study and their model-based groupings.
Serial No species Countries of origin Region Subpopulation ownership*
1 Amaranthus blitum India South Asia S1
2 Amaranthus blitum India South Asia S1
3 Amaranthus blitum India South Asia S1
4 Amaranthus blitum India South Asia S1
5 Amaranthus blitum India South Asia S1
6 Amaranthus blitum India South Asia S1
7 Amaranthus blitum India South Asia S1
8 Amaranthus caudatus India South Asia S2
9 Amaranthus caudatus India South Asia S2
10 Amaranthus caudatus India South Asia S2
11 Amaranthus caudatus India South Asia S2
12 Amaranthus caudatus India South Asia S2
13 Amaranthus caudatus India South Asia S3
14 Amaranthus hypochondriacus India South Asia S3
15 Amaranthus hypochondriacus India South Asia S3
16 Amaranthus hypochondriacus India South Asia S3
17 Amaranthus hypochondriacus India South Asia S3
18 Amaranthus hypochondriacus India South Asia S3
19 Amaranthus hypochondriacus India South Asia S3
20 Amaranthus hypochondriacus India South Asia S3
21 Amaranthus hypochondriacus India South Asia S3
22 Amaranthus caudatus India South Asia S3
23 Amaranthus caudatus India South Asia S3
24 Amaranthus caudatus India South Asia S3
25 Amaranthus caudatus India South Asia S3
26 Amaranthus hypochondriacus Nepal South Asia S3
27 Amaranthus hypochondriacus Nepal South Asia S3
28 Amaranthus hypochondriacus Nepal South Asia S3
29 Amaranthus hypochondriacus Nepal South Asia S3
30 Amaranthus hypochondriacus Nepal South Asia S3
31 Amaranthus hypochondriacus Nepal South Asia S3
32 Amaranthus hypochondriacus Nepal South Asia S3
33 Amaranthus sp. Nepal South Asia S3
34 Amaranthus sp. Nepal South Asia S3
35 Amaranthus sp. Nepal South Asia S3
36 Amaranthus sp. Nepal South Asia S3
37 Amaranthus sp. Nepal South Asia S3
38 Amaranthus sp. Nepal South Asia S3
39 Amaranthus sp. Nepal South Asia S3
40 Amaranthus sp. Nepal South Asia S3
41 Amaranthus sp. Nepal South Asia S2
42 Amaranthus sp. Nepal South Asia S3
43 Amaranthus sp. Nepal South Asia S3
44 Amaranthus sp. Nepal South Asia S3
45 Amaranthus sp. Nepal South Asia S3
46 Amaranthus sp. Nepal South Asia S3
47 Amaranthus sp. Nepal South Asia S3
48 Amaranthus sp. Nepal South Asia S3
49 Amaranthus sp. Nepal South Asia S2
50 Amaranthus sp. Nepal South Asia S3
2. SSR genotyping
Fourteen polymorphic SSR markers developed by Lee et al.
(2008) were used in this study. A three-primer system (Schuelke, 2000) was used. This included a universal M13 oligonucleotide (TGTAAAACGACGGCCAGT) labeled with one of three fluorescent dyes (6-FAM, NED, or HEX), which allowed the products to be triplexed during electrophoresis; a special forward primer composed of a concatenation of the M13 oligonucleotide, and the normal reverse primer for SSR PCR amplification. The SSR alleles were resolved on an ABI Prism 3100 DNA sequencer (Applied Biosystems, Foster City, CA, USA) using the GeneScan 3.7 software, and sized precisely using GeneScan 500 ROX (6-carbon-X-rhodamine) molecular size standards (35 - 500 bp) with the Genotyper 3.7 software (Applied Biosystems).
3. Data analysis
The major allele frequency (MAF), number of alleles, genetic diversity (GD), and polymorphic information
content (PIC) value were determined using the genetic analysis package PowerMarker ver. 3.25 (Liu and Muse, 2005). The PIC value can be used to evaluate diversity effectively using the formula;
where pil represents the allele frequency of the ith allele at locus l. The genetic distance among accessions was calculated as Nei’s distance (Nei et al., 1983) using the neighbor-joining method, and an unrooted phylogram was constructed using the MEGA4 software as implemented in PowerMarker (Tamura et al., 2007). Genetic distances between groups of varieties, as per Nei and Li (1979), were calculated using the equation;
where NX and NY represent the number of alleles in groups X and Y, respectively, and NXY is the number of alleles shared between the two groups. The model-based
PICl 1 pil2
i 1= n
∑
–
=
GDXY 1 2NXY NX+NY
[ ]
---
⎝ ⎠
⎛ ⎞
–
= Table 1. List of the 70 amaranth accessions used in this study and their model-based groupings. (Continued)
Serial No species Countries of origin Region Subpopulation ownership*
51 Amaranthus sp. Nepal South Asia S3
52 Amaranthus sp. Nepal South Asia S3
53 Amaranthus sp. Nepal South Asia S2
54 Amaranthus sp. Nepal South Asia S2
55 Amaranthus sp. Nepal South Asia S3
51 Amaranthus sp. Nepal South Asia S3
52 Amaranthus sp. Nepal South Asia S3
56 Amaranthus sp. Nepal South Asia S3
57 Amaranthus sp. Nepal South Asia S3
58 Amaranthus sp. Thailand Southeast Asia S3
59 Amaranthus sp. Thailand Southeast Asia S2
60 Amaranthus sp. Thailand Southeast Asia S3
61 Amaranthus sp. Thailand Southeast Asia S3
62 Amaranthus sp. Thailand Southeast Asia S3
63 Amaranthus sp. Thailand Southeast Asia S3
64 Amaranthus sp. Thailand Southeast Asia S2
65 Amaranthus sp. Thailand Southeast Asia S3
66 Amaranthus sp. Thailand Southeast Asia S3
67 Amaranthus sp. Thailand Southeast Asia S3
68 Amaranthus sp. Thailand Southeast Asia S3
69 Amaranthus sp. Thailand Southeast Asia S3
70 Amaranthus sp. Thailand Southeast Asia S3
*As defined by the STRUCTURE software.
software STRUCTURE 2.2 (Schuelke, 2000) was used to identify the population structure of the accessions using a Bayesian clustering approach. Four independent replicates were performed per run, with K ranging from 2 to 8 with a burn-in of 10,000 and run length of 50,000. The most probable number (K) was calculated based on the method of Flint-Garcia et al. (2003) using a model allowing for admixtures and correlated allele frequencies.
An inferred ancestry of ≥ 75% was used to assign rice accessions of the same subgroup, while < 75% was assigned to an admixture group.
RESULTS
1. Overall SSR diversity
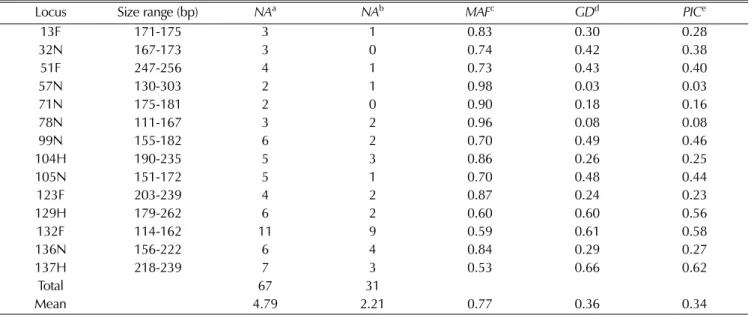
A total of 14 SSR markers were used to assess the genetic diversity and population structure among 70 amaranth accessions (Table 2). All markers were polymorphic across the 70 amaranth accessions, and 67 alleles were identified.
Of the 67 alleles, 23 (34.3%) were common (frequency 0.05 - 0.5); 31 (46.3%) were rare (frequency < 0.05); and 13 (19.4%) were abundant (frequency > 0.5). These results reveal a large proportion of rare alleles among the accessions studied (Fig. 1). The number of alleles detected per locus ranged from 2 to 11, with an average of 4.79 per locus, whereas the number of rare alleles identified
among these loci varied from 0 to 19, with a mean of 2.21 per locus. Sixteen rare alleles were found exclusively in single accessions. The major allele frequency (MAF) ranged from 0.53 to 0.98 with a mean of 0.77. The genetic diversity (GD) and polymorphism information content (PIC) varied from 0.03 to 0.66 and 0.03 to 0.62, with an average of 0.66 and 0.62, respectively (Table 2).
2. Geographical analysis of diversity
As shown in Table 3, among the accessions used in this study, the average number of alleles followed the order Nepal > India > Thailand. A countrywide comparative study of genetic diversity showed that accessions from India possessed the highest genetic diversity (GD = 0.56, PIC = 0.52), followed by Nepal (GD = 0.2, PIC = 0.18) and Thailand (GD = 0.18, PIC = 0.14). It is worth mentioning
Table 2. Overall diversity statistics for 14 SSR loci in 70 amaranth accessions.
Locus Size range (bp) NAa NAb MAFc GDd PICe
13F 171-175 3 1 0.83 0.30 0.28
32N 167-173 3 0 0.74 0.42 0.38
51F 247-256 4 1 0.73 0.43 0.40
57N 130-303 2 1 0.98 0.03 0.03
71N 175-181 2 0 0.90 0.18 0.16
78N 111-167 3 2 0.96 0.08 0.08
99N 155-182 6 2 0.70 0.49 0.46
104H 190-235 5 3 0.86 0.26 0.25
105N 151-172 5 1 0.70 0.48 0.44
123F 203-239 4 2 0.87 0.24 0.23
129H 179-262 6 2 0.60 0.60 0.56
132F 114-162 11 9 0.59 0.61 0.58
136N 156-222 6 4 0.84 0.29 0.27
137H 218-239 7 3 0.53 0.66 0.62
Total 67 31
Mean 4.79 2.21 0.77 0.36 0.34
A; Number of alleles, b; Number of rare alleles, c; Major allele frequency, d; Gene diversity, e; Polymorphism information content.
Fig. 1. Histograms of the frequencies of the 67 alleles in 70 accessions of amaranth and its relatives.
that accessions from India possessed relatively high PIC values and a large number of alleles with a comparative small number of accessions.
3. Distance-based phylogeny
A genetic distance-based analysis was performed by calculating the shared allele frequencies among the 70 accessions. An unrooted phylogram was computed using MEGA 4 (Tamura et al., 2007) embedded in the
PowerMarker program (Liu and Muse, 2005). The UPGMA tree clustered all of the accessions into three groups. As shown in Fig. 2, 70 amaranth accessions were distributed among the three groups. The first group included seven accessions from India. The second group consisted of 11 accessions, five of them from India, four from Nepal, and two from Thailand. The third group is the main group, which included about 75% of the accessions used in this study; the numbers of accessions from India, Nepal and Thailand distributed in this group were 13, 28 and 11, respectively.
4. Population structure
Population structure analysis was carried out using the STRUCTURE 2.2 software (Pritchard et al., 2000), which implements a Bayesian approach to identify subpopulations with distinct allele frequencies and places individuals into K clusters. The distribution of L (K) revealed a continuously increasing curve without a clear maximum for the true K, although K did show a clear peak at the true value of K = 3 (Fig. 3), indicating that the accessions could be grouped into three main subpopulations (Evanno et al., 2005).
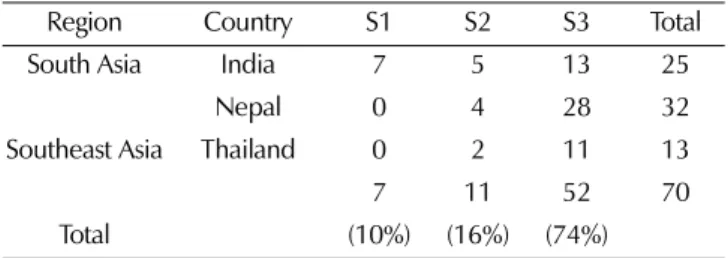
All 70 accessions shared > 75% membership with one of the genetic populations and were classified as members of that population without admixture (Table 4, Fig. 4). As Table 3. Number of amaranth accessions, number of alleles, major allele frequency, genetic diversity, and polymorphic information
content according to region/country.
Region Country NAa NAb MAFc GDd PICe
South Asia India 25 4.21 0.57 0.56 0.52
Nepal 32 2.50 0.88 0.20 0.18
Southeast Asia Thailand 13 1.64 0.90 0.16 0.14
A; Number of amaranth accessions, b; Number of alleles, c; Major allele frequency, d; Gene diversity, e; Polymorphism information content.
Fig. 2. An unrooted neighbor-joining tree showing the genetic relationships among the 70 amaranth accessions based on 14 microsatellite markers. The color corresponds to that of model-based populations.
Fig. 3. Magnitude of ΔK as a function of K. In this case, the maximum value of ΔK of the 70 amaranth accessions was identified at K = 3.
Table 4. Distribution of accessions from different countries to each population identified by the inferred value from the STRUCTURE software.
Region Country S1 S2 S3 Total
South Asia India 7 5 13 25
Nepal 0 4 28 32
Southeast Asia Thailand 0 2 11 13
7 11 52 70
Total (10%) (16%) (74%)
shown in Figure 4, the distribution of 70 amaranth accessions classified by STRUCTURE was inconsistent with that of UPGMA tree. Accessions from India were distributed in all three subgroups, whereas accessions from Nepal and Thailand were found only in groups two and three, respectively.
DISCUSSION
Genetic diversity is critical in crop breeding. Strong genetic diversity provides diverse morphological traits and potentially valuable genetic information, and therefore lays a good foundation for breeding (Upadhyay et al., 2012).
Microsatellites have become one of the most widely used molecular markers for genetic diversity studies, linkage map construction, and marker-assisted selection (MAS) (Chung et al., 2009; Zhao et al., 2011).
The objective of this study was to assess the genetic diversity in selected amaranth accessions using SSR markers. Abundant allelic variation was discovered, with an average of 4.79 per locus. A considerable number of rare alleles were identified, which comprised a large proportion of the total, indicating that rare alleles make a major contribution to the overall genetic diversity of the germplasm (Roussel et al., 2004; Yifru et al., 2006).
More to the point, sixteen unique alleles were exclusive to single accessions, which may be associated with special traits and could be useful in further gene identification and MAS breeding.
Genetic advancement can be achieved by artificial selection based on valuable agronomic traits controlled by genetic inheritance. A number of studies have focused on genetic divergence and its association with
agronomic traits. Wu et al. (2000) identified amaranth genotypes that carry valuable agronomic traits, such as grain yield and disease tolerance, and non-cultivated species were reported to be more tolerant to disease.
Pandey and Singh (2010) found genotypes significantly associated with leaf protein content in grain amaranth.
Due to extensive distribution and multiple sub-species, favorable agronomic traits could vary among regions because of human activities related to selection and resource exchange, which may result in genetic divergence among areas (Kumar et al., 2010).
The neighbor-joining tree of 70 amaranth accessions based on Nei’s (1983) genetic distance revealed that the rice materials used could be divided into three distinct groups, with the major group consisting of more than 70% of the accessions. Some accessions of the same species scattered to different groups such as Amaranthus caudatus and Amaranthus sp., despite coming from the same country. Accessions from India showed more genetic diversity than those from Nepal and Thailand; this may be due in part to the divergence origin of the region in which they were collected. Worldwide collections will be critical for the enrichment of the genetic diversity of amaranth germplasm. Although a correlation between origin and subpopulations was not found in this study, one of the species, Amaranthus blitum from India, clustered in a singular subpopulation.
Understanding the population structure is vital to confirm the correlation between phenotype and genotype, and is a precondition for appropriate selection of accessions. The results of our structure analysis and neighbor-joining tree were in good agreement. Accessions distributed in the same subpopulations by STRUCTURE 2.2 were clustered Fig. 4. Model-based clustering for each of the 70 amaranth accessions examined based on 14 SSR markers used to build the Q
matrix. Each individual bar represents an accession. The color bars refer to three genetic groups (S1-S3, respectively).
together in the dendrogram (Fig. 4). High levels of inter- accessional genetic diversity were found within species, but genetic uniformity was observed within most accessions.
All of the accessions were clustered into three groups without admixture, indicating relatively rare genetic communication among those amaranth species. Only Amaranthus caudatus and Amaranthus sp. were distributed in more than one subgroup, which suggests that these two species have comparatively high genetic divergence than other species in this study. Slight genetic exchange was identified between species Amaranthus hypochondriacus and Amaranthus blitum, and Amaranthus hypochondriacus and Amaranthus caudatus among few accessions from India and Nepal.
In conclusion, SSR markers are an effective tool for identifying the genetic variability in amaranth collections.
We found a relatively low degree of genetic exchange within or among amaranth species from South and Southeast Asia.
ACKNOWLEDGEMENTS
This work was supported by a grant from the BioGreen 21 Program(No. PJ009099), Rural Development Administration, Republic of Korea.
LITERATURE CITED
Angel HO and Paulina BR. (2011). Amaranth: A pseudo-cereal with nutraceutical properties. Current Nutrition & Food Science.
7:1-9.
Brenner DM, Baltensperger DD, Kulakow PA, Lehmann JW, Myers RL, Slabbert MM and Sleugh BB. (2010). Genetic resources and breeding of Amaranthus. In Plant breeding reviews.
John Wiley & Sons Inc. New York, USA. p.227-285.
Brown AHD. (1989). Core collections: A practical approach to genetic resources management. Genome. 31:818-824.
Caselato-Sousa VM and Amaya-Farfn J. (2012). State of knowledge on amaranth grain: A comprehensive Review. Journal of Food Science. 77:R93-R104.
Chan KF and Sun M. (1997). Genetic diversity and relationships detected by isozyme and RAPD analysis of crop and wild species of Amaranthus. Theoretical and Applied Genetics. 95:
865-873.
Chung HK, Kim KW, Chung JW, Lee JR, Lee SY, Dixit A, Kang HK, Zhao WG, McNally KL, Hamilton RS, Gwag JG and Park YJ. (2009). Development of a core set from a large rice collection using a modified heuristic algorithm to retain maximum diversity. Journal of Integrative Plant Biology.
51:1116-1125.
Dixit AA, Azar KMJ, Gardner CD and Palaniappan LP.
(2011). Incorporation of whole, ancient grains into a modern Asian Indian diet to reduce the burden of chronic disease.
Nutrition Reviews. 69:479-488.
Evanno G, Regnaut S and Goudet J. (2005). Detecting the number of clusters of individuals using the software structure:
A simulation study. Molecular Ecology. 14:2611-2620.
Flint-Garcia SA, Thornsberry JM and Buckler ES. (2003).
Structure of linkage disequilibrium in plants. Annual Review of Plant Biology. 54:357-374.
Frankel O. (1984). Genetic perspectives of germplasm conservation.
Genetic manipulation: Impact on man and society. Cambridge University Press. Cambridge, England. p.161-170.
Gorinstein S, Vargas OM, Jaramillo N, Salas I, Ayala A, Arancibia-Avila P, Toledo F, Katrich E and Trakhtenberg S.
(2007). The total polyphenols and the antioxidant potentials of some selected cereals and pseudocereals. European Food Research and Technology. 225:321-328.
Gwag JG, Dixit A, Park YJ, Ma KH, Kwon SJ, Cho GT, Lee GA, Lee SY, Kang HK and Lee SH. (2010). Assessment of genetic diversity and population structure in mungbean. Genes
& Genomics. 32:99-308.
Khaing AA, Moe KT, Chung JW, Baek HJ and Park YJ.
(2013). Genetic diversity and population structure of the selected core set in Amaranthus using SSR markers. Plant Breeding. 132:165-173.
Kim KW, Chung HK, Cho GT, Ma KH, Chandrabalan D, Gwag JG, Kim TS, Cho EG and Park YJ. (2007).
PowerCore: A program applying the advanced M strategy with a heuristic search for establishing core sets. Bioinformatics.
23:2155-2162.
Kononkov PF, Gins M, Rakhimov VM, Gins VK and Logvinchuk TM. (2004). Amaranth leaves: A valuable material for production of food additives and enriched tea products.
Potatoes Vegetables. 1:29-30.
Kumar S, Bisht IS and Bhat KV. (2010). Population structure of rice(Oryza sativa) landraces under farmer management. Annals of Applied Biology. 156:137-146.
Li G and Park YJ. (2012). SCAR markers for discriminating species of two genera of medicinal plants, Liriope and Ophiopogon. Genetics and Molecular Research. 11:2987-2996.
Limanskii SV. (2012). Estimation of the genetic variability of amaranth collection Amaranthus L. with RAPD-analysis. TSitologiia i genetika. 46:19-26.
Liu K and Muse SV. (2005). Power Marker: An integrated analysis environment for genetic marker analysis. Bioinformatics.
21:2128-2129.
Marcone M, Kakuda Y and Yada R. (2003). Amaranth as a rich dietary source of β-sitosterol and other phytosterols. Plant Foods for Human Nutrition. 58:207-211.
Martirosyan D, Miroshnichenko L, Kulakova S, Pogojeva A and Zoloedov V. (2007). Amaranth oil application for coronary heart disease and hypertension. Lipids in Health and Disease.
6:1-12.
Moe KT, Zhao WG, Song HS, Kim YH, Chung JW, Cho YI, Park PH, Park HS, Chae SC and Park YJ. (2010).
Development of SSR markers to study diversity in the genus
Cymbidium. Biochemical Systematics and Ecology. 38:585-594.
Nei M, Tajima F and Tateno Y. (1983). Accuracy of estimated phylogenetic trees from molecular data. Journal of Molecular Evolution. 19:153-170.
Ofitserov EN. (2001). Amaranth: Perspective raw material for food processing and pharmaceutical industry. Chemistry and Computational Simulation. Butlerov Communications. 2:1-4.
Pandey R and Singh R. (2010). Genetic studies for biochemical and quantitative characters in grain amaranth(Amaranthus hypochondriacus L.). Plant Omics. 3: 129-134.
Prakash D and Pal M. (1991). Nutritional and antinutritional composition of vegetable and grain amaranth leaves. Journal of the Science of Food and Agriculture. 57:573-583.
Pritchard JK, Stephens M and Donnelly P. (2000). Inference of population structure using multilocus genotype data. Genetics.
155:945-959.
Roussel V, Koenig J, Beckert M and Balfourier F. (2004).
Molecular diversity in French bread wheat accessions related to temporal trends and breeding programmes. Theoretical and Applied Genetics. 108:920-930.
Schuelke M. (2000). An economic method for the fluorescent labeling of PCR fragments. Nature Biotechnology. 18:233-234.
Tamura K, Dudley J, Nei M and Kumar, S. (2007). MEGA4:
Molecular evolutionary genetics analysis(MEGA) software version 4.0. Molecular Biology and Evolution. 24:1596-1599.
Tucker JB. (1986). Amaranth: The once and future crop.
Bioscience. 36:9-13.
Upadhyay P, Neeraja C, Kole C and Singh V. (2012).
Population structure and genetic diversity in popular rice
varieties of India as evidenced from SSR analysis. Biochemical Genetics. 50:476-483.
Wassom JJ and Tranel PJ. (2005). Amplified fragment length polymorphism-based genetic relationships among weedy Amaranthus species. Journal of Heredity. 96:410-416.
Wu H, Sun M, Yue S, Sun H, Cai Y, Huang R, Brenner D and Corke H. (2000). Field evaluation of an Amaranthus genetic resource collection in China. Genetic Resources and Crop Evolution. 47:43-53.
Yifru T, Hammer K, Huang XQ and Roder MS. (2006).
Regional patterns of microsatellite diversity in Ethiopian tetraploid wheat accessions. Plant Breeding. 125:125-130.
Zhao WG, Chung JW, Kwon SW, Lee JH, Ma KH and Park YJ. (2012). Association analysis of physicochemical traits on eating quality in rice(Oryza sativa L.). Euphytica:1-13.
Zhao WG, Chung JW, Cho YI, Rha WH, Lee GA, Ma KH, Han SH, Bang KH, Park CB, Kim SM and Park YJ.
(2010). Molecular genetic diversity and population structure in Lycium accessions using SSR markers. Comptes Rendus Biologies. 333:793-800.
Zhao WG, Chung JW, Lee GA, Ma KH, Kim HH, Kim KT, Chung IM, Lee JK, Kim NS, Kim SM and Park YJ.
(2011). Molecular genetic diversity and population structure of a selected core set in garlic and its relatives using novel SSR markers. Plant Breeding. 130:46-54.
Zheleznov AV, Solonenko LP and Zheleznova NB. (1997). Seed proteins of the wild and the cultivated Amaranthus species.
Euphytica. 97:177-182.