441
†
Corresponding author: (Phone) +82-41-330-1201
(E-mail) [email protected] <Received November 25, 2009>
Analysis of genetic diversity and population structure of rice cultivars from Africa, Asia, Europe, South America, and Oceania using SSR markers
Yi Cheng*, Young-Il Cho*, Jong-Wook Chung*, Kyung-Ho Ma**, and Yong-Jin Park*
†*Department of Plant Resources, College of Industrial Science, Kongju National University, Yesan 340-702, Republic of Korea
**National Agrobiodiversity Center, National Institute of Agricultural Biotechnology, RDA, Seodun-Dong, Suwon 441-100, Republic of Korea
ABSTRACT In this study, 29 simple sequence repeat (SSR) markers were used to analyze the genetic diversity and population structure of 125 rice accessions from 40 different origins in Africa, Asia, Europe, South America, and Oceania. A total of 333 alleles were detected, with an average of 11.5 per locus.
The mean values of major allele frequency, expected heterozygosity, and polymorphism information content (PIC) for each SSR locus were 0.39, 0.73, and 0.70, respectively. The highest mean PIC was 0.71 for Asia, followed by 0.66 for Africa, 0.59 for South America, 0.53 for Europe, and 0.47 for Oceania.
Model-based structure analysis revealed the presence of five subpopulations, which was basically consistent with clustering based on genetic distance. Some accessions were clearly assigned to a single population in which >70% of their inferred ancestry was derived from one of the model-based populations. In addition, 12 accessions (9.6%) were categorized as having admixed ancestry. The results could be used to understanding the genetic structure of rice cultivars from these regions and to support effective breeding programs to broaden the genetic basis of rice varieties.
Keywords : gene diversity, population structure, SSR, rice
As a staple cereal crop, rice (Oryza sativa L.) feeds more than 50% of the world’s population (Mather et al., 2007) and is the most important component of human diet in many regions of the world (Zhao et al., 2009a). African cultivated rice was domesticated in the Niger River Delta about 3,500 years ago (Viguier, 1939) and is widely grown in West Africa today. New high-yielding varieties suitable for cultivation in West Africa (NERICA varieties) have recently been developed
from interspecific crosses between Oryza glaberrima and O.
sativa (http://www.warda.org). Three centers of domestication for O. glaberrima-Mali, Sene-Gambia, and Guinea (Portères, 1970)-may have contributed to the broad ecological adaptation of African rice cultivars today. Estimates of genetic diversity in O. glaberrima based on RFLP and isozyme markers are significantly lower than those in Asian cultivated rice, O.
sativa (Second, 1982 & 1986; Wang et al., 1992). Asian
cultivated rice (O. sativa L.) holds a unique position among
domesticated crop species in that it is both a critical food
staple and the first fully sequenced crop genome. It was
domesticated from its wild ancestor about 11,500 years ago
(Normile, 1997), and two centers of domestication have been
identified: the japonica variety group and the indica variety
group (Crawford & Chen, 1998; Garris et al., 2005). Recent
evidence based on nuclear genome sequence comparisons
suggests an ancient indica/japonica divide dating between
200,000 and 440,000 years ago; evidence based on chloroplast
sequences suggests a divide dating between 86,000 and 200,000
years ago. Both of these estimates significantly predate the
domestication of rice (Ma & Bennetzen, 2004; Tang et al.,
2004; Vitte et al., 2004; Zhu & Ge, 2005). This deep population
structure is readily apparent in rice landraces and improved
varieties grown around the world. Representative samples of
the global rice gene pool have been extensively studied using
molecular markers, beginning with Glaszmann’s pioneering
study that used isozyme markers to identify six groups from
within 1,688 accessions of O. sativa (Glaszmann, 1987). In
Asian nations, people’s lives revolve around the production
of rice. Rice originated from Asia, making it more popular
as a food source among Asian nations. It then spread through
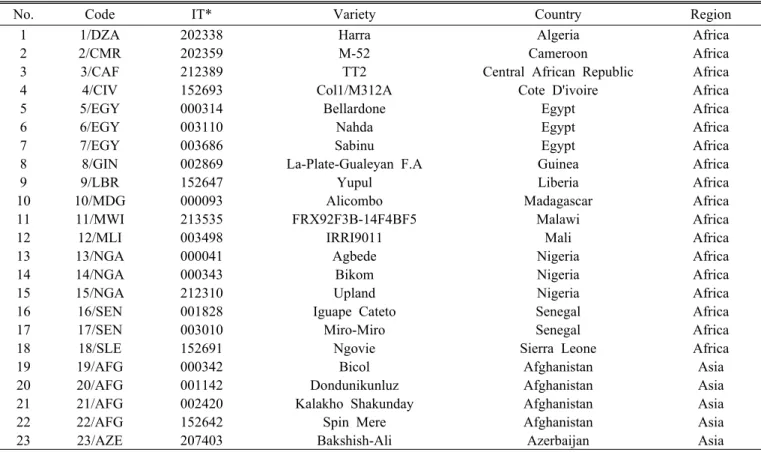
Table 1. The 125 rice accessions used in this study.
No. Code IT* Variety Country Region
1 1/DZA 202338 Harra Algeria Africa
2 2/CMR 202359 M-52 Cameroon Africa
3 3/CAF 212389 TT2 Central African Republic Africa
4 4/CIV 152693 Col1/M312A Cote D'ivoire Africa
5 5/EGY 000314 Bellardone Egypt Africa
6 6/EGY 003110 Nahda Egypt Africa
7 7/EGY 003686 Sabinu Egypt Africa
8 8/GIN 002869 La-Plate-Gualeyan F.A Guinea Africa
9 9/LBR 152647 Yupul Liberia Africa
10 10/MDG 000093 Alicombo Madagascar Africa
11 11/MWI 213535 FRX92F3B-14F4BF5 Malawi Africa
12 12/MLI 003498 IRRI9011 Mali Africa
13 13/NGA 000041 Agbede Nigeria Africa
14 14/NGA 000343 Bikom Nigeria Africa
15 15/NGA 212310 Upland Nigeria Africa
16 16/SEN 001828 Iguape Cateto Senegal Africa
17 17/SEN 003010 Miro-Miro Senegal Africa
18 18/SLE 152691 Ngovie Sierra Leone Africa
19 19/AFG 000342 Bicol Afghanistan Asia
20 20/AFG 001142 Dondunikunluz Afghanistan Asia
21 21/AFG 002420 Kalakho Shakunday Afghanistan Asia
22 22/AFG 152642 Spin Mere Afghanistan Asia
23 23/AZE 207403 Bakshish-Ali Azerbaijan Asia
Europe and later into the Americas. Even today, many aspects of European culture have their basis on the cultivation of rice. In the Middle East and Mediterranean Europe, rice growing started around 800 BC and spread throughout Italy and then France after the middle of the 15th century, later propagating to all continents during the great age of European exploration.
In 1694, rice arrived in South Carolina, probably originating from Madagascar. The Spanish brought rice to South America at the beginning of the 18th century.
Molecular markers, such as simple sequence repeats (SSRs) and simple sequence repeat polymorphisms (SSRPs) (Park et al., 2009) were valuable for developing markers in many kinds of plants, such as Lycium barbarum (Kwon et al., 2009), garlic (Allium sativum L.) (Ma et al., 2009), Perilla frutescens Britt (Park et al., 2008), Amaranthus hypochondriacus (Lee et al., 2008) and rice (Yang et al., 1994; McCouch et al., 1997; Ishii & McCouch, 2000; Ishii et al., 2001). SSRs provide much greater resolution than other markers in terms of interpreting population structure because of the high level of polymorphism at SSR loci (Cho et al., 2000; Akkaya et al., 1992). SSR markers for cultivated rice have been developed
(McCouch et al., 2001), and studies have demonstrated the applicability of SSR alleles for determining both intra- and interpopulation genetic structures (Kuroda et al., 2003).
Studies based on the genetic diversity of rice cultivars from Asian and African countries have demonstrated that the genetic diversity of O. glaberrima is significantly lower than that of O. sativa (Second, 1982 & 1986; Wang et al. 1992).
But analyses of the genetic diversity and population structure of rice cultivars from Africa, Asia, Europe, South America, and Oceania have not been reported. The objective of this study was to compare genetic diversity and analyze population structure among cultivars from the five continents.
MATERIALS AND METHODS
Plant materials
A total of 125 rice accessions were selected by their origins
including Africa, Asia, Europe, South America, and Oceania
(Table 1). All accessions were obtained from the National
Agrobiodiversity Center of Rural Development Administration
(http://genebank.rda.go.kr), Republic of Korea.
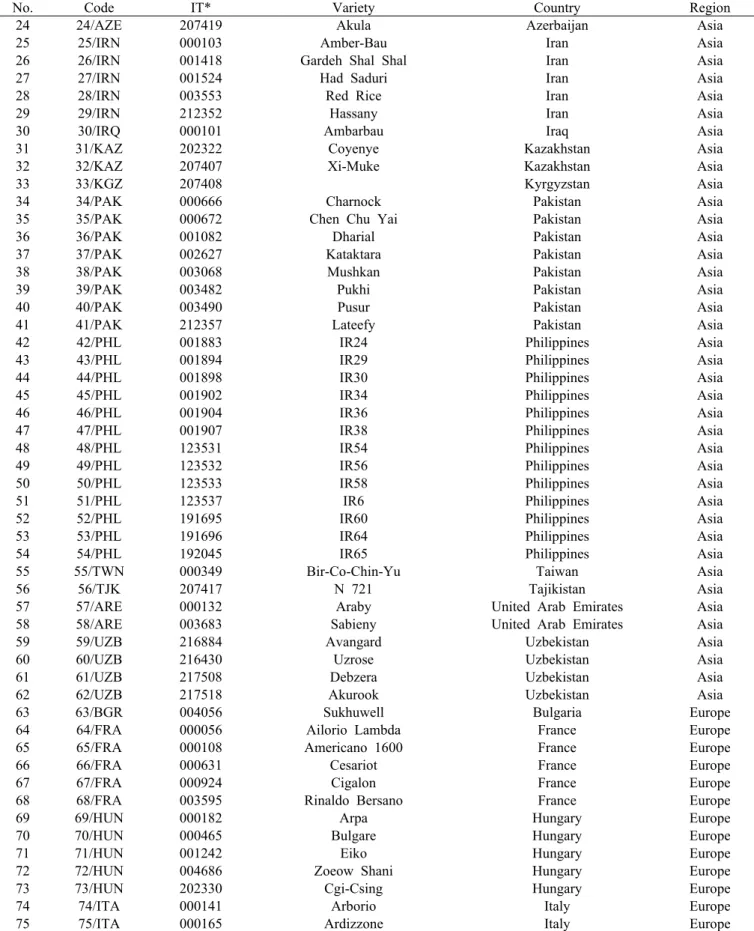
Table 1. The 125 rice accessions used in this study(Continued).
No. Code IT* Variety Country Region
24 24/AZE 207419 Akula Azerbaijan Asia
25 25/IRN 000103 Amber-Bau Iran Asia
26 26/IRN 001418 Gardeh Shal Shal Iran Asia
27 27/IRN 001524 Had Saduri Iran Asia
28 28/IRN 003553 Red Rice Iran Asia
29 29/IRN 212352 Hassany Iran Asia
30 30/IRQ 000101 Ambarbau Iraq Asia
31 31/KAZ 202322 Coyenye Kazakhstan Asia
32 32/KAZ 207407 Xi-Muke Kazakhstan Asia
33 33/KGZ 207408 Kyrgyzstan Asia
34 34/PAK 000666 Charnock Pakistan Asia
35 35/PAK 000672 Chen Chu Yai Pakistan Asia
36 36/PAK 001082 Dharial Pakistan Asia
37 37/PAK 002627 Kataktara Pakistan Asia
38 38/PAK 003068 Mushkan Pakistan Asia
39 39/PAK 003482 Pukhi Pakistan Asia
40 40/PAK 003490 Pusur Pakistan Asia
41 41/PAK 212357 Lateefy Pakistan Asia
42 42/PHL 001883 IR24 Philippines Asia
43 43/PHL 001894 IR29 Philippines Asia
44 44/PHL 001898 IR30 Philippines Asia
45 45/PHL 001902 IR34 Philippines Asia
46 46/PHL 001904 IR36 Philippines Asia
47 47/PHL 001907 IR38 Philippines Asia
48 48/PHL 123531 IR54 Philippines Asia
49 49/PHL 123532 IR56 Philippines Asia
50 50/PHL 123533 IR58 Philippines Asia
51 51/PHL 123537 IR6 Philippines Asia
52 52/PHL 191695 IR60 Philippines Asia
53 53/PHL 191696 IR64 Philippines Asia
54 54/PHL 192045 IR65 Philippines Asia
55 55/TWN 000349 Bir-Co-Chin-Yu Taiwan Asia
56 56/TJK 207417 N 721 Tajikistan Asia
57 57/ARE 000132 Araby United Arab Emirates Asia
58 58/ARE 003683 Sabieny United Arab Emirates Asia
59 59/UZB 216884 Avangard Uzbekistan Asia
60 60/UZB 216430 Uzrose Uzbekistan Asia
61 61/UZB 217508 Debzera Uzbekistan Asia
62 62/UZB 217518 Akurook Uzbekistan Asia
63 63/BGR 004056 Sukhuwell Bulgaria Europe
64 64/FRA 000056 Ailorio Lambda France Europe
65 65/FRA 000108 Americano 1600 France Europe
66 66/FRA 000631 Cesariot France Europe
67 67/FRA 000924 Cigalon France Europe
68 68/FRA 003595 Rinaldo Bersano France Europe
69 69/HUN 000182 Arpa Hungary Europe
70 70/HUN 000465 Bulgare Hungary Europe
71 71/HUN 001242 Eiko Hungary Europe
72 72/HUN 004686 Zoeow Shani Hungary Europe
73 73/HUN 202330 Cgi-Csing Hungary Europe
74 74/ITA 000141 Arborio Italy Europe
75 75/ITA 000165 Ardizzone Italy Europe
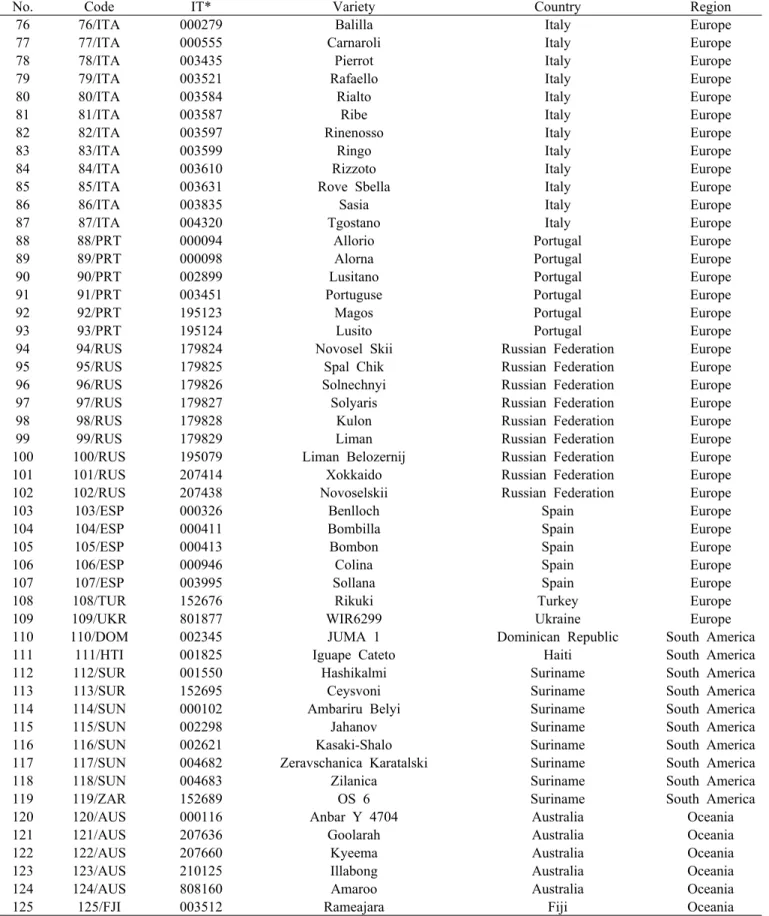
Table 1. The 125 rice accessions used in this study(Continued).
No. Code IT* Variety Country Region
76 76/ITA 000279 Balilla Italy Europe
77 77/ITA 000555 Carnaroli Italy Europe
78 78/ITA 003435 Pierrot Italy Europe
79 79/ITA 003521 Rafaello Italy Europe
80 80/ITA 003584 Rialto Italy Europe
81 81/ITA 003587 Ribe Italy Europe
82 82/ITA 003597 Rinenosso Italy Europe
83 83/ITA 003599 Ringo Italy Europe
84 84/ITA 003610 Rizzoto Italy Europe
85 85/ITA 003631 Rove Sbella Italy Europe
86 86/ITA 003835 Sasia Italy Europe
87 87/ITA 004320 Tgostano Italy Europe
88 88/PRT 000094 Allorio Portugal Europe
89 89/PRT 000098 Alorna Portugal Europe
90 90/PRT 002899 Lusitano Portugal Europe
91 91/PRT 003451 Portuguse Portugal Europe
92 92/PRT 195123 Magos Portugal Europe
93 93/PRT 195124 Lusito Portugal Europe
94 94/RUS 179824 Novosel Skii Russian Federation Europe
95 95/RUS 179825 Spal Chik Russian Federation Europe
96 96/RUS 179826 Solnechnyi Russian Federation Europe
97 97/RUS 179827 Solyaris Russian Federation Europe
98 98/RUS 179828 Kulon Russian Federation Europe
99 99/RUS 179829 Liman Russian Federation Europe
100 100/RUS 195079 Liman Belozernij Russian Federation Europe
101 101/RUS 207414 Xokkaido Russian Federation Europe
102 102/RUS 207438 Novoselskii Russian Federation Europe
103 103/ESP 000326 Benlloch Spain Europe
104 104/ESP 000411 Bombilla Spain Europe
105 105/ESP 000413 Bombon Spain Europe
106 106/ESP 000946 Colina Spain Europe
107 107/ESP 003995 Sollana Spain Europe
108 108/TUR 152676 Rikuki Turkey Europe
109 109/UKR 801877 WIR6299 Ukraine Europe
110 110/DOM 002345 JUMA 1 Dominican Republic South America
111 111/HTI 001825 Iguape Cateto Haiti South America
112 112/SUR 001550 Hashikalmi Suriname South America
113 113/SUR 152695 Ceysvoni Suriname South America
114 114/SUN 000102 Ambariru Belyi Suriname South America
115 115/SUN 002298 Jahanov Suriname South America
116 116/SUN 002621 Kasaki-Shalo Suriname South America
117 117/SUN 004682 Zeravschanica Karatalski Suriname South America
118 118/SUN 004683 Zilanica Suriname South America
119 119/ZAR 152689 OS 6 Suriname South America
120 120/AUS 000116 Anbar Y 4704 Australia Oceania
121 121/AUS 207636 Goolarah Australia Oceania
122 122/AUS 207660 Kyeema Australia Oceania
123 123/AUS 210125 Illabong Australia Oceania
124 124/AUS 808160 Amaroo Australia Oceania
125 125/FJI 003512 Rameajara Fiji Oceania
*: Introduction No. in the National Agrobiodiversity Center of Rural Development Administration (RDA).
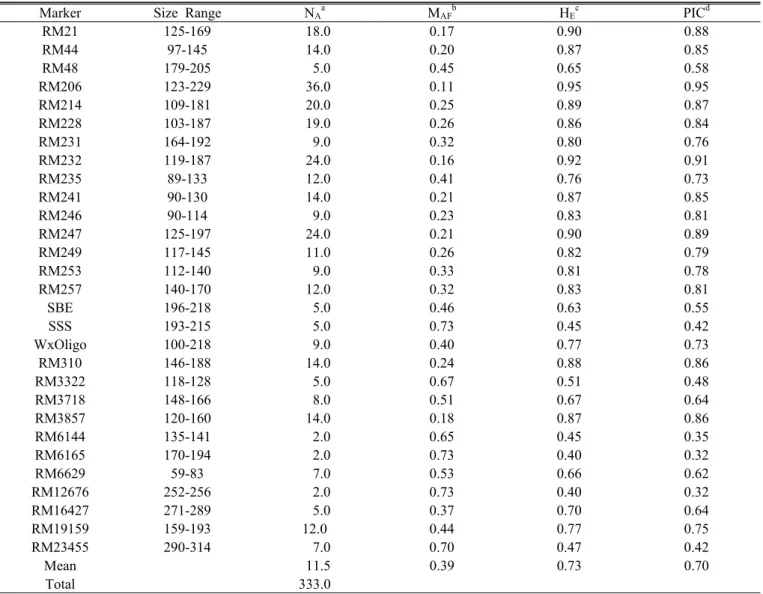
Table 2. Size range, total number of alleles, major allele frequency, expected heterozygosity, and polymorphism information content index for 29 simple sequence repeat loci in 125 accessions from five continents.
Marker Size Range N
AaM
AFbH
EcPIC
dRM21 125-169 18.0 0.17 0.90 0.88
RM44 97-145 14.0 0.20 0.87 0.85
RM48 179-205 5.0 0.45 0.65 0.58
RM206 123-229 36.0 0.11 0.95 0.95
RM214 109-181 20.0 0.25 0.89 0.87
RM228 103-187 19.0 0.26 0.86 0.84
RM231 164-192 9.0 0.32 0.80 0.76
RM232 119-187 24.0 0.16 0.92 0.91
RM235 89-133 12.0 0.41 0.76 0.73
RM241 90-130 14.0 0.21 0.87 0.85
RM246 90-114 9.0 0.23 0.83 0.81
RM247 125-197 24.0 0.21 0.90 0.89
RM249 117-145 11.0 0.26 0.82 0.79
RM253 112-140 9.0 0.33 0.81 0.78
RM257 140-170 12.0 0.32 0.83 0.81
SBE 196-218 5.0 0.46 0.63 0.55
SSS 193-215 5.0 0.73 0.45 0.42
WxOligo 100-218 9.0 0.40 0.77 0.73
RM310 146-188 14.0 0.24 0.88 0.86
RM3322 118-128 5.0 0.67 0.51 0.48
RM3718 148-166 8.0 0.51 0.67 0.64
RM3857 120-160 14.0 0.18 0.87 0.86
RM6144 135-141 2.0 0.65 0.45 0.35
RM6165 170-194 2.0 0.73 0.40 0.32
RM6629 59-83 7.0 0.53 0.66 0.62
RM12676 252-256 2.0 0.73 0.40 0.32
RM16427 271-289 5.0 0.37 0.70 0.64
RM19159 159-193 12.0 0.44 0.77 0.75
RM23455 290-314 7.0 0.70 0.47 0.42
Mean 11.5 0.39 0.73 0.70
Total 333.0
a
Number of alleles.
b
Major allele frequency.
c
Expected heterozygosity.
d
Polymorphism information content.
DNA extraction and SSR assay
DNA was extracted from freeze-dried leaves of 15-day-old seedlings of each accession using a DNA extraction kit (Qiagen).
The relative purity and concentration of extracted DNA was then checked using NanoDrop ND-1000 (NanoDrop Technologies Inc., Wilmington, DE, USA). Finally, DNA concentration was adjusted to 20 ng/μl.
In total, 29 microsatellite markers were chosen according to their location on the rice genetic map and their suitability for high-throughput genotyping (Table 2). All SSR marker
information is available in GRAMENE (http://www.gramene.org/).
Two different marker types were used for SSR assays. A
three-primer system was used that included a universal M13
oligo-nucleotide (TGTAAAACGACGGCCAGT) labeled with
the fluorescent dye 6-FAM (blue), NED (green), or HEX
(yellow), which allows PCR products to be triplexed during
electrophoresis. A special forward primer composed of the
concatenation of the M13 oligo-nucleotide and the specific
forward primer was used with the normal reverse primer
for SSR PCR amplification.
The fluorescent-labeled microsatellite markers were subjected to PCR amplification in a total volume of 20 μl containing 20 ng/μl genomic DNA, 4 μl of each primer, 10 μl 1×PCR buffer, 0.1 μl dNTP, and 0.5 μl Taq polymerase. The PCR profile used was 1 cycle at 94°C for 3min, followed by 30 cycles at 94°C for 30s, annealing temperature at 72°C for 45s, and a final extension at 72°C for 15 min. In the case of the M13 tail PCR method, PCR amplification was performed in a total volume of 20 μl containing 20ng genomic DNA, 2 μl of the specific primer, 4 μl M13 universal primer, 6 μ l normal reverse primer, 1×PCR buffer, 0.2 μl dNTP, and 0.5 μl Taq polymerase. Processes of the PCR amplification were as follows: 94°C for 3 min; 30 cycles at 94°C for 30s, the appropriate annealing temperature for 45s, and 72°C for 45s; followed by 20 cycles at 94°C for 30s, 53°C for 45s, 72°C for 45s; and a final extension at 72°C for 20 min.
The PCR products of the three microsatellites were mixed together in a ratio of FAM:HEX:NED = 1:3:4, which was varied depending on the amplification intensity for individual markers as determined on an ABI PRISM 3100 Genetic Analyzer (Applied Biosystems, Foster City, CA, USA). PCR products labeled with HEX and NED were added in higher amounts and those labeled with FAM were added in lower amounts because of the different signal intensities of these fluorescent dyes. The mixed PCR product of 1.5 μl was combined with 9.2 μl Hi-Di formamide and 0.3 μl of an internal size standard, Genescan-500 ROX. All samples were denatured at 94°C for 3 min and analyzed in an ABI PRISM 3100 Genetic Analyzer (Applied Biosystems). Molecular weights, in base pairs, of microsatellite products were estimated using Genescan software version 3.7 (Applied Biosystems) using the local Southern method. The individual fragments were assigned as alleles of the appropriate microsatellite loci with Genotyper software version 3.7 (Applied Biosystems).
Data analysis
Basic statistics for diversity measurements at each microsatellite locus, including the total number of alleles (N
A), allele frequency, major allele frequency, gene diversity (GD), and polymorphism information content (PIC), were calculated using the genetic analysis package PowerMarker V3.25 (Liu & Muse, 2005).
Genetic distances between each pair of accessions were measured by calculating the shared allele frequencies using PowerMarker
V3.25. The neighbor-joining algorithm was used to construct an unrooted phylogram from a distance matrix using MEGA4 software (Tamura et al., 2007).
Population structure was determined and identification of admixed individuals performed using the model-based software program STRUCTURE (Pritchard et al., 2000). In this model, a number of populations (K) are assumed to be present, each of which is characterized by a set of allele frequencies at each locus. Individuals in the sample are assigned to populations (clusters) or jointly to more populations if their genotypes indicate that they are admixed. All loci are assumed to be independent, and each K population is assumed to follow Hardy-Weinberg equilibrium. Posterior probabilities were estimated using a Markov Chain Monte Carlo method.
The Markov Chain Monte Carlo chains were run for 100,000 burn-in period lengths, followed by 200,000 iterations using a model allowing for admixture and correlated allele frequencies.
An individual was assigned to a group if more than 70%
of its genome fraction value derived from that group.
RESULTS
SSR polymorphism
The 29 SSR markers revealed 333 alleles among the 125
rice accessions representing the five continents (Table 1). The
accessions were collected from 40 different countries throughout
Africa, Asia, Europe, South America, and Oceania, representing
a variety of ecological zones. The allelic richness per locus
varied widely among the markers, ranging from 2 (RM6144,
RM6165, RM12676) to 36 (RM206) alleles, with an average
of 11.5 alleles. The database of allelic frequencies showed
that rare alleles (frequency <0.05) composed 57.1% of all
alleles, whereas intermediate (frequency =0.05–0.50) and abundant
(frequency >0.50) alleles composed 40.5% and 2.4% of all
alleles, respectively. This demonstrated that there was a large
proportion of rare alleles among all detected alleles and that
most alleles were of low frequency (Table 2, Fig. 1). The
frequency of major alleles per locus and the expected heterozygosity
varied from 0.11 (RM206) to 0.73 (SSS) and from 0.34
(RM6165) to 0.95 (RM206), with an average of 0.39 and
0.73, respectively. PIC values ranged from 0.32 (RM6165) to
0.95 (RM206), with an average of 0.70 (Table 2).
Fig. 1. Histogram of allele frequencies for all 333 alleles in the 125 rice accessions.
Table 3. Number of accessions, number of alleles, major allele frequency, and polymorphism information content of the regions.
Region N
AaN
AbM
AFcGD
dPIC
eAfrica 18 6.2 0.41 0.70 0.66
Asian 44 8.7 0.38 0.74 0.71
Europe 47 6.2 0.55 0.57 0.53
South
America 10 4.3 0.47 0.63 0.59
Oceania 6 3.0 0.57 0.52 0.47
a
Number of accessions.
b
Number of alleles.
c
Major allele frequency.
d
Genetic diversity.
e
Polymorphism information content.
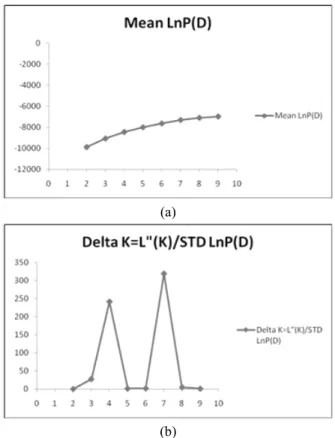
(a)
(b)
Fig. 2. (a) Log-likelihood of the data (n =125), L(K), as a function of K (number of groups used to stratify the sample). (b) Values of Δ K, with its modal value used to detect the true K of the four groups (K=4)
Geographical analysis of diversity
The number of accessions, number of alleles, major allele frequency, genetic diversity, and PIC of the five regions are shown in Table 3. The mean PIC values for each SSR locus in Africa, Asia, Europe, South America, and Oceania were 0.66, 0.71, 0.53, 0.59, and 0.47, respectively. The average number of alleles for each region was 6.2, 8.7, 6.2, 4.3, and 3.0, respectively. The tendencies of PIC and average number of alleles were in the order Asia > Africa > South America
> Europe > Oceania and Asia > Africa = Europe > South America > Oceania, respectively. It was found that Asian rice cultivars had the highest level of PIC, gene diversity and average number of allele, but lowest level of major allele frequency. While Oceanian rice cultivars was the opposite.
Population structure analysis
When the 125 accessions were analyzed for population
structure using a model-based approach (Pritchard et al., 2000), the estimated likelihood values for a given K in three independent runs yielded consistent results, but the inference of the exact value of K (gene pool) was not straightforward. Thus, another ad hoc quantity (ΔK) was used (Evanno et al., 2005) to overcome the difficulty of interpreting the real K value. The relatively high value of ΔK for 125 accessions were for K
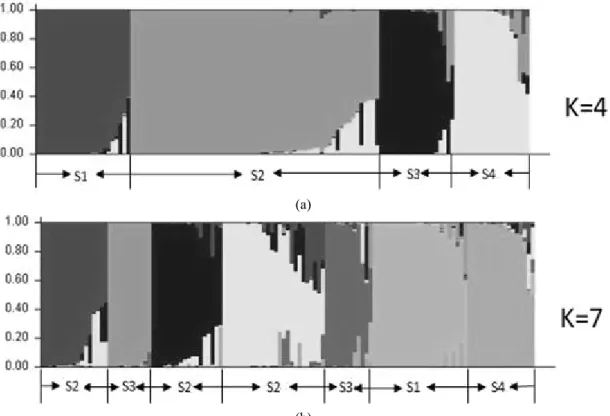
= 4 and K= 7 (Fig. 2). Clustering bar plots with K = 4 and
K = 7 were shown in Fig. 3. At K = 4, all 150 accessions
were divided into 4 clusters. At K = 7, accessions belonging
to S2 and S3 divided into 3 and 2 groups, respectively. However,
the highest number of accessions assigned to one specific
cluster with a probability higher than 90% was obtained with
k = 4, while with K = 7 this percentage dropped to 84% of
the total number of accessions, thus indicating the presence
of complex relationships among accessions. Analysis of these
data identified the major substructure groups when the number
of clusters was set at 4 with the relatively high value of
Δ K and high probability of accessions assigned to one
(a)
(b)
Fig. 3. Model-based clustering for each of the 125 rice landrace accessions examined based on the 29 SSR markers used to build the Q matrix.
Fig. 4. UPGMA dendrogram based on a genetic distance matrix among 125 rice accessions from 40 countries on five continents.
specific cluster (Maccaferri et al., 2005).The relatively small value of the alpha parameter (α = 0.0365) indicated that most accessions originated from one primary ancestor, with a few admixed individuals (Ostrowski et al., 2006).
Of the 125 rice accessions, 113 (90.4%) shared >70%
ancestry with one of the four subpopulations and were classified as members of that cluster, whereas the other 12 (9.6%) were admixture forms with varying levels of membership among the five clusters. Cluster 1 was represented by 23 accessions (colored red in Fig. 4) and one admixture (colored black in Fig. 4) that represented accessions collected mainly in Asia (17) and a few in Africa (2), South America (1) and Oceania (1). Cluster 2, with 58 individuals (colored green in Fig. 4) and five admixtures, represented accessions collected mainly in Europe (40) and a few in Africa (3), Asia (9), South America (4) and Oceania (2). Cluster 3 consisted of 16 accessions (colored blue in Fig. 4) and three admixtures mainly from Asia (10), with a few from Africa (1), Europe (2), South America (2) and Oceania (1). Cluster 4 consisted of 16 accessions (colored yellow in Fig.4) and three admixtures that represented accessions collected mainly in Africa (8)
and a few in Asia (1), Europe (2), South America (3) and Oceania (2). Thus, Clusters 2 and 4 consisted mainly of African and European rice cultivars, respectively. Clusters 1 and 3 were all primarily composed of Asian rice cultivars.
In addition to accessions that were clearly assigned to a
single population from which >70% of their inferred ancestry
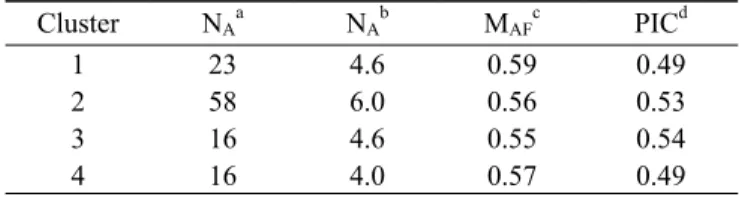
Table 4. Number of accessions, number of alleles, major allele frequency, genetic diversity, and polymor- phism information content of the clusters.
Cluster N
AaN
AbM
AFcPIC
d1 23 4.6 0.59 0.49
2 58 6.0 0.56 0.53
3 16 4.6 0.55 0.54
4 16 4.0 0.57 0.49
a
Number of accessions.
b
Number of alleles.
c
Major allele frequency.
d