Analysis of the Genetic Diversity and Population Structure of Amaranth Accessions from South America Using 14 SSR Markers
Win Htet Oo* and Yong-Jin Park**
†*Department of Plant Resources, College of Industrial Sciences, Kongju National University, Yesan 340-702, Korea
**Center for Crop Genetic Resources and Breeding, Kongju National University, Yesan 340-702, Korea
336
†
Corresponding author: (Phone) +82-41-330-1201 (E-mail) [email protected]
<Received 28 April, 2013; Revised 28 October, 2013; Accepted 30 October, 2013>
한작지(Korean J. Crop Sci.), 58(4): 336~346(2013) DOI : http://dx.doi.org/10.7740/kjcs.2013.58.4.336
ABSTRACT Amaranth (Amaranthus sp. L.) is an important group of plants that includes grain, vegetable, and ornamental types. Centers of diversity for Amaranths are Central and South America, India, and South East Asia, with secondary centers of diversity in West and East Africa. The present study was performed to determine the genetic diversity and population structure of 75 amaranth accessions: 65 from South America and 10 from South Asia as controls using 14 SSR markers.
Ninety-nine alleles were detected at an average of seven alleles per SSR locus. Model-based structure analysis revealed the presence of two subpopulations and 3 admixtures, which was consistent with clustering based on the genetic distance. The average major allele frequency and polymorphic information content (PIC) were 0.42 and 0.39, respectively. According to the model-based structure analysis based on genetic distance, 75 accessions (96%) were classified into two clusters, and only three accessions (4%) were admixtures. Cluster 1 had a higher allele number and PIC values than Cluster 2. Model-based structure analysis revealed the presence of two subpopulations and three admixtures in the 75 accessions. The results of this study provide effective information for future germplasm conservation and improvement programs in Amaranthus.
Keywords : Amaranth, genetic diversity, population structure, SSRs
Amaranthaceae , to which Amaranthus sp. L.
belong, includes approximately 87 species, 40 of which are considered native to the Americas. These species can be broadly categorized into grains, green leaf vegetables, and weed types, including pigweeds (Mujica and Jacobsen, 2003), which have a worldwide distribution (Xu and Sun, 2001; Costea et al., 2004). Hybrids of amaranth are widely cultivated as ornamental, pseudo-cereal and fodder crops in
many tropical to warm-temperate regions of the world (Sauer, 1950, 1967). Most cultivated amaranths are used for various purposes, such as food grains, leafy vegetables, and forage crops in diverse geographic areas, such as the Americas, China, Greece, Italy, Russia, Nepal, and India (Stallknecht and Schulz-Schaeffer, 1993).
The amaranth grain is a valuable food as it has a high protein content and well-balanced amino acid profile (Gamel et al., 2006). Analyses of the chemical composition and nutritional value of amaranth grain (Bressani et al., 1987; Dodok et al., 1997; Andrasofszky et al., 1998) confirmed its potential for use in human and animal nutrition as well as medicine (Oke, 1983; Teutenico and Knorr, 1985). With the increasing need to explore alternate sources of food, it is necessary to accelerate and expand the production of amaranths. Amaranths have high photosynthetic efficiency, low input requirements, high yield potential for grain, vegetable, and fodder production, and relatively higher tolerance to biotic and abiotic stresses, such as drought, diseases, and pests (Tucker, 1986).
Most species of amaranths are easily crossbred, and even
weedy types will cross with the intended crop if not
rogued from the field (Brien and Price, 2008). Taxonomic
classification is difficult, as it is necessary to consider
characteristics such as pigmentation that shows a wide
degree of variation as well as size of the plant, which
depends on the number of hours of sunlight and other
environmental variables. Finally, the amaranth plant has
high plasticity (Espitia, 1986). Information on the genetic
diversity and relationships within and among crop species
and their wild relatives is essential for efficient utilization
of plant germplasm. In addition, they also exhibit marked
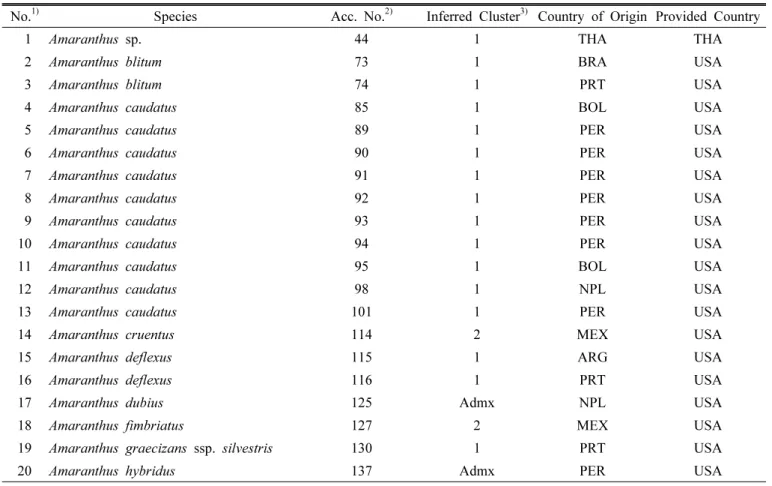
Table 1. List of the 75 accessions and their model-based clusters. (continued)
No.
1)Species Acc. No.
2)Inferred Cluster
3)Country of Origin Provided Country
1 Amaranthus sp. 44 1 THA THA
2 Amaranthus blitum 73 1 BRA USA
3 Amaranthus blitum 74 1 PRT USA
4 Amaranthus caudatus 85 1 BOL USA
5 Amaranthus caudatus 89 1 PER USA
6 Amaranthus caudatus 90 1 PER USA
7 Amaranthus caudatus 91 1 PER USA
8 Amaranthus caudatus 92 1 PER USA
9 Amaranthus caudatus 93 1 PER USA
10 Amaranthus caudatus 94 1 PER USA
11 Amaranthus caudatus 95 1 BOL USA
12 Amaranthus caudatus 98 1 NPL USA
13 Amaranthus caudatus 101 1 PER USA
14 Amaranthus cruentus 114 2 MEX USA
15 Amaranthus deflexus 115 1 ARG USA
16 Amaranthus deflexus 116 1 PRT USA
17 Amaranthus dubius 125 Admx NPL USA
18 Amaranthus fimbriatus 127 2 MEX USA
19 Amaranthus graecizans ssp. silvestris 130 1 PRT USA
20 Amaranthus hybridus 137 Admx PER USA
morphological diversity and adaptability to a range of eco-geographical conditions. Due to the agro-economic importance of amaranths, several studies of isozymes and various DNA markers have been performed to understand intra- and interspecific genetic diversity and/or evolutionary relationships (Lanoue et al., 1996; Chan and Sun, 1997;
Sun et al., 1999).
Several valuable methods for molecular marker systems, such as restriction-fragment length polymorphism (RFLP), random amplification of polymorphic DNA (RAPD), sequence- tagged sites (STS), amplified fragment length polymorphisms (AFLP), simple sequence repeats (SSRs) or microsatellites, and single nucleotide polymorphisms (SNPs), have been developed and applied for estimation of genetic diversity (Suh et al., 1997; Nagaraju et al., 2002; Feltus et al., 2004;
Bao et al., 2006; Zhao et al., 2009; Li et al. 2012).
Various marker systems have been used specifically to investigate genetic diversity (Tam et al., 2005). Microsatellites or simple sequence repeats (SSRs) have been shown to be
valuable for genetic studies (Lewers et al., 2005; Moe et al., 2010) and can be used to identify genetic relationships among closely related species or genera for molecular ecology and evolutionary biology, so as to address the mechanism(s) involved in population divergence and speciation (Barbara et al., 2007) or for studying genome evolution (Rousseau-Gueutin et al., 2008).
The objective of this study was to evaluate the genetic diversity and population structure of 75 accessions of amaranths collected from 12 countries, mainly from South America, conserved in the National Genebank of the Rural Development Administration, Republic of Korea (RDA- Genebank), using 14 selected polymorphic SSR markers.
MATERIALS AND METHODS Plant Materials
A total of 75 amaranth accessions collected from 12
countries (65 from South America for diversity and 10
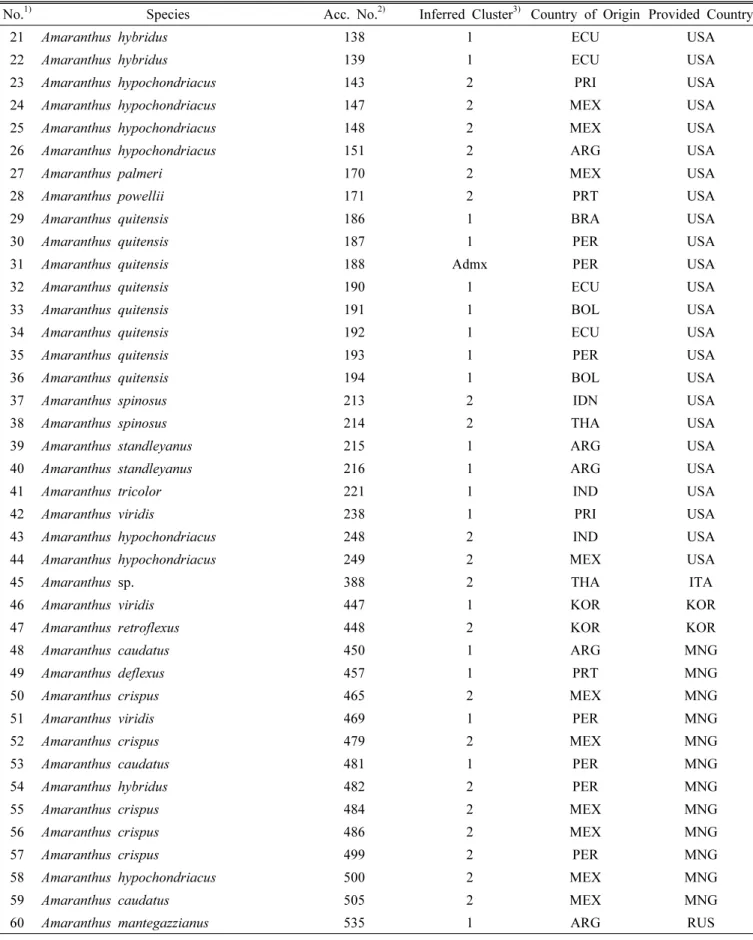
Table 1. List of the 75 accessions and their model-based clusters. (continued)
No.
1)Species Acc. No.
2)Inferred Cluster
3)Country of Origin Provided Country
21 Amaranthus hybridus 138 1 ECU USA
22 Amaranthus hybridus 139 1 ECU USA
23 Amaranthus hypochondriacus 143 2 PRI USA
24 Amaranthus hypochondriacus 147 2 MEX USA
25 Amaranthus hypochondriacus 148 2 MEX USA
26 Amaranthus hypochondriacus 151 2 ARG USA
27 Amaranthus palmeri 170 2 MEX USA
28 Amaranthus powellii 171 2 PRT USA
29 Amaranthus quitensis 186 1 BRA USA
30 Amaranthus quitensis 187 1 PER USA
31 Amaranthus quitensis 188 Admx PER USA
32 Amaranthus quitensis 190 1 ECU USA
33 Amaranthus quitensis 191 1 BOL USA
34 Amaranthus quitensis 192 1 ECU USA
35 Amaranthus quitensis 193 1 PER USA
36 Amaranthus quitensis 194 1 BOL USA
37 Amaranthus spinosus 213 2 IDN USA
38 Amaranthus spinosus 214 2 THA USA
39 Amaranthus standleyanus 215 1 ARG USA
40 Amaranthus standleyanus 216 1 ARG USA
41 Amaranthus tricolor 221 1 IND USA
42 Amaranthus viridis 238 1 PRI USA
43 Amaranthus hypochondriacus 248 2 IND USA
44 Amaranthus hypochondriacus 249 2 MEX USA
45 Amaranthus sp. 388 2 THA ITA
46 Amaranthus viridis 447 1 KOR KOR
47 Amaranthus retroflexus 448 2 KOR KOR
48 Amaranthus caudatus 450 1 ARG MNG
49 Amaranthus deflexus 457 1 PRT MNG
50 Amaranthus crispus 465 2 MEX MNG
51 Amaranthus viridis 469 1 PER MNG
52 Amaranthus crispus 479 2 MEX MNG
53 Amaranthus caudatus 481 1 PER MNG
54 Amaranthus hybridus 482 2 PER MNG
55 Amaranthus crispus 484 2 MEX MNG
56 Amaranthus crispus 486 2 MEX MNG
57 Amaranthus crispus 499 2 PER MNG
58 Amaranthus hypochondriacus 500 2 MEX MNG
59 Amaranthus caudatus 505 2 MEX MNG
60 Amaranthus mantegazzianus 535 1 ARG RUS
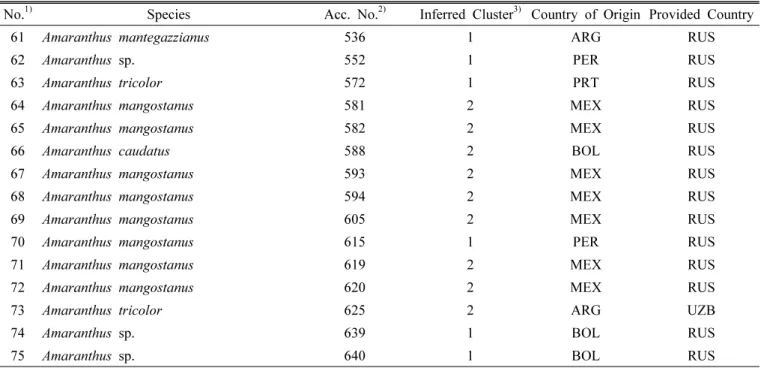
Table 1. List of the 75 accessions and their model-based clusters. (continued)
No.
1)Species Acc. No.
2)Inferred Cluster
3)Country of Origin Provided Country
61 Amaranthus mantegazzianus 536 1 ARG RUS
62 Amaranthus sp. 552 1 PER RUS
63 Amaranthus tricolor 572 1 PRT RUS
64 Amaranthus mangostanus 581 2 MEX RUS
65 Amaranthus mangostanus 582 2 MEX RUS
66 Amaranthus caudatus 588 2 BOL RUS
67 Amaranthus mangostanus 593 2 MEX RUS
68 Amaranthus mangostanus 594 2 MEX RUS
69 Amaranthus mangostanus 605 2 MEX RUS
70 Amaranthus mangostanus 615 1 PER RUS
71 Amaranthus mangostanus 619 2 MEX RUS
72 Amaranthus mangostanus 620 2 MEX RUS
73 Amaranthus tricolor 625 2 ARG UZB
74 Amaranthus sp. 639 1 BOL RUS
75 Amaranthus sp. 640 1 BOL RUS
1)
Code number of the accessions for Structure analysis.
2)
Final code number of the accessions in the National Genebank of the Rural Development Administration, Republic of Korea (RDA-Genebank).
3)
Clusters based on structure result.
accessions from South Asia as controls) were obtained from the RDA-Genebank (Table 1).
SSR genotyping
DNA was extracted from fresh leaves of each accession using a Qiagen DNA extraction kit (Qiagen, Seoul, Republic of Korea). The relative purity and concentration of extracted DNA were estimated using a NanoDrop ND-1000 spectro- photometer (NanoDrop Technologies, Inc., Wilmington, DE). The final concentration of each DNA sample was adjusted to 20ng/ml. For SSR assays, a total of 14 polymorphic SSR markers were selected from those reported by Lee et al. (2008). To measure the size of PCR products, the M13-tail PCR method was used (Schuelke, 2000), as described previously (Lee et al., 2008). SSR alleles were resolved on an ABI Prism 3100 DNA sequencer (Applied Biosystems, Foster City, CA) using GeneScan 3.7 software (Applied Biosystems) and sized precisely using GeneScan 500 ROX (6-carbon-X-rhodamine) molecular size standards (35-500 bp) with the Genotyper 3.7 software (Applied Biosystems).
Data analysis
Using the genetic analysis package PowerMarker (ver.
3.23; Liu and Muse, 2005), variability at each locus was measured in terms of the number of alleles (NA), observed heterozygosity (H
O), major allele frequency (M
AF), gene diversity (GD), and polymorphic information content (PIC).
The PIC value can be used to evaluate diversity using the formula:
where p
ilrepresents the allele frequency of the i
thallele at
locus l. The shared allele frequencies were also calculated
to measure genetic distances between each pair of accessions
using PowerMarker (ver. 3.23). The neighbor-joining method
was used to construct a phylogram from a distance matrix
using the MEGA4 software (Tamura et al., 2007) embedded
in PowerMarker. Same software was used to test the
Hardy-Weinberg equilibrium (HWE) and pairwise linkage
disequilibrium (LD).
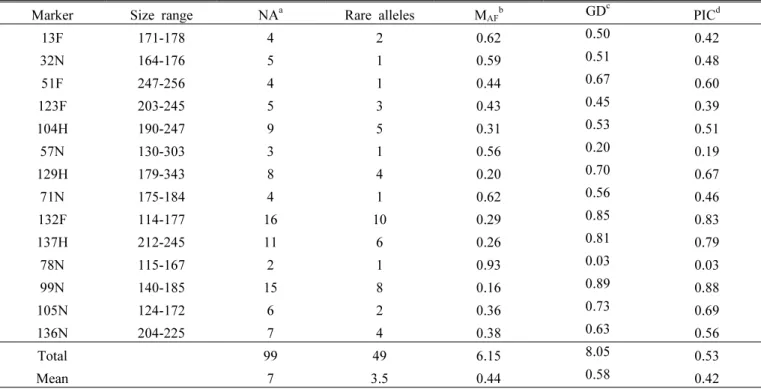
Table 2. Size range, number of alleles, number of rare alleles, major allele frequency, genetic diversity, and polymorphism information content index for 14 SSR loci in 75 accessions.
Marker Size range NA
aRare alleles M
AFbGD
cPIC
d13F 171-178 4 2 0.62 0.50 0.42
32N 164-176 5 1 0.59 0.51 0.48
51F 247-256 4 1 0.44 0.67 0.60
123F 203-245 5 3 0.43 0.45 0.39
104H 190-247 9 5 0.31 0.53 0.51
57N 130-303 3 1 0.56 0.20 0.19
129H 179-343 8 4 0.20 0.70 0.67
71N 175-184 4 1 0.62 0.56 0.46
132F 114-177 16 10 0.29 0.85 0.83
137H 212-245 11 6 0.26 0.81 0.79
78N 115-167 2 1 0.93 0.03 0.03
99N 140-185 15 8 0.16 0.89 0.88
105N 124-172 6 2 0.36 0.73 0.69
136N 204-225 7 4 0.38 0.63 0.56
Total 99 49 6.15 8.05 0.53
Mean 7 3.5 0.44 0.58 0.42
a
Number of alleles.
b
Major allele frequency.
c
Genetic diversity.
d
Polymorphic information content.
The possible population structure was analyzed using the model-based software program Structure 2.3.3 (Pritchard et al., 2000; Falush et al., 2003) in the 75 amaranth accessions and a model allowing admixture and correlated allele frequencies. At least four runs of Structure were performed with the number of clusters (K) set from 1 to 10, and the average likelihood value, L(K), across all runs was calculated for each K. In this model, several clusters (K) are assumed to be present, each of which is characterized by a set of allele frequencies for each locus. Individuals in the sample were assigned to clusters or jointly to two or more populations if their genotypes indicated that they were admixed. The model choice criterion to detect the most likely value of K was ΔK, which is an ad hoc quantity related to the second-order change in the log probability of data (LnP[D]) with respect to the number of clusters inferred by Structure (Evanno et al., 2005). An individual was assigned to a group if > 75% of its genome fraction value was derived from that group.
The molecular variance between two clusters resulting from model-based population and F
ST, the correlation of alleles within populations, were calculated by the analysis of molecular variance (AMOVA) approach in the Arlequin 3.11 program (Schneider and Excoffier, 1999; Excoffier and Schneider, 2005).
RESULTS
SSR polymorphism in the entire sample
Using the PowerMarker software (ver. 3.23; Liu and
Muse, 2005), SSR polymorphisms were measured in terms
of the numbers of alleles, gene diversity, and PIC. The 14
SSR markers revealed 99 alleles among the 75 amaranth
accessions of 65 were from South America and 10 from
South Asia with allele size ranging from 114 bp (132F) to
256 bp (51F). The allelic richness per locus varied widely
among the markers, ranging from 2 (78N) to 14 (132F),
with an average of seven alleles per locus (Table 2). The
Fig. 1. Histogram of allele frequencies for all 99 alleles in the
75 amaranth accessions. Fig. 2. (Log) Likelihood of the data (n = 75), L(K), as a function of K (number of clusters used to stratify the sample).
Fig. 3. Values of ΔK, with its modal value detecting the true K of two clusters (K = 2).
database of allelic frequencies showed that rare alleles (frequency < 0.05) comprised 49.50% of all alleles, whereas intermediate (frequency 0.05 –0.50) and abundant alleles (frequency > 0.50) comprised 45.45% and 5.05%, respectively, of all alleles detected. These results indicated the presence of a relatively large proportion of rare alleles, and most alleles were present at low frequency among the amaranth accessions studied (Table 2, Fig. 1). The genetic diversity varied from 0.03 (78N) to 0.89 (99 N), with an average of 0.58. A strong correlation was found between gene diversity and allelic richness (r = 0.77, P < 0.01, data not shown), as reported previously (Herrera et al., 2008). PIC values ranged from 0.03 to 0.88, with an average of 0.42 (Table 2).
Genetic diversity and population structure analysis To determine the population structure of 75 accessions, the model-based program Structure was used with all accessions and 14 SSR loci. The distribution of L(K) did not indicate a clear mode for the true K (Fig. 2). Therefore, a further ad hoc quantity ( ΔK) was used to overcome the difficulty of interpreting real K values (Evanno et al., 2005).
The true value of K can be determined by illustration of the peak based on ΔK. A highest peak of ΔK for 75 accessions was found for K = 2 (Fig. 3). At K = 2, the highest number of accessions was assigned to one specific cluster with a probability higher than 96%, so it was used for the final analysis. The relatively small value of the alpha parameter ( α = 0.0429) at K = 2 indicated that most of the accessions originated from one primary ancestor, with a few admixed individuals (Ostrowski et al., 2006).
Of the 75 amaranth accessions included in the analysis,
72 (96%) shared > 75% membership with one of two
clusters and were classified as members of that cluster,
whereas three accessions (4%) were categorized as admixture
forms with varying levels of membership shared between
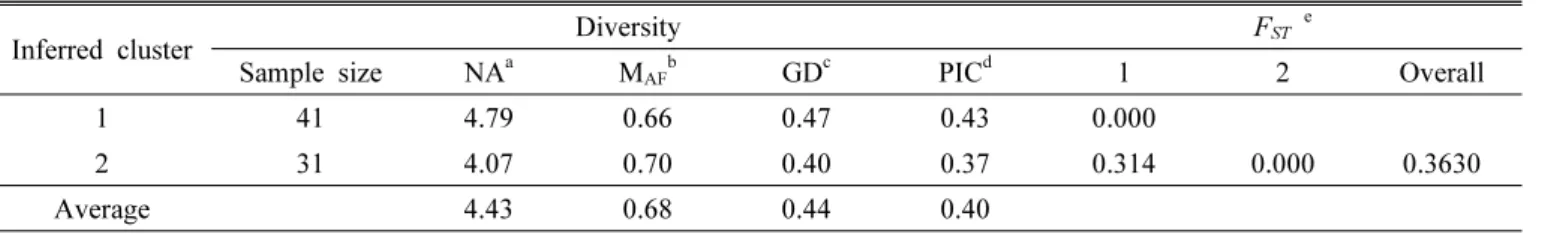
the two clusters. Cluster 1 consisted of 41 accessions (11
species) and the remaining 31 accessions (13 species) were
classified as cluster 2 (Table 1, Fig. 3). The mean gene
diversities for each SSR locus in Cluster 1 and Cluster 2
of amaranth were 0.47 and 0.40, respectively, and the
mean PIC values for each SSR locus were 0.43 and 0.37,
respectively. The comparative study of genetic diversity
showed that accessions from Cluster 1 (GD = 0.47, PIC =
0.43) possessed greater genetic diversity than Cluster 2 (GD
Table 3. Diversity information and F
STvalues of the two clusters.
Inferred cluster Diversity F
ST eSample size NA
aM
AFbGD
cPIC
d1 2 Overall
1 41 4.79 0.66 0.47 0.43 0.000
2 31 4.07 0.70 0.40 0.37 0.314 0.000 0.3630
Average 4.43 0.68 0.44 0.40
a
Number of alleles.
b
Major allele frequency.
c
Gene diversity.
d
Polymorphic information content.
e