323 This is an Open-Access article distributed under the terms of the Creative Commons Attribution Non-Commercial License (http://
creativecommons.org/licenses/by-nc/3.0) which permits unrestricted non-commercial use, distribution, and reproduction in any medium, provided the original work is properly cited.
J. Mushrooms 2020 September, 18(4):323-330 http://dx.doi.org/10.14480/JM.2020.18.4.323 Print ISSN 1738-0294, Online ISSN 2288-8853
© The Korean Society of Mushroom Science
Hye-Ran Shin(Undergraduate Student), Hyejin An(Graduate Student), Jun Hyoung Bang(Graduate Student), Jun Je Kim(Undergraduate Student), Seahee Han(Graduate Student), Hwa-Yong Lee(Professor), and Jong-Wook Chung(Professor)
*Corresponding author
E-mail : [email protected], [email protected] Tel : +82-42-261-2537
Received October 28, 2020 Revised November 12, 2020 Accepted November 23, 2020
SSR
마커를 이용한 유럽 양송이 자원의 유전적 다양성 및 집 단구조분석
신혜란1 · 안혜진1 · 방준형1 · 김준제1 · 한세희1 · 이화용2,* · 정종욱1,*
1충북대학교 농업생명환경대학 특용식물학과
2충북대학교 농업생명환경대학 산림학과
Genetic diversity and population structure of European button mushroom (Agaricus bisporus) using SSR markers
Hye-Ran Shin1, Hyejin An1, Jun Hyoung Bang1, Jun Je Kim1, Seahee Han1, Hwa-Yong Lee2,*, and Jong-Wook Chung1,*
1Department of Industrial Plant Science and Technology, Chungbuk National University, Cheongju 28644, Korea.
2Department of Forest Science, Chungbuk National University, Cheongju 28644, Korea
ABSTRACT: Agaricus bisporus is an important edible mushroom that is used as a functional food. In this study, European A.
bisporus strains were analyzed for genetic diversity, population structure, and genetic differentiation using simple sequence repeat (SSR) markers. European A. bisporus strains were divided into four groups by distance-based analysis and two subpopulations by model-based analysis. The SSR markers used in this study did not group European A. bisporus strains by geographical region or pileus color. Genetic diversity was high in Group 4 based on distance-based analysis and Pop. 2 based on model-based analysis.
A. bisporus strains showed very low genetic differentiation. The results of this study can be used for breeding A. bisporus in the future.
KEYWORDS: Agaricus bisporus, Button mushroom, Genetic diversity, Molecular marker, Simple Sequence Repeat
서 론
양송이(Agaricus bisporus)는 담자균류 주름버섯과의 식
용버섯 중 하나다. 양송이의 재배는 17세기 말 프랑스에 서 시작되어 현재는 유럽, 중국, 북미를 중심으로 전 세계 에서 이루어지고 있다(Sonnenberg et al., 2011; Callac, 1995). 양송이는 항산화물질인 폴리페놀 외에도 글루탐산, 비타민 D 등을 함유하고 있으며 저열량과 고단백 식품, 풍부한 소화효소 등 식품성이 뛰어나 오랫동안 전 세계적 으로 소비되어 왔다(Choi et al., 2010; Simon et al., 2011).
양송이는 이극성 교배 체계를 가지고 있고 (Raper et al., 1972), 하나의 자실체에서 95%는 2개의 담자포자를 형성하며, 이 중 63%는 이질핵체인 담자포자를 2개 가지 고, 32%는 동질핵체인 담자포자를 2개 가진다. 나머지 5% 중에서 4.5%는 3개의 담자포자를 형성하며, 단핵포자 1개 또는 동질핵체 2개를 가진다(Elliott, 1985). 따라서 하나의 자실체에서 약 95% 이상이 n+n형태의 포자를 형성 하여 다른 포자와의 교잡 과정 없이 2차 균사로 성장할 수 있다(Summerbell et al., 1989). 이러한 특징으로 인해 양송 이의 단핵포자를 이용한 교배육종이 어렵다(Sonnenberg et
al., 2011). 현재 전세계의 다양한 양송이 품종은 1980년대 초 네덜란드에서 개발된 Horst U1 균주를 모본으로 개발 된 것으로 알려져 있다 (Savoie et al., 2013). 이 결과, 양 송이의 다양한 품종들은 Restriction Fragment Length Polymorphism (RFLP), Random Amplified Polymorphic DNA (RAPD), Amplified Fragment Length Polymorphism (AFLP)와 같은 다양한 DNA marker를 통한 연구들에서 유전형이 Horst U1과 동일하거나 비슷하다고 밝혀졌다 (Moore et al., 2001; Xu et al., 2002; Foulongene-Oriol et al., 2011). 기존에 진행된 연구들을 통해 양송이가 좁 은 유전적 기반을 가지고 있음이 밝혀졌기 때문에, 양송 이 품종의 낮은 유전적 다양성 극복하고자 유럽뿐만 아니 라 중국과 북미, 중동 등의 전세계 자원 수집 및 다양성에 관한 연구가 이루어졌다(Fu et al., 2016; Callac et al., 2002; Sharareh et al., 2016; Wang et al., 2011).
표고버섯의 경우 야생균주와 품종간의 유전적 교류가 있음이 밝혀졌다(Xiang et al., 2016; Lee et al., 2020).
그리고 양송이의 경우에도 야생균주가 품종으로부터 유전 적 영향을 받은 것으로 밝혀졌다(Xu et al., 1997). 따라서, 현재 양송이 자원의 유전적 다양성 및 집단 구조의 지속적 인 재평가가 필요할 것이다.
Simple Sequence Repeat (SSR)는 genome에 전체에 1
~ 6 bp의 nucleotide가 반복되는 서열로 분포하며 공우성 이며 높은 수준의 다형성과 재현성을 보이는 장점이 있다 (Li et al., 2002). 이 SSR 마커는 유전자원의 구분 및 유
전적 다양성을 연구(Barroso et al., 2000), 그리고 집단구 조 분석에 적합한 것으로 알려져 있다(Du et al., 2012).
따라서 본 연구에서는 SSR 마커를 이용하여 현재 유럽 양송이의 다양성을 재평가하고 집단구조를 분석하였다.
재료 및 방법
실험재료 및 DNA 추출
본 연구에서는 농촌진흥청 국립원예특작과학원 버섯과 에서 보유하고 있는 양송이 36자원을 분양 받아 사용하였 다(Table 1). 양송이 균사는 CDA배지(건조시킨 퇴비 4%, malt extract 0.7%, sugar 1%, agar 2%)에서 25oC에 4주 간 배양하였다. 배양된 양송이 균사는 3일간 동결건조 시 킨 후 Tissue LyserII (QIAGEN, USA)로 분쇄해 DNA를 추출하였다. DNA는 Plant SV mini kit (GeneAll, Korea)를 사용해 제시된 매뉴얼에 따라 추출하였다. 추출된 DNA는 spectrophotometer (BioTek, USA)을 사용해 25 ng/ul로 정량 하여 사용하였다.
PCR 및 Genotyping
SSR marker는 An 등 (2019)이 개발한 마커 중 대립유 전자 수와 PIC값이 높은 20개를 선발하였다. PCR 증폭은 DNA 2 ul, primer (10 pmol/ul) 2 ul, Excel TB 2X Taq Pre-Mix (Inclone, Korea) 15 ul, 증류수 19 ul의 혼합물로 총 40 ul를 사용하였다. PCR은 CFX96 (Bio-Rad Laboratories,
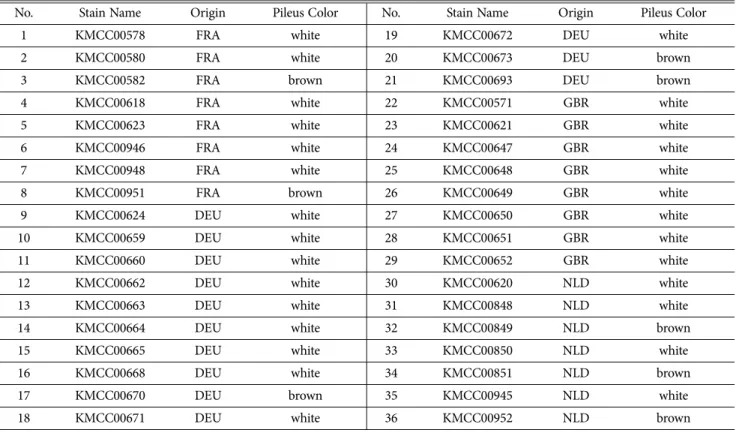
Table 1. The list of Strains of A. bisporus used in this study
No. Stain Name Origin Pileus Color No. Stain Name Origin Pileus Color
1 KMCC00578 FRA white 19 KMCC00672 DEU white
2 KMCC00580 FRA white 20 KMCC00673 DEU brown
3 KMCC00582 FRA brown 21 KMCC00693 DEU brown
4 KMCC00618 FRA white 22 KMCC00571 GBR white
5 KMCC00623 FRA white 23 KMCC00621 GBR white
6 KMCC00946 FRA white 24 KMCC00647 GBR white
7 KMCC00948 FRA white 25 KMCC00648 GBR white
8 KMCC00951 FRA brown 26 KMCC00649 GBR white
9 KMCC00624 DEU white 27 KMCC00650 GBR white
10 KMCC00659 DEU white 28 KMCC00651 GBR white
11 KMCC00660 DEU white 29 KMCC00652 GBR white
12 KMCC00662 DEU white 30 KMCC00620 NLD white
13 KMCC00663 DEU white 31 KMCC00848 NLD white
14 KMCC00664 DEU white 32 KMCC00849 NLD brown
15 KMCC00665 DEU white 33 KMCC00850 NLD white
16 KMCC00668 DEU white 34 KMCC00851 NLD brown
17 KMCC00670 DEU brown 35 KMCC00945 NLD white
18 KMCC00671 DEU white 36 KMCC00952 NLD brown
USA)을 사용하여 다음과 같은 순서로 진행하였다. 95oC에 서 2분간 초기 변성시킨 후 95oC에서 20초 동안 변성시 킨 후 55oC에서 40초 annealing, 72oC에서 45초 후 10분 간 최종 extension 순으로 30회 반복하였다. 증폭된 DNA 의 길이는 Fragment Analyzer (Advanced Analytical
Technologies Inc., USA)를 통해 확인하였다. Genotyping 은 ProSize 3.0 software (Advanced Analytical Technologies Inc., USA)를 사용하였다.
Data 분석
유전적 다양성은 Power Marker (ver 3.25)를 사용하여 Major Allele Frequency (MAF), Number of alleles (NA), Gene Diversity (GD), Observed Heterozygosity (Ho), Polymorphism Information Content (PIC)의 항목을 통해 분석하였다. 군집분석을 위한 Dendrogram은 MEGA7 로 SharedAllele distance Method를 사용하여 Unweighted Pair Group Method with Arithmatic Mean(UPGMA) tree를 확인했다(Kumar et al., 2016). 양송이의 원산지와 갓 색과 같은 특징에 따른 확인은 Mesquite software (ver 3.61)를 이용하였다. GenAlex (ver 6.5)를 통한 Principal Coordinate Analysis (PCoA)를 사용하여 다차원 분포를 확인하였다 (Peakall and Smouse, 2012). 집단구조는 STRUCTURE software를 통해 분석하였으며 Unrooted tree에 적용해 구 조를 확인하였다(Pritchard et al., 2000). GenAlEx (ver 6.5) 프로그램의 Analysis of molecular variance (AMOVA) 분 석을 통해 집단 간 또는 개체 간의 유전적 분화 수준을 추 정하였다.
결과 및 고찰
SSR marker를 이용한 유전적 다양성 분석
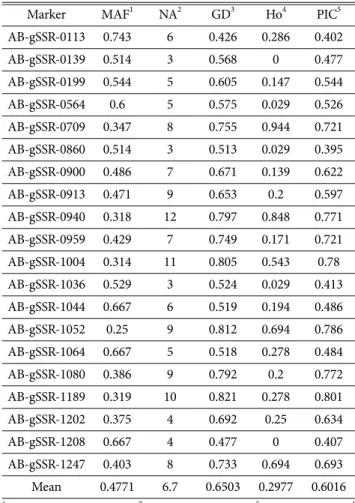
양송이 36자원의 다양성 지수는 Table 3에 정리하였다.
양송이 36자원의 MAF는 0.25 (AB-gSSR-1052)에서 0.743 (AB-gSSR-0113)으로 평균 0.4771로 나타났다. NA 는 134개이며 AB-gSSR-0139, AB-gSSR-0860, AB- gSSR-1036에서 3개로 가장 적었고, AB-gSSR-0940이 12 개로 가장 많았다. GD는 0.426 (AB-gSSR-0113)에서 0.821 (AB-gSSR-1189), 평균 0.6503으로 나타났다. Ho는 0 (AB-gSSR-0139, AB-gSSR-1208)에서 0.944 (AB-gSSR- 0709)의 분포를 보였고, 평균은 0.2977이었다. PIC 값의 평균은 0.6016이었으며 0.395 (AB-gSSR-0860)에서 0.801 (AB-gSSR-1189)의 분포를 보였다.
유전적 다양성의 척도는 여러 유형이 있는데, 특히 대립 유전자의 수에 기반하고 있는 척도와 이형접합에 기반하 고 있는 척도가 있다(Greenbaum et al., 2014). MAF와 NA는 대립유전자의 수에 기반하고 있는 다양성으로서 자 연선택에 영향을 받고 있어, 환경변화에 대한 적응력의 척도로 이용될 수 있다(Fisher, 1930). 그리고 GD와 Ho는 이형접합에 기반하고 있는 다양성으로서 대립유전자의 빈 도를 통하여 유전자의 흐름과 같은 과정을 포함하고 있다 (Wright, 1921).
An 등(2019)의 경우 동일한 마커에서 대립유전자의 수 가 182개로 본 연구보다 많이 나타났으며, PIC값 역시 평 균 0.7479로 더 높은 값을 가졌다. An 등(2019)의 연구의 Table 2. Information on SSR markers used for this study
Marker Name
SSR
motif Primer Sequence AB-gSSR-0113 (AG)6
F-TACTCAACAACATGATGCCATT R-CTTATATTCTCCTCGCTGTTGG AB-gSSR-0139 (AG)6 F-GAATACGTAAGCTGACCTCCTG
R-CAATTCCTGCTTTCTCTCTACG AB-gSSR-0199 (AG)9 F-TCAAATTCCATGGTGTTGAGTA R-GGACATGCGTATAGACCTCATT AB-gSSR-0564 (CTT)6
F-GAGGAAAGTTGCTGGTATGAAG R-GAAGAAGACGACGAAGAAGAAA AB-gSSR-0709 (TCT)5
F-GGATCGCCCTAATACACAATTA R-CAGTGGTAGTTGATCGCAGTAA AB-gSSR-0860 (GGT)5F-GCTTAGGCTTCAGAGTGTCAAC R-AGAGTTACTTTACACCTGGGCA AB-gSSR-0900 (TAA)5 F-AGGGAGAAATCAAGCTATGTGA R-GACACTCTCTTCATCCAAATCC AB-gSSR-0913 (TAC)5 F-ATGACAATTAACTGCTGGTCCT R-AATGGTACATGATTTCCTCGTC AB-gSSR-0940 (TTG)5
F-GTTGAGAAGTTGAGAAGTTGGG R-TTTGTACTTATGCCTCAAACCC AB-gSSR-0959 (CAA)5F-GCTCGTGAAGTTGCTTTAGAGT
R-GACTCTCATGAGTATAAGGCGG AB-gSSR-1004 (GAA)5F-ATGAGGTTGATGTTGATGTTGA R-TCGTCGTTAACTCTGATGTTTG AB-gSSR-1036 (TGA)5
F-GAACGTCAACATAACACGAATG R-TTGATGTGTGGTTACAAGGAGA AB-gSSR-1044 (TCA)6
F-CCAGTTGCCAAAGGATTAGTAG R-ATTACAACCGATCCAAATAACG AB-gSSR-1052 (TGA)5 F-CTCGAGATACAATCTCCTCACC R-AGTAATCAAACCTCCAAACGAA AB-gSSR-1064 (TCA)6 F-CTTCTCCAGGGAGAGGAATACT R-ATGAACAAGAACGAGGAAAGAA AB-gSSR-1080 (TGA)5
F-ATGCTTGAGGGAGAGTTTGATA R-AACAACAACAATTTCAGGTTCC AB-gSSR-1189 (CGA)6
F-AATATGTGTTTAAGCCGTTTGG R-TGGGTAGTAACAACACGTTGAA AB-gSSR-1202 (CGA)5F-GATTCAAGCTCAACTTCGGTAG R-TACTTACATGTAGTGGCCATCG AB-gSSR-1208 (GGA)6F-ATCTTGGAAATTATGCACTTGG R-GAATGGTTCTTTGGTAGTGCTC AB-gSSR-1247 (GGA)7F-AGGTCTGCTAAGGAATCACTTG R-GCAACAACGTCTTCATTGTCTA
경우 전 세계에서 수집한 다양한 자원을 사용하였기 때문 에 지리적, 유전적으로 제한되게 유럽 자원만을 분석한
본 연구의 다양성이 상대적으로 낮게 나온 것으로 추정된 다. 하지만 중국으로 제한된 지리적 조건에서 중국의 품종 및 야생균주의 다양성을 분석한 Fu 등 (2016)의 연구와 비교해보면 Fu 등 (2016)의 연구의 경우 대립 유전자의 개수는 88개로 본 연구 결과보다 낮았지만 평균 PIC값은 0.6183으로 본 연구의 결과와 비슷한 결과를 나타냈다.
양송이 자원의 유연관계 및 군집분석
양송이 균주들을 유전적 거리기반의 그룹(Distance- based group)으로 분류하였을 때, 4개의 그룹으로 나누어 졌다(Fig. 1A). Group 1은 3자원(프랑스 2자원, 독일 1자 원), Group 2는 6자원(독일 4자원, 영국 2자원), Group 3 은 4자원 (영국 1자원, 네덜란드 3자원)이 포함되었고, Group 4는 23자원 (프랑스 6자원, 독일 8자원, 영국 5자 원, 네덜란드 4자원)으로 가장 많은 자원이 포함되었다.
또한 원산지(Fig. 1B-1)와 갓 색(Fig. 1B-2)의 두 가지 특 징을 적용시킨 각 tree를 통해 자원 간 분포를 확인하였다 (Fig. 1B). 양송이는 원산지와 갓 색에 의해 그룹이 나눠 지지 않고 다양하게 분포하였다. 두 dendrogram은 유럽 양송이 자원의 유전적 유연관계가 지리적 거리와 관계가 없음을 나타냈다. 양송이는 초기 유럽에서 재배될 때 주 기적으로 새로운 균주로 바꾸기 위한 유럽 야생종의 수집 과 교배가 이루어져왔다(Callac, 1995). 이로 인해 유럽 내 양송이 자원 간 유전적인 교류가 활발히 일어나 지리 적으로 구분이 되지 않는 것으로 생각된다.
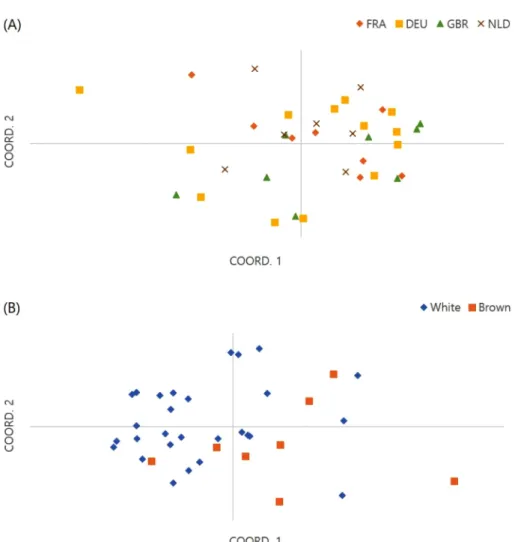
PCoA를 통해 양송이의 유전적 거리를 기반으로 군집화 하였다(Fig. 2). 양송이는 각 원산지와 갓 색에 따라 특정 한 군집을 이루지 않았다. 본 연구에 사용된 SSR marker 를 통해서는 원산지나 갓 색 같은 특성을 지닌 자원을 구 Table 3. Characteristics of 20 SSR marker used for this study
Marker MAF1 NA2 GD3 Ho4 PIC5 AB-gSSR-0113 0.743 6 0.426 0.286 0.402
AB-gSSR-0139 0.514 3 0.568 0 0.477
AB-gSSR-0199 0.544 5 0.605 0.147 0.544 AB-gSSR-0564 0.6 5 0.575 0.029 0.526 AB-gSSR-0709 0.347 8 0.755 0.944 0.721 AB-gSSR-0860 0.514 3 0.513 0.029 0.395 AB-gSSR-0900 0.486 7 0.671 0.139 0.622 AB-gSSR-0913 0.471 9 0.653 0.2 0.597 AB-gSSR-0940 0.318 12 0.797 0.848 0.771 AB-gSSR-0959 0.429 7 0.749 0.171 0.721 AB-gSSR-1004 0.314 11 0.805 0.543 0.78 AB-gSSR-1036 0.529 3 0.524 0.029 0.413 AB-gSSR-1044 0.667 6 0.519 0.194 0.486 AB-gSSR-1052 0.25 9 0.812 0.694 0.786 AB-gSSR-1064 0.667 5 0.518 0.278 0.484 AB-gSSR-1080 0.386 9 0.792 0.2 0.772 AB-gSSR-1189 0.319 10 0.821 0.278 0.801 AB-gSSR-1202 0.375 4 0.692 0.25 0.634
AB-gSSR-1208 0.667 4 0.477 0 0.407
AB-gSSR-1247 0.403 8 0.733 0.694 0.693 Mean 0.4771 6.7 0.6503 0.2977 0.6016
1 Major allele frequency, 2 Number of alleles, 3 Gene diversity, 4 Observed heterozygosity, 5 Polymorphism information content
Fig. 1. Dendrogram of 36 A. bisporus was constructed, (A); UPGMA generated by SharedAllele distance Method of 36 A.
bisporus based on SSR markers. (B); Dendrogram is marked by the color of origins B-1 and pileus on the B-2, Origins; FRA:
green, GBR: blue, DEU: yellow, NLD: orange and Color of pileus; White: sky blue, Brown: brown.
분할 수 없었다. 이와 같은 구분을 위해서는 농업적 형질 과 연관된 QTL 분석이 필요할 것이다(Gao et al., 2016).
양송이 36자원의 집단구조 분석
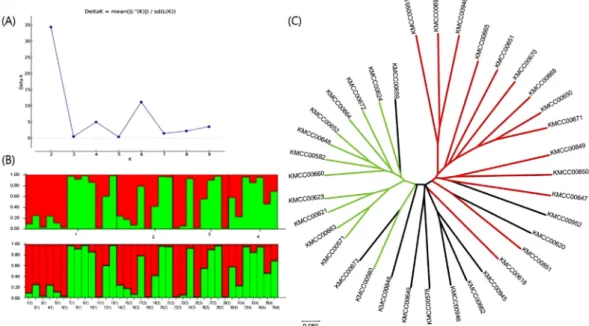
STRUCTURE software를 통해 양송이의 집단구조 (Model-based subpopulations)를 분석하였고 각 집단에 해당하는 자원을 확인하였다(Fig. 3A, B). STRUCTURE 를 통해 분석한 결과를 Unrooted tree에 적용하여 집단구 조를 확인하였다(Fig. 3C). Delta K값이 2일 때 가장 높은
peak가 확인되었다(Fig. 3A). 이에 따라 각 집단에 속할 확률이 80% 이상일 때 Pop. 1과 Pop. 2로 구분되었다.
Pop. 1은 독일 4자원, 프랑스 3자원, 영국 4자원, 네덜란 드 2자원로 13자원이 포함되었으며, Pop. 2는 독일 6자원, 프랑스 2자원, 영국 3자원, 네덜란드 1자원으로 12자원이 포함되었다. Pop. 1과 Pop. 2 모두에 속하지 못하는 Admixture는 독일 3자원, 프랑스 3자원, 영국 1자원, 네덜 란드 4자원으로 총 11자원이 포함되었다(Table 4). 이 결 과는 양송이 유럽 양송이 자원들이 지리적인 요인에 관계 Fig. 2. Principle coordinate analysis for 20 SSR marker applied on 36 A. bisporus, (A); Origins; FRA: ◇, DEU: □, GBR: △,
NLD: × (B); Color of pileus; White: ◇, Brown: □.
Table 4. Distribution by origin of distance-based groups and model-based groups
Distance-based groups Model-based subpopulations
origins Group 1 Group 2 Group 3 Group 4 Pop. 1 Pop. 2 Admixture
DEU 1 4 0 8 5 5 3
FRA 2 0 0 6 3 3 2
GBR 0 2 1 5 4 3 1
NDL 0 0 3 4 0 3 4
Total 3 6 4 23 12 14 10
없이 집단이 구분되어 있어, 유럽 양송이 자원 간 유전적 교류가 활발히 이뤄져 왔음을 확인할 수 있으며 이 결과 는 군집분석 결과와 일치하였다. Lee 등 (2019)은 한국의 23개의 양송이 자원이 포함된 총 42개의 양송이 자원을 유전적 거리기반의 그룹과 집단구조 분석을 통한 subpopulation 분석에서, 한국, 유럽 그리고 미국의 자원 들은 서로 지리적 요인과 관계없이 분포하여 있었다. 따 라서 유럽의 양송이 자원들뿐만 아니라 전세계의 양송이 자원들의 유전적 교류가 활발하였음을 확인할 수 있다.
군집 내의 유전적 다양성 비교
자원의 원산지 간, 유전적 거리기반의 그룹 간, 그리고 집단구조 분석을 통한 subpopulation 간의 유전적 다양성 을 분석하여 비교하였다(Table 5). 원산지 별로 자원을 평 가했을 때 대립유전자 수는 독일 자원이 4.7개, 프랑스 자 원이 4.1개, 영국 자원이 3.55개, 네덜란드 자원이 4.25개 로 독일이 가장 많았으며 영국이 가장 적었다. 반면 PIC 값은 독일 자원이 0.562, 프랑스 자원이 0.554, 영국 자원 이 0.502, 네덜란드 자원이 0.568로 네덜란드가 가장 높 았고 영국이 가장 낮았다. 유전적 거리기반의 그룹 간 비 교에서 Group 1이 2.55개의 대립유전자 수로 가장 적었 으며 PIC값이 0.412로 가장 낮았고 Group 4는 대립유전 자 수가 5개로 가장 많았으며 PIC값도 0.52로 가장 많았 다. 집단구조 분석을 통한 subpopulation 간에서는 Pop. 1 은 대립유전자 수가 3.1, Pop. 2는 5.7이었으며, PIC값은 각각 0.404와 0.631로 Pop. 2의 유전적 다양성이 Pop. 1 보다 높았다.
AMOVA를 통한 양송이의 유전적 분화 분석
유럽 양송이 자원의 유전적 분화를 AMOVA 분석 결과 를 통해 확인하였다(Table 6). 원산지 4곳을 분석한 결과 는 원산지 간 차이 3%, 개체 간 차이 54%, 원산지 내 개 체 간 차이 43%로 유전변이의 대부분은 개체 간 차이 (97%)에 기인하였다. Fst의 경우 0.032 (p=0.001)로 낮은 유전적 분화를 보였다. 유전적 거리기반의 그룹 간은 개 체 간 차이 57%, 집단 내 개체 간 차이 43%로 나왔으나 Fst는 -0.004(p=0.639)로 집단간 분화가 보이지 않았다.
Fig. 3. Population structure of 36 A. bisporus based on STRUCTURE at Delta K=2, (A); Measure of Delta K for each K value. (B); Resources are arranged in the order of Germany, France, England and the Netherlands. (C); Unrooted UPGMA tree constructed based on STRUCTURE (Delta K=2). The branches were colored Pop. 1 green, Pop. 2 red, and Admixture black.
Table 5. Comparison of genetic diversity in clusters divided by analysis
MAF1 NA2 GD3 Ho4 PIC5
Origins
DEU 0.488 4.7 0.616 0.279 0.562 FRA 0.521 4.1 0.611 0.331 0.554 GBR 0.55 3.55 0.559 0.231 0.502 NLD 0.485 4.25 0.624 0.373 0.568
Distance-based groups
Group 1 0.617 2.55 0.478 0.35 0.412 Group 2 0.593 3.3 0.504 0.233 0.449 Group 3 0.571 3 0.524 0.321 0.467 Group 4 0.548 5 0.573 0.305 0.52 Model-based
subpopulations
Pop1 0.636 3.1 0.457 0.26 0.404 Pop2 0.443 5.7 0.678 0.302 0.631
1 Major allele frequency, 2 Number of alleles, 3 Gene diversity, 4 Observed heterozygosity, 5 Polymorphism information content
집단구조 분석을 통한 subpopulation 간의 분석 결과는 집단 간 차이 2%, 개체 간 차이 58%, 집단 내 개체 간 차 이 41%로 나타났으며 Fst 역시 0.017 (p=0.074)로 낮은 유전적 분화가 나타났다. 세 그룹 모두 집단의 분화가 없 거나 매우 낮았으며 개체 간 변이가 큰 것으로 보아 유럽 양송이의 유전적 다양성이 균주 간 차이에서 비롯된 것으 로 추측할 수 있다.
다른 자원과 비교해 보았을 때, SSR marker를 통한 국 내 표고버섯 집단은 수집영역 간 Fst=0.01로 양송이보다 낮게 나왔으나, 야생 균주 와 품종 간은 Fst=0.08로 더 높 게 나타났다(Lee et al., 2020). 또한 SNP marker를 통한 중국 송이버섯의 집단은 유역 간 Fst=0.067로 나타났다 (Amend et al., 2010). 유럽 양송이의 경우 앞서 언급한 두 연구와 유사하게 균주 간의 변이가 높게 나타났다. 이 는 높은 수준의 SSR 다양성이 원산지보다 균주 간에 분 할되어 있음을 의미한다.
적 요
본 연구에서는 유럽 양송이 자원들을 SSR marker를 통 해 유전적 다양성과 집단 구조, 유전적 분화에 대하여 분 석하였다. 본 연구에서 유럽의 양송이 자원들은 유전적 거 리기반의 4개의 그룹으로 나뉘었고 집단구조 분석을 통하 여 2개의 subpopulation으로 이루어져 있었다. 본 연구에 서 사용한 SSR 마커로 유럽의 양송이 자원들은 지리적 그 리고 갓색으로 구분되지 않았다. 유전적 다양성은 유전적 거리기반의 그룹에서는 Group 4, 집단구조 분석을 통한 subpopulation에서는 Pop. 2의 다양성이 높았다. 그리고 양송이 자원들은 유전적 분화가 매우 낮았다. 본 연구의
결과는 차후 양송이의 육종 등에 이용 할 수 있을 것이다.
감사의 글
본 연구는 농림축산식품부의 재원으로 농림수산식품기 술기획평가원의 Golden Seed 프로젝트 사업(213007-05- 4-SBJ30)으로 수행되었습니다.
REFERENCES
An H, Jo IH, Oh YL, Jang KY, Kong WS, Sung JK, So YS, Chung JW. 2019. Molecular characterization of 170 new gDNA-SSR markers for genetic diversity in button mushroom (Agaricus bisporus). Mycobiology 47: 527-532.
Amend A, Garbelotto M, Fang Z, Keeley S. 2010. Isolation by landscape in populations of a prized edible mushroom Tricholoma matsutake. Conserv Genet 11: 795-802.
Barroso G, Sonnenberg ASM, Van Griensven LJLD, Labarere J.
2000. Molecular cloning of a widely distributed microsatellite core sequence from the cultivated mushroom Agaricus bisporus. Fungal Genet Biol 31: 115-123.
Callac P. 1995. Breeding of edible fungi with emphasis on the variability among French genetic resources of Agaricus bisporus. Can J Bot 73: S980-S986.
Callac P, Theochari I, Kerrigan RW. 2002. The germplasm of Agaricus bisporus: Main results after ten years of collecting in France, in Greece, and in North America. In G. Paroussi, D.
Voyiatzis, E. Paroussis (ed.), II Balkan Symposium on Vegetables and Potatoes. Greece. 49-55.
Choi SJ, Lee YS, Kim JK, Kim JK, Lim SS. 2010. Physiological activities of extract from edible mushrooms. J Korean Soc Food Sci Nutr 39: 1087-1096.
Du QZ, Wang BW, Wei ZZ, Zhang DQ, Li BL. 2012. Genetic Table 6. Results of the AMOVA for 36 A. bisporus.
Source df SS MS Est. Var. % Fst
Origins
Among Pops 3 42.456 14.152 0.219 3%
0.032*
Among Indiv 32 329.530 10.298 3.691 54%
Within Indiv 36 105.000 2.917 2.917 43%
Total 71 476.986 6.826 100%
Distance-based groups
Among Pops 3 30.955 10.318 0.000 0%
-0.004***
Among Indiv 32 341.031 10.657 3.870 57%
Within Indiv 36 105.000 2.917 2.917 43%
Total 71 476.986 6.787 100%
Model-based populations
Among Pops 1 13.576 13.576 0.133 2%
0.017***
Among Indiv 24 255.655 10.652 3.932 58%
Within Indiv 26 72.500 2.788 2.788 41%
Total 51 341.731 6.833 100%
*P=0.001
** P=0.639
*** P=0.074
diversity and population structure of Chinese white poplar (Populus tomentosa) revealed by SSR markers. J Hered 103:
853-862.
Elliott TJ. 1985. Genetics and breeding of species of Agaricus. In P. B. Flegg, D. M. Spencer, D. A. Wood (ed.), Biology and Technology of the Cultivated Mushroom, Wiley. England.
111-139.
Fisher R. 1930. The genetical theory of natural selection. Oxford University Press. England. p. 360.
Foulongene-Oriol M, Remi D, Cathy S, Christine D, Aurelien B, Anne R, Savoie JM. 2011. Comparative linkage mapping in the white button mushroom Agaricus bisporus provides foundation for breeding management. Curr Genet 57: 39-50.
Fu Y, Wang X, Li D, Liu Y, Song B, Zhang C, Wang Q, Chen M, Zhang Z, Li Y. 2016. Identification of resistance to wet bubble disease and genetic diversity in wild and cultivated strains of Agaricus bisporus. Int J Mol Sci 17: 1568.
Gao W, Baar JJP, Maliepaard C, Visser RGF, Zhang J, Sonnenberg ASM. 2016. Multi-trait QTL analysis for agronomic and quality characters of Agaricus bisporus (button mushroom).
AMB Express 6: 67.
Greenbaum G, Templeton AR, Zarmi Y, Bar-David S. 2014.
Allelic richness following population founding events – A stochastic modeling framework incorporating gene flow and genetic drift. PLOS ONE 9: e115203.
Kumar S, Stecher G, Tamura K. 2016. MEGA7: Molecular evolutionary genetics analysis version 7.0 for bigger datasets.
Mol Biol Evol 33: 1870-1874.
Lee HY, An HJ, Oh YL, Jang GY, Kong WS, Ryu HJ, Cheong JW.
2019. Assessment of genetic diversity and population structure of commercial button mushroom (Agaricus bisporus) strains in Korea. J Mushroom 17: 171-178.
Lee HY, Moon S, Ro HS, Chung JW, Ryu H. 2020. Analysis of genetic diversity and population structure of wild strains and cultivars using genomic SSR markers in Lentinula edodes.
Mycobiology 48: 115-121.
Li YC, Korol AB, Fahima T, Beiles A, Nevo E. 2002.
Microsatellites: genomic distribution, putative functions and mutational mechanisms: a review. Mol Ecol 11: 2453-2465.
Moore AJ, Challen MP, Warmer PJ, Elliott TJ. 2001. RAPD discrimination of Agaricus bisporus mushroom cultivars. Appl Microbiol Biotechnol 55: 742-749.
Peakall R, Smouse PE. 2012. GenAlEx 6.5: genetic analysis in Excel. Population genetic software for teaching and research-
an update. Bioinfornatics 28: 2537-2539.
Pritchard JK, Stephens M, Donelly P. 2000. Inference of population structure using multilocus genotype data. Genetics 155: 945-959.
Raper CA, Raper JR, Miller RE. 1972. Genetic analysis of the life cycle of Agaricus bisporus. Mycologia 64: 1088-1117.
Savoie JM, Foulongne-Oriol M, Barroso G, Callac P. 2013.
Genetics and genomics of cultivated mushrooms, application to breeding of Agarics. In F. Kempken (ed.), Agricultural Applications, Springer-Verlag. Germany. 3-33.
Simon RR, Phillips KM, Horst RL, Munro IC. 2011. Vitamin D mushrooms: Comparison of the composition of button mushrooms (Agaricus bisporus) treated postharvest with UVB light or sunlight. J Agric Food Chem 59: 8724-8732.
Sharareh R, Pourianfar HR, Janpoor J. 2016. Collection and identification of Iranian wild mushrooms: towards establishment of a mushroom bio-bank. J Adv Res 4: 256-260.
Sonnenberg ASM, Johan JPB, Patrick MH, Brian L, Wei G, Amrah W, Jurriaan JM. 2011. Breeding and strain protection in the button mushroom Agaricus bisporus. In J. M. Savoie, M.
Foulongne-Oriol, M. Largeteau, G. Barroso (ed.), Proceedings of the 7th International Conference on Mushroom Biology and Mushroom Products. Arcachon, France. 7-15.
Summerbell RC, Castle AJ, Horgen PA, Anderson JB. 1989.
Inheritance of restriction fragment length polymeophisms in Agaricus brunnescens. Genetics 123: 293-300.
Wang ZS, Chen MY, Cai ZX, Liao JH, Li HR, Guo ZJ, Lu ZH. 2011.
DNA fingerprinting of genetic diversity of Agaricus bisporus. In J.
M. Savoie, M. Foulongne-Oriol, M. Largeteau, G. Barroso (ed.), Proceedings of the 7th International Conference on Mushroom Biology and Mushroom Products, France. 1-8.
Wright S. 1921. Systems of mating. I. The biometric relations between parent and offspring. Genetics 6: 111-123.
Xiang X, Li C, Li L, Bian Y, Kwan HS, Nong W, Cheung MK, Xiao Y. 2016. Genetic diversity and population structure of Chinese Lentinula edodes revealed by InDel and SSR markers.
Mycol Prog 15: 37.
Xu J, Kerrigan RW, Callac P, Horgen PA, Anderson JB. 1997.
Genetic structure of natural populations of Agaricus bisporus, the commercial button mushroom. J Hered 88: 482-488.
Xu J, Kerrigan RW, Sonnenberg ASM, Callac P, Horgen PA, Anderson JB. 1998. Mitochondrial DNA variation in natural populations of the mushroom Agaricus bisporus. Mol Ecol 7:
19-33.