Analysis of Genetic Diversity and Population Structure of Buckwheat (Fagopyrum esculentum Moench) Landraces of
Korea Using SSR Markers
Jae Young Song, Gi-An Lee, Mun-Sup Yoon, Kyung-Ho Ma, Yu-Mi Choi, Jung-Ro Lee, Yeonju Jung, Hong-Jae Park, Chung-Kon Kim and Myung-Chul Lee*
National Agrobiodiversity Center, NAAS, RDA, Suwon 441-853, Korea
Abstract - Buckwheat (Fagopyrum esculentum Moench), one of the minor crops grown in Korea belonging to the Polygonaceae family, is an annual crop widely cultivated in Asia, Europe, and America and has a character of outcrossing and self-incompatibility. The objective of this study was to analyze the genetic variability, phylogenetic relationships and population structure of buckwheat landraces of Korea using SSR markers. Ten microsatellite markers have been detected from a total of 79 alleles among the 179 buckwheat accessions were collected from Korea. The number of allele per marker locus (NA) ranged from 2 (GB-FE-001, GB-FE-043 and GB-FE-055) to 31 (GB-FE-035) with an average of 7.9 alleles.
GB-FE-035 was the most polymorphic with the highest PIC value 0.93. Major allele frequencies (MAF) for the 10 polymorphic loci varied from 0.12 to 0.97 with a mean allele frequency of 0.57. The expected heterozygosity (HE) values ranged from 0.05 to 0.94 with an average of 0.53. The observed heterozygosity (HO) ranged from 0.06 to 0.92 with an average of 0.42. The overall polymorphic information contents (PIC) values ranged from 0.05 to 0.93 with an average of 0.48. The landrace accessions of buckwheat used in the present study were not distinctly grouped according to geographic distribution. The study concludes that the results revealed genetic differentiation was low according to the geographic region because of outcrossing and self-incompatibility. We reported that our analyses on the genetic diversity of common buckwheat cultivars of Korea were performed by using of microsatellite markers.
Key words - Buckwheat (Fagopyrum esculentum), Differentiation, Genetic diversity, Microsatellite
*Corresponding author. E-mail : [email protected]
Introduction
Common buckwheat (Fagopyrum esculentum Moench) is a typical species showing outcrossing and self-incompatiblity belonging to the family Polygonaceae (Park et al., 2009;
Sharma and Boyes, 1961). Common buckwheat has been widely distributed and a cultivated crop of considerable importance in many countries around the world, in Asia, America and Europe, although the cultivation of this crop has not increased in recent years (Alekseeva, 1986; Kump and Javornik, 1996). The important component of buckwheat seeds are of possession of a well-balanced quantity of essential amino acids and excellent nutritional value (Gao et al., 2010;
Javomik et al., 1981). Besides all, common buckwheat is also an important source as a nectariferous and pharmaceutical
plant (Alekseeva, 1986). Most of the varieties of common buckwheat grown are local populations adapted to their environmental conditions through cultivation. For the protection of crop varieties, information on genetic distances among inbreds is important for the identification of essential derivation as well as legal protection of germplasm (Smith et al., 1995).
Therefore, information about the genetic diversity and population structure in the selection of the breeding material is one of fundamental importance for the improvement of crops (Hallauer and Miranda, 1988). So, the evaluation of germplasm diversity and relationships among the contemporary cultivated and wild varieties and populations is important both for future breeding and for the study of buckwheat evolution (Kump and Javornik, 1996). The genetic diversity among and within common buckwheat cultivars has been studied using allozyme analysis (Ohnishi, 1998) and the origin of cultivated common buckwheat has been studied by the
diffusion routes analysis using RAPD markers (Murai and Ohnishi, 1996).
Recent advances in molecular biology have offered more suitable molecular markers for assessing genetic diversity than RAPD markers. Among the PCR-based techniques, amplified fragment length polymorphism (AFLP) (Vos et al., 1995) and simple sequence repeat (SSR) markers are widely used for studies on genetic diversity of crop species. The advantages of SSR markers are their codominant mode of inheritance and hypervariability, which make them ideal for a wide range of applications (Goldstein and Schlötterer, 1999).
Simple sequence repeats (SSRs, also called microsatellites) are abundantly distributed throughout eukaryotic genomes (Litt and Luty, 1989). Microsatellite markers are a powerful tool for the analysis of wide genetic variations within or among populations (Tautz, 1989). In many crops, several recent studies have used SSR markers to assess the genetic diversity, phylogenetic relationships, and population structures of various crops, for example in durum wheat (Thuillet et al., 2005), maize (Vigouroux et al., 2005), and rice (Li et al., 2010). The aims of the present study were to evaluate the genetic diversity, population structure and genetic relationships among geographically diverse accessions of buckwheat landraces of Korea maintaining or conserving in National Agrobiodiversity Center of RDA using SSR markers.
Materials and Methods
Plant materials and DNA extraction
A list of common buckwheat accessions used in this study is given in Table 1. A total of 179 accessions of common buckwheat were obtained from the National Agrobiodiversity Center of the Rural Development Administration (RDA) (http://genebank.rda.go.kr), Korea (GW 19, GG 3, GN 24, JN 14, JB 43, CN 4 and CB 12 accessions). For the DNA extraction, each 5 seeds of 179 accessions were germinated and cultivated in soil trays. Genomic DNA was extracted from green leaves of buckwheat seedling. Total genomic DNA was extracted from the leaves of the seedling using a modified CTAB procedure as previously described by Kump and Javornik (1996). The DNA concentration was determined using a UV–Vis spectrophotometer (ND-1000; NanoDrop,
Wilmington, DE, USA). The DNA solution was then diluted to a working concentration with distilled water and stored at -20℃ until use.
Assess of microsatellite markers
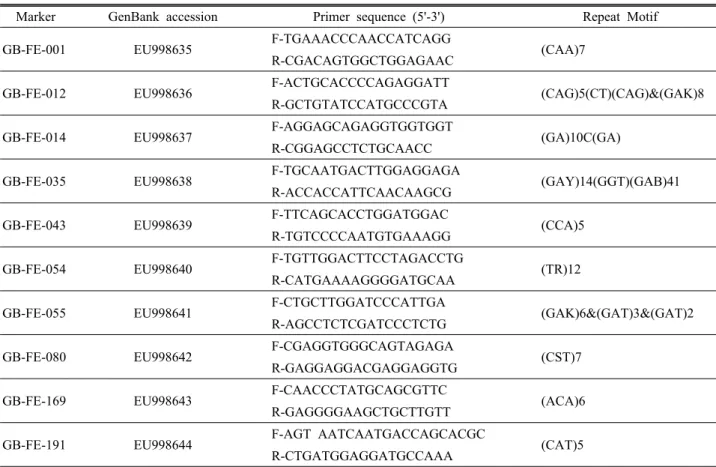
All of the SSR markers were obtained from molecular markers of developed by Ma et al. (2009) for analysis of genetic diversity and relationships in common buckwheat.
Ten polymorphic SSR markers were utilized in a genetic diversity analysis of a common buckwheat population consisting of 179 accessions of diverse regions in Korea (Table 2). The M13F-tail PCR method of Schuelke (2000) was used to measure the size of PCR products (Ma et al., 2009). PCR amplification was carried out in a total volume of 20 ul containing 2 ul of genomic DNA (10 ng/ul), 0.2 ul of the specific primer (10 pmol/ul), 0.4 ul of M13 universal primer (10 pmol/ul), 0.6 ul of normal reverse primer, 2.0 ul of 10 x PCR buffer (Takara, Tokyo, Japan), 1.6 ul of dNTP (2.5 mM), and 0.2 ul of Taq polymerase (5 unit/ul; Takara). The reaction mixture was subjected to the following conditions: initial denaturation at 94℃ for 3 min, followed by 30 cycles of denaturation at 94℃ for 30 sec, annealing at 52-55℃ for 45 sec, then 15 cycles at 94℃ for 30 sec, 53℃ for 45 sec, and extension at 72℃ for 45 sec and final extension at 72℃ for 10 min. PCR was carried out in PTC-220 thermocyclers (MJ Research, Waltham, MA, USA). The PCR products were then run on an ABI PRISM 3130xl Genetic Analyzer according to the manufacturer’s instructions (Applied Biosystems, USA). Fragments were sized and scored into alleles using GeneMapper v4.0 software (Applied Biosystems, USA).
Data analyses of genetic diversity and population structure The total number of alleles, allele frequency, gene diversity and polymorphism information content (PIC) per individual SSR locus were calculated with the PowerMarker version 3.25 analysis (Liu and Muse, 2005). Genetic distance between each pair of accessions were calculated from Nei’s distance (Nei and Takezaki, 1983) using the program PowerMarker.
Nei’s distance was calculated and used the unrooted phylogeny reconstruction using neighbor-joining (NJ) method as implemented in PowerMarker version 3.25 (Liu and Muse, 2005). The tree to visualize the phylogenetic distribution of accessions was
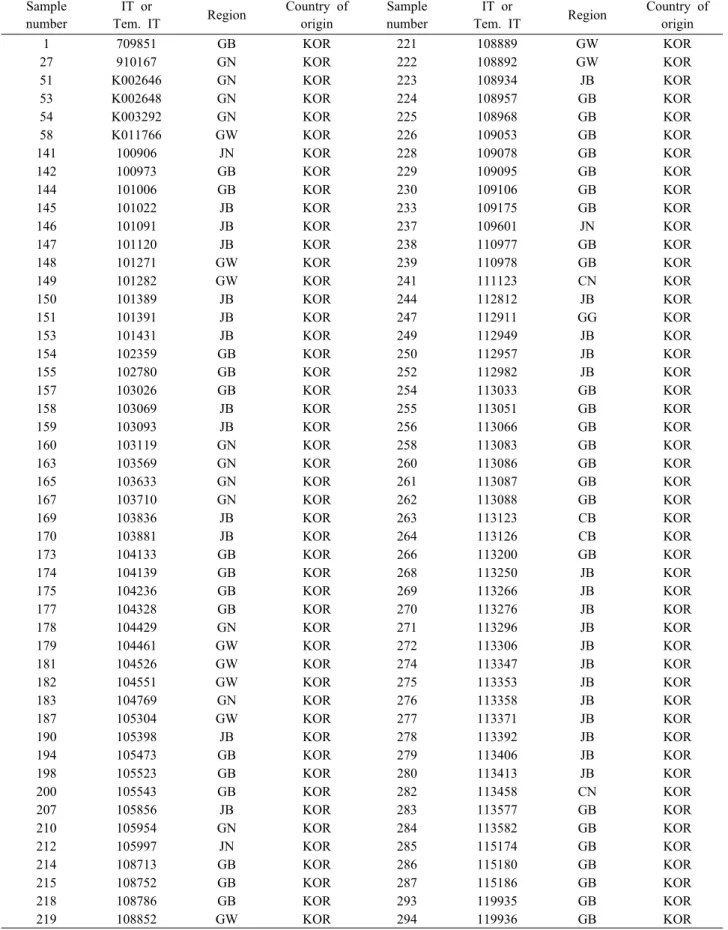
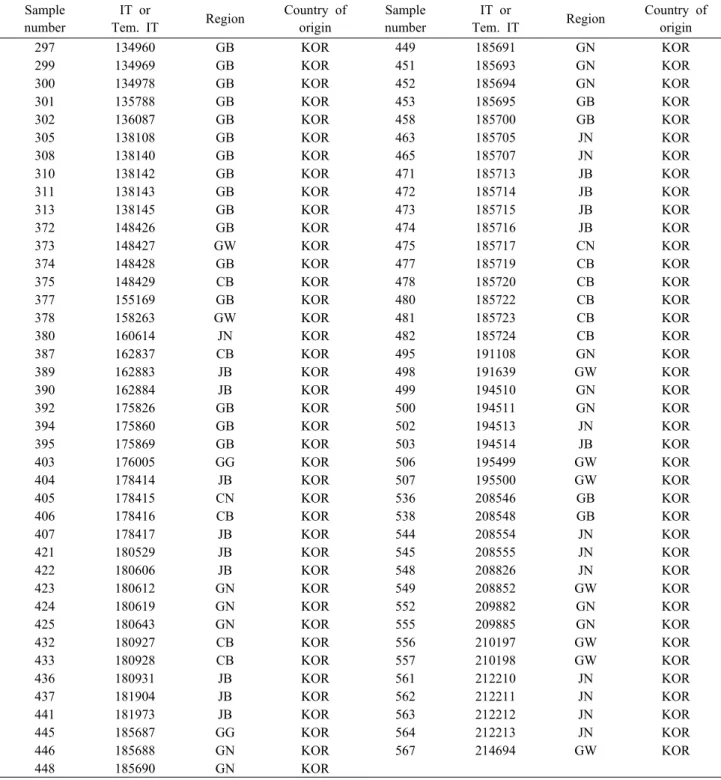
Table 1. List of 179 buckwheat accessions of the collection in the RDA.
Sample number
IT or
Tem. IT Region Country of origin
Sample number
IT or
Tem. IT Region Country of origin
1 709851 GB KOR 221 108889 GW KOR
27 910167 GN KOR 222 108892 GW KOR
51 K002646 GN KOR 223 108934 JB KOR
53 K002648 GN KOR 224 108957 GB KOR
54 K003292 GN KOR 225 108968 GB KOR
58 K011766 GW KOR 226 109053 GB KOR
141 100906 JN KOR 228 109078 GB KOR
142 100973 GB KOR 229 109095 GB KOR
144 101006 GB KOR 230 109106 GB KOR
145 101022 JB KOR 233 109175 GB KOR
146 101091 JB KOR 237 109601 JN KOR
147 101120 JB KOR 238 110977 GB KOR
148 101271 GW KOR 239 110978 GB KOR
149 101282 GW KOR 241 111123 CN KOR
150 101389 JB KOR 244 112812 JB KOR
151 101391 JB KOR 247 112911 GG KOR
153 101431 JB KOR 249 112949 JB KOR
154 102359 GB KOR 250 112957 JB KOR
155 102780 GB KOR 252 112982 JB KOR
157 103026 GB KOR 254 113033 GB KOR
158 103069 JB KOR 255 113051 GB KOR
159 103093 JB KOR 256 113066 GB KOR
160 103119 GN KOR 258 113083 GB KOR
163 103569 GN KOR 260 113086 GB KOR
165 103633 GN KOR 261 113087 GB KOR
167 103710 GN KOR 262 113088 GB KOR
169 103836 JB KOR 263 113123 CB KOR
170 103881 JB KOR 264 113126 CB KOR
173 104133 GB KOR 266 113200 GB KOR
174 104139 GB KOR 268 113250 JB KOR
175 104236 GB KOR 269 113266 JB KOR
177 104328 GB KOR 270 113276 JB KOR
178 104429 GN KOR 271 113296 JB KOR
179 104461 GW KOR 272 113306 JB KOR
181 104526 GW KOR 274 113347 JB KOR
182 104551 GW KOR 275 113353 JB KOR
183 104769 GN KOR 276 113358 JB KOR
187 105304 GW KOR 277 113371 JB KOR
190 105398 JB KOR 278 113392 JB KOR
194 105473 GB KOR 279 113406 JB KOR
198 105523 GB KOR 280 113413 JB KOR
200 105543 GB KOR 282 113458 CN KOR
207 105856 JB KOR 283 113577 GB KOR
210 105954 GN KOR 284 113582 GB KOR
212 105997 JN KOR 285 115174 GB KOR
214 108713 GB KOR 286 115180 GB KOR
215 108752 GB KOR 287 115186 GB KOR
218 108786 GB KOR 293 119935 GB KOR
219 108852 GW KOR 294 119936 GB KOR
Table 1. Continued.
Sample number
IT or
Tem. IT Region Country of origin
Sample number
IT or
Tem. IT Region Country of origin
297 134960 GB KOR 449 185691 GN KOR
299 134969 GB KOR 451 185693 GN KOR
300 134978 GB KOR 452 185694 GN KOR
301 135788 GB KOR 453 185695 GB KOR
302 136087 GB KOR 458 185700 GB KOR
305 138108 GB KOR 463 185705 JN KOR
308 138140 GB KOR 465 185707 JN KOR
310 138142 GB KOR 471 185713 JB KOR
311 138143 GB KOR 472 185714 JB KOR
313 138145 GB KOR 473 185715 JB KOR
372 148426 GB KOR 474 185716 JB KOR
373 148427 GW KOR 475 185717 CN KOR
374 148428 GB KOR 477 185719 CB KOR
375 148429 CB KOR 478 185720 CB KOR
377 155169 GB KOR 480 185722 CB KOR
378 158263 GW KOR 481 185723 CB KOR
380 160614 JN KOR 482 185724 CB KOR
387 162837 CB KOR 495 191108 GN KOR
389 162883 JB KOR 498 191639 GW KOR
390 162884 JB KOR 499 194510 GN KOR
392 175826 GB KOR 500 194511 GN KOR
394 175860 GB KOR 502 194513 JN KOR
395 175869 GB KOR 503 194514 JB KOR
403 176005 GG KOR 506 195499 GW KOR
404 178414 JB KOR 507 195500 GW KOR
405 178415 CN KOR 536 208546 GB KOR
406 178416 CB KOR 538 208548 GB KOR
407 178417 JB KOR 544 208554 JN KOR
421 180529 JB KOR 545 208555 JN KOR
422 180606 JB KOR 548 208826 JN KOR
423 180612 GN KOR 549 208852 GW KOR
424 180619 GN KOR 552 209882 GN KOR
425 180643 GN KOR 555 209885 GN KOR
432 180927 CB KOR 556 210197 GW KOR
433 180928 CB KOR 557 210198 GW KOR
436 180931 JB KOR 561 212210 JN KOR
437 181904 JB KOR 562 212211 JN KOR
441 181973 JB KOR 563 212212 JN KOR
445 185687 GG KOR 564 212213 JN KOR
446 185688 GN KOR 567 214694 GW KOR
448 185690 GN KOR
†CB, Chungbuk; CN, Chungnam; GB, Gyeongbuk; GG, Gyeonggi; GN, Gyeongnam ; GW, Gangwon; JB,Jeogbuk; JN, Jeonnam.
constructed using the software MEGA version 5.03 (Tamura et al., 2007) embedded in PowerMarker. The model-based program STRUCTURE (Pritchard et al., 2007) was utilized to infer population structure and assign individuals to populations based on the SSR genotypes using a burn-in of 50,000, run
length of 100,000 and a model allowing for admixture and correlated allele frequencies. The number of populations (K) was set from 1 to 10, with 3 independent runs each. The most probable value (K) corresponds to the peak in the D(K), which is an ad hoc statistic D(K), assisted with L(K), L’(K)
Table 2. List of microsatellite markers used in this study.
Marker GenBank accession Primer sequence (5'-3') Repeat Motif GB-FE-001 EU998635 F-TGAAACCCAACCATCAGG
(CAA)7 R-CGACAGTGGCTGGAGAAC
GB-FE-012 EU998636 F-ACTGCACCCCAGAGGATT
(CAG)5(CT)(CAG)&(GAK)8 R-GCTGTATCCATGCCCGTA
GB-FE-014 EU998637 F-AGGAGCAGAGGTGGTGGT
(GA)10C(GA) R-CGGAGCCTCTGCAACC
GB-FE-035 EU998638 F-TGCAATGACTTGGAGGAGA
(GAY)14(GGT)(GAB)41 R-ACCACCATTCAACAAGCG
GB-FE-043 EU998639 F-TTCAGCACCTGGATGGAC
(CCA)5 R-TGTCCCCAATGTGAAAGG
GB-FE-054 EU998640 F-TGTTGGACTTCCTAGACCTG
(TR)12 R-CATGAAAAGGGGATGCAA
GB-FE-055 EU998641 F-CTGCTTGGATCCCATTGA
(GAK)6&(GAT)3&(GAT)2 R-AGCCTCTCGATCCCTCTG
GB-FE-080 EU998642 F-CGAGGTGGGCAGTAGAGA
(CST)7 R-GAGGAGGACGAGGAGGTG
GB-FE-169 EU998643 F-CAACCCTATGCAGCGTTC
(ACA)6 R-GAGGGGAAGCTGCTTGTT
GB-FE-191 EU998644 F-AGT AATCAATGACCAGCACGC
(CAT)5 R-CTGATGGAGGATGCCAAA
and L”(K) (Evanno et al., 2005). The D(K) perceives the rate of change in log probability of the data with respect to the number of groups inferred by STRUCTURE.
Results and Discussion
Profile of microsatellite markers
We assessed the genetic variability of common buckwheat landrace accessions representing diverse regional collections in Korea using SSR markers (Table 1). Ten microsatellite markers detected a total of 79 alleles among the 179 buckwheat accessions (Table 3). The number of allele per SSR marker locus (NA) ranged from 2 (GB-FE-001, GB-FE-043 and GB- FE-055) to 31 (GB-FE-035) with an average of 7.9 alleles.
The GB-FE-035 marker produced 31 alleles that were the highest number of alleles of markers and the highest PIC value was 0.93. The major allele frequencies (MAF) for the 10 polymorphic loci varied from 0.12 (GB-FE-035) to 0.97 (GB-FE-169) with an average allele frequency of 0.57. The
expected heterozygosity (HE) values ranged from 0.05 to 0.94 with an average of 0.53 and the observed heterozygosity (HO) ranged from 0.06 to 0.92 with an average of 0.42. The overall polymorphic information contents (PIC) values ranged from 0.05 to 0.93 with an average of 0.48. We could be confirmed the genetic diversity among 179 common buckwheat accessions in this study. These results are compared with that of detected in buckwheat using SSR markers by Iwata et al.(2005). Our results indicated that the average HE value was lower than that of the 19 cultivars (0.819) used by Iwata et al.(2005) in buckwheat. It is inferred that the value was relatively low in our study, because in common buckwheat analyzed genetic diversity was based on Korean indigenous resources, which were collected in Korea.
Genetic diversity and phylogenetic relationships
A neighbor-joining tree of 179 landraces accessions was constructed based on Nei’s genetic distance. The genetic distance matrix generated by PowerMarker software and
Table 3. Characterization of the 10 microsatellite loci among common buckwheat base on 179 collected germplasm accessions.
Marker MAF NA HE HO PIC
GB-FE-001 0.61 2.00 0.48 0.55 0.36
GB-FE-012 0.63 8.00 0.55 0.44 0.51
GB-FE-014 0.47 5.00 0.67 0.60 0.62
GB-FE-035 0.12 31.00 0.94 0.25 0.93
GB-FE-043 0.77 2.00 0.35 0.22 0.29
GB-FE-054 0.37 9.00 0.74 0.14 0.70
GB-FE-055 0.52 2.00 0.50 0.92 0.37
GB-FE-080 0.78 6.00 0.36 0.36 0.33
GB-FE-169 0.97 5.00 0.05 0.06 0.05
GB-FE-191 0.42 9.00 0.67 0.62 0.61
Total 5.67 79.00 5.31 4.15 4.78
Mean 0.57 7.90 0.53 0.42 0.48
MAF, major allele frequency; NA, number of alleles; HO, observed heterozygosity; HE, expected heterozygosity; PIC, polymorphic information content.
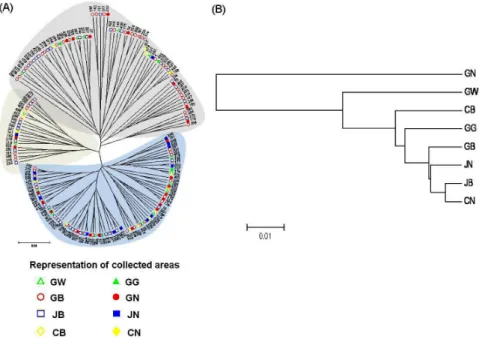
Fig. 1. Unrooted neighbor-joining trees of 179 buckwheat accessions collected from different regions in Korea based on Nei’s genetic distances among 10 SSR loci (A) and the genetic relationships among different populations in different regions (B).
used to construct an unrooted neighbor-joining tree. The dendrogram revealed a complex accession distribution pattern (Fig. 1A). DNA polymorphism detected by 10 SSR markers allowed genetic distance estimation and the UPGMA tree showed that 179 accessions of Korea buckwheat cultivars were classified in three major groups. The genetic distance among the buckwheat populations from 8 different regions was also used to construct an UPGMA tree (Fig. 1B). The
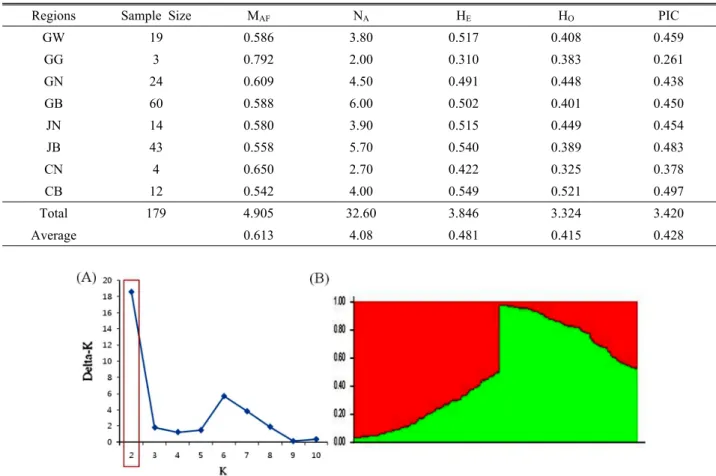
genotypic diversity of buckwheat from 8 geographical regions is compared in Table 4. The genetic diversity of buckwheat populations from 8 geographical regions was characterized by an average of 4.08 alleles, ranging from 2 in GG to 6.0 in GB province. The mean frequency of major alleles (MAF) per locus was 0.613, varying from 0.542 in CB to 0.792 in GG province. The expected heterozygosity (HE) values ranged from 0.310 (GG) to 0.549 (CB) with an average of 0.481 and
Table 4. Characterization of the 10 microsatellite loci according to 8 geographical regions in Korea.
Regions Sample Size MAF NA HE HO PIC
GW 19 0.586 3.80 0.517 0.408 0.459
GG 3 0.792 2.00 0.310 0.383 0.261
GN 24 0.609 4.50 0.491 0.448 0.438
GB 60 0.588 6.00 0.502 0.401 0.450
JN 14 0.580 3.90 0.515 0.449 0.454
JB 43 0.558 5.70 0.540 0.389 0.483
CN 4 0.650 2.70 0.422 0.325 0.378
CB 12 0.542 4.00 0.549 0.521 0.497
Total 179 4.905 32.60 3.846 3.324 3.420
Average 0.613 4.08 0.481 0.415 0.428
Fig. 2. Population structure of 179 buckwheat accessions based on 10 SSRs (K=2). (A), Estimation of the number of populations for K ranging from 1 to 10 by calculating delta K values. Delta-K analysis of LnP(D), according to Evanno et al.
(2005). (B), Model-based clustering for each of the 179 accessions examined based on the 10 SSR markers using STRUCTURE.
the observed heterozygosity (HO) ranged from 0.325 (CN) to 0.521 (CB) with an average of 0.415. The overall polymorphic information contents (PIC) values ranged from 0.261 (GG) to 0.497 (CB) with an average of 0.428.
The phylogenetic distribution of buckwheat accessions and populations from the 8 geographical regions indicated the complexity in distribution and did not clustering from the same regions. This result suggests that common buckwheat widely dispersed with small local differentiation due to strong migration pressure into new geographical regions. Similar results were reported by other studies (Cho et al., 2011;
Kump and Javornik, 1966).
Population structure
In order to check the subdivision, a model-based clustering method for multi-loci genotype data was performed to
determine the population structure and assign individuals to populations using STRUCTURE. The most probable structure number of K was calculated based on Evanno et al. (2005) using and ad hoc statistic D(K), assisted with L(K), L’(K) and L”(K). The highest value of D(K) for the 179 buckwheat accessions was K = 2 (Fig. 2A). The model-based structure analysis revealed the presence of two subpopulations (Fig.
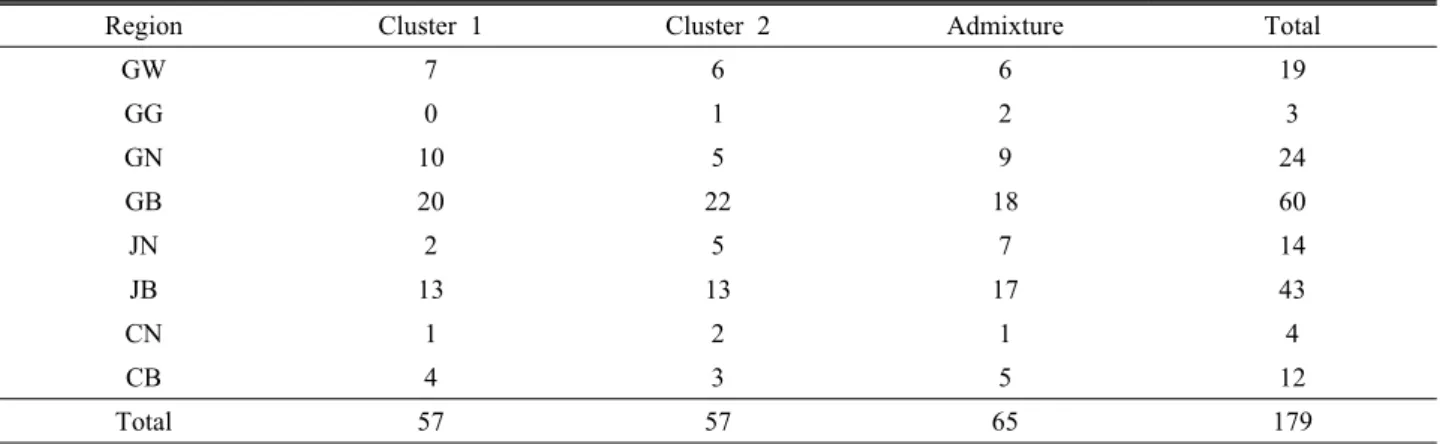
2B). As shown in Table 5, most of the 179 buckwheat accessions, 114 (63.7%) accessions were classified into one of the two genetic groups, whereas 65 (36.3%) of the entire accessions were classified as admixed forms with varying levels of membership shared among the two genetic groups (Fig. 2B and Table 5). Group 1 consisted of 57 accessions, involving 7 GW, 10 GN, 20 GB, 2 JN, 13 JB, 1 CN and 4 CB accessions. Group 2 (G2) consisted of 57 accessions, including 6 GW, 1 GG, 5 GN, 22 GB, 5 JN, 13 JB, 2 CN and 3 CB
Table 5. Distribution (inferred) of accessions from different regions to each clusters and admixture.
Region Cluster 1 Cluster 2 Admixture Total
GW 7 6 6 19
GG 0 1 2 3
GN 10 5 9 24
GB 20 22 18 60
JN 2 5 7 14
JB 13 13 17 43
CN 1 2 1 4
CB 4 3 5 12
Total 57 57 65 179
accessions. The result indicated that the 179 landrace accessions of buckwheat were not distinctly grouped according to geographic distribution.
In this study, the genetic diversity of common buckwheat accessions was studied based on microsatellite markers in order to provide useful information for conservation and utilization of buckwheat genetic resources in Korea. The genetic diversity, phylogenetic relationships and population structure of the common buckwheat landraces in Korea were analyzed by the statistics methods. The results shown that there are genotypic variations exists in common buckwheat accessions collected from 8 different regions in Korea.
However, the present study showed that UPGMA tree and the division of genetic structure do not match between the model-based genetic structure and the geographical regions.
In addition, the genotypes collected from the same geographical places did not form a single cluster or grouping. Similar observations were made by Masud et al.(1995) in pumpkin.
The average number of alleles per locus among the 179 accessions of the RDA genotyped by 10 SSR markers was 7.9, which is slightly lesser than that of the population studied by Iwata et al. (2005). Konishi et al. (2006) reported an average SSR PIC value of 0.79 among a worldwide core collection of common buckwheat accession and the PIC value obtained from our analysis were 0.48. Although common buckwheat in Korea, in this study shows moderate levels of genetic diversity, the parameters are lower than the expected from outcrossing and 8 areas in Korea. This genetic variability is highly dependent on the number of samples and on the areas from which the samples were collected. Sinha et al.
(1991) reported that selection of parents from distantly placed clusters exhibited significant high heterotic segregants and the decline of cultivated areas may be a major factor.
In conclusion, the results suggested that genetic differentiation was relatively low according to the geographic regions because of the characters of outcrossing and self-incompatibility.
Moreover, these reasons could be explained by various factors, such as migration into new geographical areas and adaptation to the climate of Korea. Murai and Ohnishi (1996) had noted a gradual decline of polymorphism with the migration from the center of origin place of the species (Yunnan or Sichchuan province). Ohnishi (1993) describes common buckwheat as a widely dispersed crop with small local differentiation.
These results, including the genotype-specific alleles, genetic diversity, and population structure information, will facilitate the use of the buckwheat germplasm for crop improvement.
Evaluations of genetic diversity of Korea landraces have played an important role in the conservation program of plant genetic resources. This diversity information based on genetic variation may contribute to the evaluation of other germplasm collections and genetic analysis of common buckwheat species to elucidate their evolutionary and phylogenetic relationships and to broaden the genetic base of modern buckwheat cultivars.
Acknowledgement
This study was carried out with the support of “Research Program for Agricultural Science & Technology Development (Code # PJ006825)” and the 2011 Post-doctoral Fellowship
Program of National Academy of Agricultural Science, Rural Development Administration, Republic of Korea.
Literature Cited
Alekseeva, E.S. 1986. Selection, cultivation and utilization of buckwheat. Proceedings of the Third International Symposium on Buckwheat, Pulawy, Poland. pp. 18-36.
Cho, Y.I., J.H. Park, C.W. Lee, W.-H. Ra, J.-W. Chung, J-R.
Lee, K.H. Ma, S.-Y. Lee, K.-S. Lee, M.-C. Lee and Y.-J.
Park. 2011. Evaluation of the genetic diversity and population structure of sesame (Sesamum indicum L.) using microsatellite marker. Genes Genom. 33:187-195.
Evanno, G., S. Regnaut and J. Goudet. 2005. Detecting the number of clusters of individuals using the software STRUCTURE: a simulation study. Mol. Ecol. 14:2611-2620.
Gao, X,-D., J.-H. Kim, C.-H. Park and S.-K. Hong. 2010.
Studies on genetic diversity of buckwheat germplasms.
Korean J. Plant Res. 23(3):214-222.
Goldstein, D.B. and C. Schlötterer. 1999. Microsatellites.
Evolution and application. Oxford University Press, New York.
Hallauer, A.R. and J.B.F. Miranda. 1988. Quantitative Genetics in Maize Breeding. 2nd ed., Iowa State University Press, Ames, USA.
Iwata, H., K. Imon, Y. Tsumura and R. Ohsawa. 2005. Genetic diversity among Japanese indigenous common buckwheat (Fagopyrum esculentum) cultivars as determined from amplified fragment length polymorphism and simple sequence repeat markers and quantitative agronomic traits.
Genome 48:367-377.
Javomik, B., B.O. Eggum and I. Kreft. 1981. Studies on protein fractions and protein quality of buckwheat. Genetika 13(2):
115-121.
Konishi, T., H. Iwata, K. Yashiro, Y. Tsumura, R. Ohsawa, Y.
Yasui and O. Ohnishi. 2006. Development and characterization of microsatellite markers for common buckwheat. Breed.
Sci. 56:277-285.
Kump, B. and B. Javornik. 1996. Evaluation of genetic variability among common buckwheat (Fagopyrum esculentum Moench) populations by RAPD markers. Plant Sci. 114:149-158.
Litt, M. and J.A. Luty. 1989. A hypervariable microsatellite revealed by in vitro amplification of a dinucleotide repeat within the cardiac muscle actin gene. American J. Hum.
Genet. 44:397-401.
Liu, K. and S.V. Muse. 2005. Power Marker: an integrated analysis environment for genetic marker analysis. Bioinformatics 21:2128-2129.
Li, X., W. Yan, H. Agrama, B. Hu, L. Jia, M. Jia, A. Jackson, K.
Moldenhauer, A. McClung and D. Wu. 2010. Genotypic and phenotypic characterization of genetic differentiation and diversity in the USDA rice mini-core collection. Genetica 138:1221-1230.
Ma, K.H., N.S. Kim, G.-A. Lee, S.-Y. Lee, J.K. Lee, J.Y. Yi, Y.-J. Park, T.-S. Kim, J.-G. Gwag and S.-J. Kwon. 2009.
Development of SSR markers for studies of diversity in the genus Fagopyrum. Theor. Appl. Genet. 119:1247-1254.
Masud, M.A.T., M.A. Chowdhury, M.A. Hossain and S.M.M.
Hossain. 1995. Multivariate analysis of pumpkin. Bangladesh J. Plant Breed. Genet. 8(1):45-50.
Murai, M. and O. Ohnishi. 1996. Population genetics of cultivated common buckwheat, Fagopyrum esculentum Moench. X. DiVusion routes revealed by RAPD markers.
Genes Genet. Syst. 71:211-218.
Nei, M. and N. Takezaki. 1983. Estimation of genetic distances and phylogenetic trees from DNA analysis. Proc. 5th World Cong. Genet Appl Livstock Prod. 21:405-412.
Ohnishi, O. 1993. Population genetics of cultivated common buckwheat, Fagopyrum esculentwn Moench, VIII. Local differentiation of land races in Europe and the silk road.
Japanese J. Genet. 68:317-326.
Ohnishi, O. 1998. Search for the wild ancestor of buckwheat III. The wild ancestor of cultivated common buckwheat, and of tatary buckwheat. Econ. Bot. 52:123-133.
Park, M.-H., D.-H. Shin, M.-H. Han, Y.-H. Yun, J.-S. Bae, Y.-S. Lee, K.-Y. Chung, M.-S. Lee and S.-H. Woo. 2009.
Proteomic approach of the protein profiles during seed maturation in common buckwheat (Fagopyrum esculentum Moench.). Korean J. Plant Res. 22(3):227-235.
Pritchard, J.K., X. Wen and D. Falush. 2007 Documentation for structure software: Version 2.2. Department of Human Genetics, University of Chicago; Department of Statistics, University of Oxford. Available at http://pritch.bsd.uchicago.
edu/software
Schuelke, M. 2000. An economic method for the fluorescent labelling of PCR fragments. Nat. Biotechnol. 18:233-234.
Sharma, K.D. and J.D. Boyes. 1961. Modified incompatibility of common buckwheat following irradiation. Canadian J.
Bot. 39:1241-1246.
Sinha, P.K., V.S. Chauhan, K. Prasad and J.S. Chauhan. 1991.
Genetic divergence in indigenous upland rice varieties.
Indian J. Genet. Plant Br. 51(1):47-50.
Smith, J.S.C., D.S. Ertl and B.A. Orman. 1995. Identification of maize varieties. In Wrigley, C.W. (ed.), Identification of Food Grain Varieties, American Assoc. Cereal Chemists, St.
Paul, USA. pp. 253-264.
Tamura, K., J. Dudley, M. Nei and S. Kumar. 2007. MEGA4:
molecular evolutionary genetics analysis (MEGA) software version 4.0. Mol. Biol. Evol. 24:1596-1599.
Tautz, D. 1989. Hypervariability of simple sequences as general source for polymorphic DNA markers. Nucleic Acids Res.
17:6463-6471.
Thuillet, A.-C., T. Bataillon, S. Poirier, S. Santoni and J.L.
David. 2005. Estimation of long-term effective population sizes through the history of durum wheat using microsatellite data. Genetics 169:1589-1599.
Vigouroux, Y., S. Mitchell, Y. Matsuoka, M. Hamblin, S.
Kresovich, J. Stephen, C. Smith, J. Jaqueth, O.S. Smith and J. Doebley. 2005. An analysis of genetic diversity across the maize genome using microsatellites. Genetics 169:1617-1630.
Vos, P., R. Horgers, M. Bleeker, M. Reijans, T. Van de Lee, M. Hornes, A. Frijters, J. Pot, J. Peleman, M. Kuper and M. Zabeau. 1995. AFLP: a new technique for DNA fingerprinting. Nucleic Acids Res. 23:4407-4414.
(Received 19 August 2011 ; Revised 22 November 2011 ; Accepted 2 December 2011)