Research Article Open Access
230
Evaluation of Genetic Structure of Amaranth Accessions from the United States
Qiang He1 and Yong-Jin Park*1,2
1Department of Plant Resources, College of Industrial Sciences, Kongju National University, Yesan 340-702, Republic of Korea
2Legume Bio-Resource Center of Green Manure (LBRCGM), Kongju National University, Yesan 340-702, Republic of Korea
(Received on September 10, 2013; Revised on September 12, 2013; Accepted on September 13, 2013)
ABSTRACT. Amaranths (Amaranthus sp.), an endemic American crop, are now grown widely across the world.
This study used 14 simple sequence repeat (SSR) markers to analyze the genetic diversity of 74 amaranth accessions from the United States, with eight accessions from Australia as controls. One hundred twenty-two alleles, averaging eight alleles per locus, were observed. The average major allele frequency, expected heterozygosity, and polymorphism information content (PIC) were 0.44, 0.69, and 0.65, respectively. The structure analysis based on genetic distance classified 77 accessions (94%) into three clusters, while five accessions (6%) were admixtures. Among the three clusters, Cluster 3 had the highest allele number and PIC values, while Cluster 2 had the lowest. The lowest FST was between Clusters 1 and 3, indicating that these two clusters have higher gene flow between them compared to the others. This finding was reasonable because Cluster 2 included most of the Australian accessions. These results indicated satisfactory genetic diversity among U.S. amaranths. These findings can be used to design effective breeding programs involving different plant characteristics.
Key words: Amaranths (Amaranthus sp.), Genetic Diversity, Population Structure, SSR
Introduction
Amaranths (Amaranthus sp.) belongs to the family of Amaranthaceae, which is originated in Americas and Europe. Dated backed to Mayan civilization of South and Central America, amaranth has been cultivated for more than 8,000 years. An estimated 87 accessions belonged to the genus Amaranthus, 40 of which are considered to be native America species, including cultivated grains, vegetable crops, and wild species (Chan and Sun, 1997;
Mujica and Jacobsen, 2003). As a major country, the United States possessed a huge area at American continent, and had a diverse set of amaranth, as one of the places where amaranths originated (Wetzel et al., 1999). It will be of great significance to analyze the amaranths genetic group structure of this region.
Analyses of genetic diversity and population structure are important, not just for amaranths, but for many crops, and such studies have direct benefits in research on evolution and plant breeding (Chung and Park, 2010). Many molecular markers have been used to analyze diversity, such as restriction fragment length polymorphisms (RFLPs),
amplified fragment length polymorphisms (AFLPs), simple sequence repeats (SSRs), and single nucleotide polymorphisms (SNPs; Bao et al., 2006; Cheng et al., 2011; Feltus et al., 2004;
Jin et al., 2010; Li et al., 2012; Liang et al., 1994; Nagaraju et al., 2002; Zhao et al., 2009). Different marker systems have been used to investigate genetic diversity (Tam et al., 2005), and random amplified polymorphic DNA (RAPD) markers and SSRs have been applied to study the genetic diversity and phylogenetic relationships among Amaranthus species (Khaing et al., 2013; Lee et al., 2008; Wassom and Tranel, 2005; Xu and Sun, 2001).
Amaranths have superior nutrition, drought tolerance, disease and pest resistance, and production yield, making these native Americian crops more attractive for cultivation in developing countries and increasing their rate of consumption in recent years (Ray and Roy, 2009). Varying amounts of outcrossing and frequent interspecific and intervarietal hybridization of amaranths have resulted in a large variety of amaranth genotypes (Ray and Roy, 2009).
Due to their complex genetic background, amaranths show tremendous adaptability to different ecogeographic situations (Lee et al., 2008). and have evolved many characteristics adapted to different environments, such as cold, drought, and salinity resistance.
Understanding the genetic diversity and polymorphism of Amaranthus is important. In particular, a detailed SSR
*Corresponding author:
Phone) +82-41-330-1201, Fax) +82-41-330-1209 E-mail) [email protected]
analysis of the genetic diversity and population structure of U.S. amaranth accessions would make a significant contribu- tion, as the United States has played a major role in the development of amaranths (Ray and Roy, 2009). Therefore, we used a model-based structure analysis to elucidate the genetic diversity and structure of U.S. amaranth germplasm.
Materials and Methods
Plant materials
Eighty two accessions belonging to 29 species were genotyped using 14 SSRs (Table 1). All plant materials including 74 accessions from the U.S. and 8 accessions from Australia were obtained from the National Genebank of the Rural Development Administration, Republic of Korea (RDA-Genebank).
SSR genotyping
Total DNA was extracted from all accessions using a DNA extraction kit (Qiagen, Seoul, Republic of Korea).
Fourteen polymorphic SSR markers developed by Lee et al.
(2008) were used in this study. The M13-tail polymerase chain reaction (PCR) method (Schuelke, 2000) was used to measure the size of the PCR products, as described previously(Lee et al., 2008). Using GeneScan 3.7 (Applied Biosystems, Foster City, CA, USA ), the SSR alleles were resolved on an ABI Prism 3100 DNA sequencer (Applied Biosystems) and sized precisely using GeneScan 500 ROX (6-carbon-X-rhodamine) molecular size standards (35–500 bp; Applied Biosystems).
Data analysis
The data were analyzed statistically using the PowerMarker V3.23 genetic analysis package (Liu and Muse, 2005) to measure the diversity at each microsatellite locus, including the total number of alleles (NA), allele frequency, major allele (allele with the highest frequency), accession-specific alleles, and polymorphism information content (PIC).
Genetic distances between each pair of accessions were determined by calculating the shared allele frequencies using PowerMarker V3.23. The unweighted pair group method with arithmetic mean (UPGMA) tree and neighbor joining method (NJ) were constructed from the shared allele frequencies using MEGA 4.0 embedded in PowerMarker.
Population structure and the identification of admixed individuals were determined using the Structure model- based software program (Pritchard et al., 2000). In this model, a number of populations (K) are assumed to be present with each population characterized by a set of allele frequencies at each locus. Individuals in the sample are then assigned to populations (clusters), or jointly to more populations if their genotypes indicate that they are admixed.
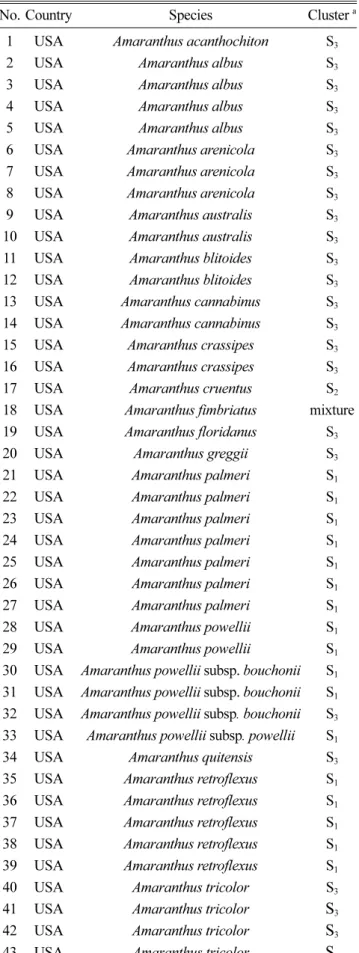
Table 1. The 82 amaranth accessions used in this study
No. Country Species Cluster a
1 USA Amaranthus acanthochiton S3
2 USA Amaranthus albus S3
3 USA Amaranthus albus S3
4 USA Amaranthus albus S3
5 USA Amaranthus albus S3
6 USA Amaranthus arenicola S3
7 USA Amaranthus arenicola S3
8 USA Amaranthus arenicola S3
9 USA Amaranthus australis S3
10 USA Amaranthus australis S3
11 USA Amaranthus blitoides S3
12 USA Amaranthus blitoides S3
13 USA Amaranthus cannabinus S3
14 USA Amaranthus cannabinus S3
15 USA Amaranthus crassipes S3
16 USA Amaranthus crassipes S3
17 USA Amaranthus cruentus S2
18 USA Amaranthus fimbriatus mixture
19 USA Amaranthus floridanus S3
20 USA Amaranthus greggii S3
21 USA Amaranthus palmeri S1
22 USA Amaranthus palmeri S1
23 USA Amaranthus palmeri S1
24 USA Amaranthus palmeri S1
25 USA Amaranthus palmeri S1
26 USA Amaranthus palmeri S1
27 USA Amaranthus palmeri S1
28 USA Amaranthus powellii S1
29 USA Amaranthus powellii S1
30 USA Amaranthus powellii subsp. bouchonii S1 31 USA Amaranthus powellii subsp. bouchonii S1
32 USA Amaranthus powellii subsp. bouchonii S3
33 USA Amaranthus powellii subsp. powellii S1
34 USA Amaranthus quitensis S3
35 USA Amaranthus retroflexus S1
36 USA Amaranthus retroflexus S1
37 USA Amaranthus retroflexus S1
38 USA Amaranthus retroflexus S1
39 USA Amaranthus retroflexus S1
40 USA Amaranthus tricolor S3
41 USA Amaranthus tricolor S3
42 USA Amaranthus tricolor S3
43 USA Amaranthus tricolor S3
All loci are assumed to be independent, and each K population is assumed to follow Hardy–Weinberg equilibrium. The posterior probabilities were estimated using the Markov chain
Monte Carlo (MCMC) method. The MCMC chains were run with a 100,000-iteration burn-in period followed by 200,000 iterations using a model allowing for admixture and correlated allele frequencies. At least three runs of Structure were performed, setting K from 1 to 10, and an average likelihood value, L(K), across all runs was calculated for each K. The model choice criterion that detected the most probable value of K was ∆K, which is an ad hoc quantity related to the second-order change of the log probability of data with respect to the number of clusters inferred by Structure (Evanno et al., 2005). An individual with more than 80% of its genome fraction value was assigned to a group.
The value of FST was calculated using an analysis of molecular variance (AMOVA) approach in Arlequin 3.11 (Excoffier et al., 2005; Schneider and Excoffier, 1999).
Results and Discussion
SSR polmorphisms
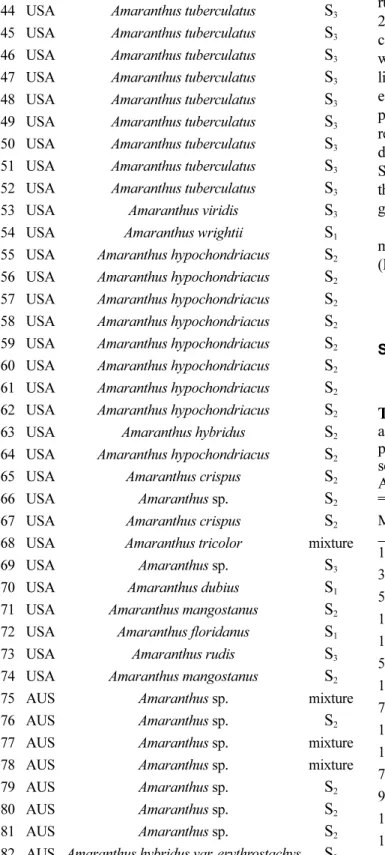
In total, 122 alleles were observed among the 82 amaranth Table 1. The 82 amaranth accessions used in this study (continued)
44 USA Amaranthus tuberculatus S3
45 USA Amaranthus tuberculatus S3
46 USA Amaranthus tuberculatus S3
47 USA Amaranthus tuberculatus S3
48 USA Amaranthus tuberculatus S3
49 USA Amaranthus tuberculatus S3
50 USA Amaranthus tuberculatus S3
51 USA Amaranthus tuberculatus S3
52 USA Amaranthus tuberculatus S3
53 USA Amaranthus viridis S3
54 USA Amaranthus wrightii S1
55 USA Amaranthus hypochondriacus S2
56 USA Amaranthus hypochondriacus S2
57 USA Amaranthus hypochondriacus S2
58 USA Amaranthus hypochondriacus S2
59 USA Amaranthus hypochondriacus S2
60 USA Amaranthus hypochondriacus S2
61 USA Amaranthus hypochondriacus S2
62 USA Amaranthus hypochondriacus S2
63 USA Amaranthus hybridus S2
64 USA Amaranthus hypochondriacus S2
65 USA Amaranthus crispus S2
66 USA Amaranthus sp. S2
67 USA Amaranthus crispus S2
68 USA Amaranthus tricolor mixture
69 USA Amaranthus sp. S3
70 USA Amaranthus dubius S1
71 USA Amaranthus mangostanus S2
72 USA Amaranthus floridanus S1
73 USA Amaranthus rudis S3
74 USA Amaranthus mangostanus S2
75 AUS Amaranthus sp. mixture
76 AUS Amaranthus sp. S2
77 AUS Amaranthus sp. mixture
78 AUS Amaranthus sp. mixture
79 AUS Amaranthus sp. S2
80 AUS Amaranthus sp. S2
81 AUS Amaranthus sp. S2
82 AUS Amaranthus hybridus var. erythrostachys S2 a Clusters based on structure result
Table 2. Size range, number of alleles, number of rare alleles, major allele frequency, expected heterozygosity, and polymorphism information content index for 14 simple sequence repeat loci in 82 accessions, including eight Australian accessions.
Marker Size
range NAa Rare
alleles MAFb HEc PICd
13F 162-175 5 1 0.62 0.57 0.53
32N 161-176 6 3 0.59 0.61 0.53
51F 133-290 5 2 0.44 0.68 0.59
123F 143-245 9 6 0.43 0.71 0.64
104H 149-247 14 8 0.31 0.86 0.81
57N 130-356 6 3 0.56 0.68 0.58
129H 113-266 11 4 0.20 0.87 0.86
71N 117-181 5 3 0.62 0.49 0.42
132F 114-180 18 13 0.29 0.85 0.83
137H 212-242 11 5 0.26 0.84 0.80
78N 115-171 4 3 0.93 0.11 0.14
99N 103-182 14 7 0.16 0.90 0.89
105N 124-172 7 3 0.36 0.77 0.71
136N 204-225 7 2 0.38 0.79 0.73
Total 122 63 6.15 9.72 9.07
Mean 8 4 0.44 0.69 0.65
a Number of alleles.
b Major allele frequency.
c Expected heterozygosity.
d Polymorphic information content.
accessions at 14 SSR loci, ranging from 4 (78N) to 14 (104H and 99N) alleles per accession, with an average of eight alleles per locus. The database of allele frequencies showed that rare alleles (frequency < 0.05) comprised 51.6%
of all detected alleles, whereas intermediate (frequency 0.05–
0.50) and abundant (frequency > 0.50) alleles comprised 44.3% and 4.1%, respectively (Table 2, Fig. 1). The average major allele frequency was 0.44, ranging from 0.16 in 99N to 0.93 in 78N, and the expected heterozygosity was 0.69, ranging from 0.11 in 78N to 0.90 in 99N. The average PIC was 0.65, which indicated that the 14 SSR markers exhibit good polymorphism across the accessions (Table 2).
Genetic diversity and population structure analysis Previously, Pritchard et al. (2000) used a model-based method to analyze the population structure and identify admixed individuals. Unfortunately, the estimated likelihood values do not indicate the exact value of K using this model (Fig. 2). Therefore, an ad hoc quantity (∆K) was used to overcome the difficulty interpreting real K values (Evanno et al., 2005). Using this approach, an identifiable peak indicated the true value of K based on ∆K. For the 82 accessions, the highest value of ∆K was K = 3 (Fig. 2);
therefore, we used K = 3 for the final analysis. When alpha is near zero, most individuals are essentially from one population. Conversely, when alpha is greater than 1, most
individuals are admixed (Evanno et al., 2005; Ostrowski et al., 2006). The relatively small value of alpha (α = 0.0345) indicated that most accessions originated from one primary ancestor (Ostrowski et al., 2006).
The genetic diversity analysis of the 82 amaranth accessions indicated an average of 8.64 alleles in accessions from the United States and 2.64 for Australia, with an overall average of 5.64. The major allele in the Australian accessions was more frequent than in U.S. accessions, while the opposite was true for the PIC.
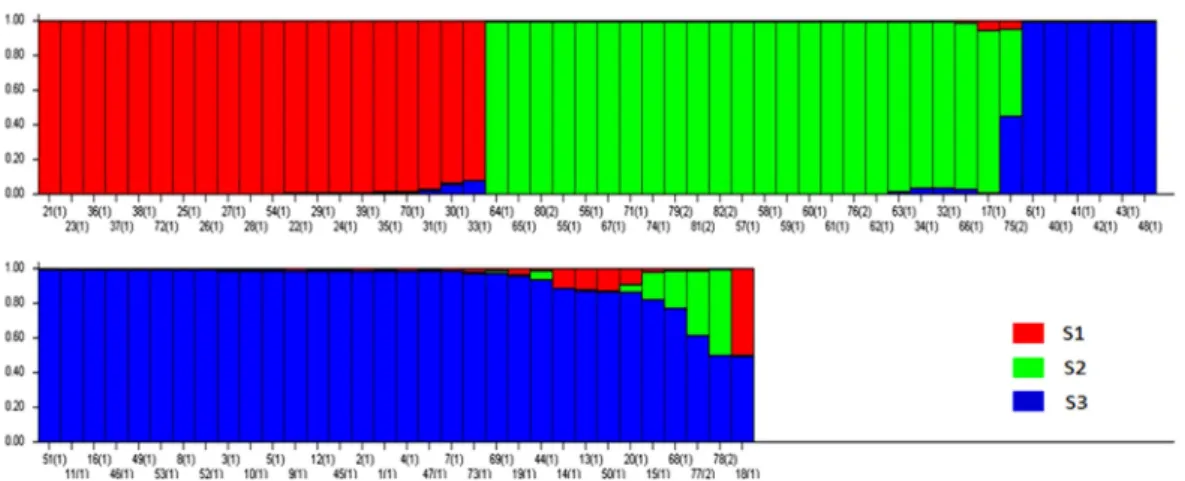
Based on the structure results, most of the 82 accessions were clearly classified into three subpopulations. Clusters 1–
3 included 20, 23, and 34 accessions, respectively. Only five accessions were admixtures: three from Australia and two from the United States. Of the three subpopulations, Cluster 3 has the highest allele numbers and PIC values, while Cluster 2 had the lowest. The FST was 0.4221, 0.2209, and 0.4274 between Clusters 1 and 2, Clusters 1 and 3, and Clusters 2 and 3, respectively (Table 4).
A genetic distance-based analysis was performed by calculating the shared allele frequencies among the 82 accessions. An unrooted phylogram was computed using MEGA 4 (Tamura et al., 2007) embedded in the PowerMarker program (Liu and Muse, 2005). The NJ tree clustered all accessions into three main groups with a few exceptions. As shown in Fig. 4, 82 amaranth accessions were distributed among the three groups which were consistent with the results of structure. Admixtures were marked with black color. Most of the accessions from the same species were clustered into the same group.
Generally, a narrow genetic base and low genetic diversity are detrimental to a breeding program (Wolfe, 1985).
Although only 74 accessions from the United States were evaluated in this study, 122 alleles were detected and the PIC was high. Therefore, we concluded that the United States, which is near the center of origin of Amaranthus, exhibits rich genetic polymorphism and this finding will be used to design effective breeding programs involving different plant characteristics aimed to meet societal demands.
Fig. 1. Histogram of allele frequencies for all 122 alleles in the 82 amaranth accessions.
Fig. 2. Determination of K value in Structure analysis. Red line are log-likelihood of the data (n=82), L(K), as a function of K (number of groups used to stratify the sample). Blue line are values of ∆K, which is model value used to detect true K of the three groups (k=3).
Table 3. Characterization of polymorphism for each country.
Region Sample size NAa MAFb PICc
USA 74 8.64 0.42 0.66
AUS 8 2.64 0.64 0.39
Total 82 11.29 1.07 1.04
Average 5.64 0.53 0.52
a Number of alleles.
b Major allele frequency.
C Polymorphic information content.
Acknowledgments
This work was supported by a grant from the BioGreen 21 Program (No. PJ009099), Rural Development Administra- tion, Republic of Korea.
References
Bao, J.S., Corke, H. and Sun, M. 2006. Analysis of genetic diver- sity and relationship in waxy rice (Oryza sativa L.) using AFLP and ISSR marker. Genet. Resour. Crop Ev. 53: 323-330.
Chan, K.F. and Sun, M.1997. Genetic diversity and relationships detected by isozyme and RAPD analysis of crop and wild spe- cies of Amaranthus. Theor. Appl. Genet. 95:865-873
Cheng, Y., Kim, C.H., Shin, D.I., Kim, S.M., et al. 2011. Develop- ment of simple sequence repeat (SSR) markers to study diver- sity in the herbaceous peony (Paeonia lactiflora). J. Med.
Plants Res. 5: 6744-6751.
Chung, J.W. and Park, Y.J. 2010. Population structure analysis reveals the maintenance of isolated sub-populations of weedy rice. Weed Res. 50(6): 606-620.
Costea, M., Weaver, S.E. and Tardif, F.J. 2004. The biology of Table 4. The diversity information and FST value of the three cluster.
Inferred cluster Diversity FST
Sample size NAa MAFb PIC 1 2 3 Overall
1 20 4.07 0.56 0.48 0
2 23 2.64 0.76 0.27 0.4221 0
3 34 5.79 0.56 0.55 0.2209 0.4274 0 0.3568
Average 4.17 0.62 0.44
a Number of alleles.
b Major allele frequency.
C Polymorphic information content.
Fig. 3. Model-based clustering for each of the 82 amaranth accessions examined based on the 14 SSR markers used to build the Q matrix.
Fig. 4. NJ dendrogram based on a genetic distance matrix among 82 amaranth accessions. The branch colors correspond to the model-based clusters revealed by Structure analysis.
Different shapes reflect different countries.
Canadian weeds. 130. Amaranthus retroflexus L., A. powellii S.
Watson and A. hybridus L. Can. J. Plant Sci. 84(2): 631-668 Evanno, G., Regnaut, S. and Goudet, J. 2005. Detecting the num-
ber of clusters of individuals using the software structure: a simulation study. Mol. Ecol. 14(8): 2611-2620.
Excoffier, L., Laval, G. and Schneider, S. 2005. Arlequin (version 3.0): an integrated software package for population genetics data analysis. Evol. Bioinform. 1: p.47.
Feltus, F.A., Wan, J., Schulze, S.R., Estill, J.C., et al. 2004. An SNP resource for rice genetics and breeding based on subspe- cies indica and japonica genome alignments. Genome Res.
14(9): 812-1819.
Jin, L., Lu, Y., Xiao, P., Sun, M., Corke, H., et al. 2010. Genetic diversity and population structure of a diverse set of rice germ- plasm for association mapping. Theor Appl Genet. 121(3):475- 487.
Khaing, A.A., Moe, K.T., Chung, J.W., Baek, H.J., et al. 2013.
Genetic diversity and population structure of the selected core set in Amaranthus using SSR markers. Plant Breeding. 132(2):
165-173.
Lee, J.R., Hong, G.Y., Dixit, A., Chung, J.W., et al. 2008. Charac- terization of microsatellite loci developed for Amaranthus hypochondriacus and their cross-amplification in wild species.
Conserv. Genet. 9(1):243-246.
Li, G., Kwon, S.W. and Park, Y.J. 2012. Updates and perspectives on the utilization of molecular makers of complex traits in rice.
Genet. Mol. Res. 11(4):4157-4168.
Liang, C.Z., Gu, M.H., Pan, X.B., Liang, G.H., et al. 1994. RFLP tagging of a new semidwarfing gene in rice. Theor. Appl.
Genet. 88(6):898-900.
Liu, K. and Muse, S.V. 2005. PowerMarker: an integrated analysis environment for genetic marker analysis. Bioinformatics 21(9):2128-2129.
Mujica, A. and Jacobsen, S.E. 2003. The genetic resources of Andean grain amaranths (Amaranthus caudatus L., A. cruentus L. and A. hypochondriacus L.) in America. Plant Genet.
Resour. Newsl. 133:41-44.
Nagaraju, J., Kathirvel, M., Kumar, R.R., Siddiq, E. and Hasnain, S.E. 2002. Genetic analysis of traditional and evolved Basmati and non-Basmati rice varieties by using fluorescence-based ISSR-PCR and SSR markers. P. Natl. Acad. Sci. USA.
99(9):5836-5841.
Ostrowski, M.F., David J., Santoni, S., Mckhann, H., et al. 2006.
Evidence for a large-scale population structure among acces- sions of Arabidopsis thaliana: possible causes and conse- quences for the distribution of linkage disequilibrium. Mol.
Ecol. 15(6):1507-1517.
Pritchard, J.K., Stephens, M. and Falush, D. 2000. Inference of Population Structure Using Multilocus Genotype Data: Linked Loci and Correlated Allele Frequencies. Genetics 155(2):945- 959.
Ray, T. and Roy, S.C. 2009. Genetic diversity of Amaranthus spe- cies from the Indo-Gangetic Plains revealed by RAPD analysis leading to the development of ecotype-specific SCAR marker.
J Hered. 100 (3):338-347.
Sauer, J.D. 1967. The grain amaranths and their relatives: a revised taxonomic and geographic survey. Ann. Missouri. Bot. Gard.
54(2):103-137.
Schneider, S. and Excoffier, L. 1999. Estimation of past demo- graphic parameters from the distribution of pairwise differ- ences when the mutation rates vary among Sites: Application to human mitochondrial DNA. Genetics 152(3):1079-1089.
Schuelke, M. 2000. An economic method for the fluorescent label- ing of PCR products. Nat. Biotechnol. 18(2):233-234.
Tam, S.M., Mhiri, C., Vogelaar, A., Kerkveld, M., Pearce, S.R., et al. 2005. Comparative analyses of genetic diversities within tomato and pepper collections detected by retrotransposon- based SSAP, AFLP and SSR. Theor. Appl. Genet. 110(5): 819- 831.
Tamura, K., Dudley, J., Nei, M. and Kumar, S. 2007.MEGA4:
Molecular evolutionary genetics analysis (MEGA) software version4.0. Mol. Biol. Evol. 24(8):1596-1599.
Wassom, J.J. and Tranel, P.J. 2005. Amplified fragment length polymorphism based genetic relationships among weedy ama- ranthus species. J. Hered. 96(4):410-416.
Wetzel, D., Michael, K., Horak, J. and Skinner, D.J. 1999. Use of PCR-based molecular markers to identify weedy amaranthus species. Weed Science. 7:518-523.
Wolfe, M. S. 1985. The Current status and prospects of multiline cultivars and variety mixtures for disease resistance. Annu.
Rev. Phytopathol. 23(1): 251-273.
Xu, F. and Sun, M. 2001. Comparative analysis of phylogenetic relationships of grain amaranths and their wild relatives (Ama- ranthus; Amaranthaceae) using internal transcribed spacer, amplified fragment length polymorphism, and double-primer fluorescent intersimple sequence repeat markers. Mol. Phylo- genet. Evol. 21(3):372-387.
Zhao, W., Chung, J.W., Ma, K.H., Kim, T.S., et al. 2009. Analysis of genetic diversity and population structure of rice cultivars from Korea, China and Japan using SSR markers. Genes Genom. 31(4): 283-292.