EST-SSR Based Genetic Diversity and Population Structure among Korean Landraces of Foxtail Millet ( Setaria italica L.)
Asjad Ali, Yu-Mi Choi, Do Yoon-Hyun, Sukyeung Lee, Sejong Oh, Hong-Jae Park, Yang-Hee Cho and Myung Chul Lee*
National Agrobiodiversity Center, National Institute of Agricultural Sciences, RDA, Jeonju-si 54874, Korea
Abstract - Understanding the genetic variation among landrace collections is important for crop improvement and utilization of valuable genetic resources. The present study was carried out to analyse the genetic diversity and associated population structure of 621 foxtail millet accessions of Korean landraces using 22 EST-SSR markers. A total of 121 alleles were detected from all accessions with an average of 5.5 alleles per microsatellite locus. The average values of gene diversity, polymorphism information content, and expected heterozygosity were 0.518, 0.594, and 0.034, respectively.
Following the unweighted neighbor-joining method with arithmetic mean based clustering using binary data of polymorphic markers, the genotypes were grouped into 3 clusters, and population structure analysis also separated into 3 populations. Principal coordinate analysis (PCoA) explained a variation of 13.88% and 10.99% by first and second coordinates, respectively. However, in PCoA analysis, clear population-level clusters could not be found. This pattern of distribution might be the result of gene flow via germplasm exchanges in nearby regions. The results indicate that these Korean landraces of foxtail millet exhibit a moderate level of diversity. This study demonstrated that molecular marker strategies could contribute to a better understanding of the genetic structure in foxtail millet germplasm, and provides potentially useful information for developing conservation and breeding strategies.
Key words -Foxtail millet, Genetic diversity, Population structure, EST-SSR marker
*Corresponding author. E-mail : [email protected] Tel. +82-63-238-4900
ⓒ 2016 by The Plant Resources Society of Korea
Introduction
Foxtail millet [Setaria italica (L.) P. Beauv.] is one of the world’s oldest cultivated cereal crops. The geographical origin and domestication process of foxtail millet [Setaria italica (L.) P. Beauv.] have been studied by several groups (de Wet et al., 1979; Jusuf and Pernes, 1985; Benabdelmouna et al., 2001; Li et al., 1995, 1998) based on archaeological, morphological or molecular evidences, after Vavilov (1926) suggested that the primary center of diversity of foxtail millet is East Asia. Furthermore, based on the cytological evidences along with random amplified polymorphic DNA (RAPD) and amplified fragment length polymorphism (AFLP) and other markers, population genetics of green foxtail (Setaria viridis L.), as an ancestor of domesticated foxtail millet, also studied to trace the demographic history (Fukunaga et al., 1997;
2002), but geographical origin of domestication remains a
controversial issue due to the wide distribution of this wild species throughout Europe and Asia (Wang et al., 1995; Le Thierry d’Ennenquin et al., 2000). Foxtail millet has abundant within species diversity, and germplasm accessions were classified into three races based on the comparative morphology, such as Moharia, Maxima and Indica. Maxima race is common in China, Japan, Korea, Nepal and northern India (Prasada Rao et al.1987). Later on, the grouping of different subrace of foxtail millet was also reported on the basis of isoenzyme analysis to landraces of China, Korea, and Japan (Jusuf and Pernes, 1985).
Foxtail millet has commonly used as a cereal crop in Korea from ancient times, and many kinds of landraces have been cultivated until recently. Landraces are considered as very diverse within the species because each has adapted to their specific local environment (Camacho Villa et al., 2005). It is sometimes still important to improve the productivity and the quality as a prerequisite for the genetic improvement of its cultivars, because of their comparable levels of diversity.
Original Research Article
Table 1. Details of 621 accessions of foxtail millet acquired from National Agrobiodiversity Center (NIAS, RDA, Republic of Korea)
Origin Abbreviation Number of
accessions Origin Abbreviation Number of
accessions
Jeolla-do JLD 61 Jeju-do JJD 32
Chungchong-do CCD 52 Commercial variety CVR 2
Gyeonggi-do GGD 58 Reintroduced germplasm RID 36
Gyeongsang-do GSD 142 Unknownz UKN 24
Gangwon-do GWD 214
zUnknown: unknown origin of accessions in Korea.
According to Deb (2009), collection and maintaining landraces diversity can ensure agricultural sustainability and food security. Knowledge of the genetic diversity and the population structure of germplasm collections is an important foundation to understand the genetic relationship, diversity, and population structure among cultivated species (Reddy et al., 2014).
Many different types of markers such as isozyme (Jusuf and Pernes, 1985), restriction fragment length polymorphism (RFLP) (Fukunaga et al., 2011), RAPD (Schontz and Reather, 1999), AFLP (Kim et al., 2011), and simple sequence repeat (SSR) markers (Jia et al., 2009) have been used to study the genetic diversity of foxtail millet species. Similarly, Hirano et al. (2011) employed transposons to determine the correlation between geographical area and genetic structure. However, these genetic markers represent limited information regarding genomic polymorphism (Wright and Gaut, 2005). Among various developed markers, expressed sequence tag (EST) derived SSR markers (Jia et al., 2007; Kumari et al., 2013) could be an excellent source for foxtail millet diversity analysis. As EST-SSRs target the transcribed region of the genome, their potential for linkage to loci that contribute to important agronomical traits. Thus the presence of EST-SSRs exhibit substantial efficacy in breeding lines for marker assisted selection (Varshney et al., 2005).
Recently, foxtail millet consumption is slowly increased due to health benefits and the short growing season of this crop makes it suitable for the farming conditions of the semi-arid climate in Korea. However, knowledge on the level of genetic diversity and linkage disequilibrium (LD) is very limited on Korean landraces of foxtail millet. Therefore, this study was carried out to investigate the genetic diversity,
relationship, and population structure, among 621 Korean landraces using EST-SSR markers delivered from foxtail millet.
Materials and Methods
Plant material and DNA extraction
A total of 621 foxtail millet accessions, covering the major traditional geographical distribution of Korea were used in this study (Table 1). All landraces of foxtail millet were obtained from the National Agrobiodiversity Center (NAAS, RDA, Korea). Especially, 36 accessions of reintroduced germplasm that were collected in Korea in1945 were from GenBank of Japan. All seeds were germinated and grown in the greenhouse. Fresh leaves from 15 day old seedlings were used for DNA extraction. Genomic DNA was extracted according to the Qiagen DNeasy Plant Mini Kit protocol (QIAGEN, Germany). The concentration of DNA was estimated using NanoDrop ND-1000 (NanoDrop Technologies Inc., USA) and final adjustment was made at 20 ng/µl.
EST-SSR analysis
A total of 66,027 EST sequences of foxtail millet (Setaria italica (L.) P. Beauv.) were downloaded from the NCBI nucleotide database (http://www.ncbi.nlm.nih.gov/nucleotide) on November 21, 2014. Those ESTs were assembled into unigenes using SeqMan DNA Star lasergene version 7.1 (DNASTAR Inc, Madison, WI) and the parameters for clustering were set at a minimum of 98% identity in 30-bp overlap. The unigenes were used for identifying the microsatellites primer pairs via simple sequence repeat identification tool (SSRIT)
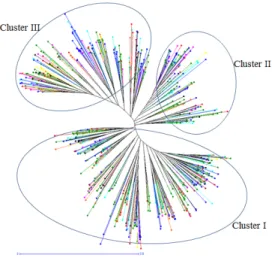
Fig. 1. Unweighted neighbor-joining dendrogram showing the genetic relationships among six hundred and twenty-one accessions of foxtail millet collected from different regions of Korea. Each color represents the regional identity of the landrace.
software (http://www.gramene.org/gramene/searches/ssrtool) and SSR locator V.1 software (da Maia et al. 2008). In total, 324 primer pairs of foxtail millet EST-SSRs were used to conduct the PCR amplification and twenty-two EST-SSRs were selected on the basis of good polymorphism and high polymorphic information content (PIC). EST-SSR amplifications were performed by polymerase chain reaction (PCR) in a total reaction volume of 20 ㎕. It contained 50 ng of genomic DNA, 2 ㎕ of each EST-SSR primer (10 pmol), 4 ㎕ of 5x Green GoTaq reaction buffer (Promega Co, USA), 1 U of Taq DNA polymerase (Promega Co, USA), 1.6 ㎕ of dNTP (2.5 mM), and 11 ㎕ nuclease free water. All the amplifications were performed in PTC-100 thermal controller (MJ Research Watertown, MA, USA). The PCR program included initial denaturation of 3 min at 94℃, followed by 35 cycles of 45 sec at 50-55℃ and 45 sec at 72℃, and a final extension of 10 min at 72℃. PCR products were confirmed at 2% agarose gel and separated on a Fragment Analyzer Automated CE System (Advanced Analytical Technologies [AATI], Ames, Iowa, USA) using dsDNA Reagent Kit 35-500 bp(AATI). Raw data were analyzed using PROSize version 2.0 software (AATI).
Data analysis
The variability in terms of number of alleles (NA), expected heterozygosity (HE), observed heterozygosity (HO), and polymorphism information content (PIC) for each locus was determined using PowerMarker V3.25 (Liu and Muse, 2005).
An unweighted neighbor joining method was used to construct a dendrogram with the help of DARWin 6.0. (Perrier and Jacquemoud, 2006). Principal co-ordinate analysis (PCoA) (GenAlEx 6.0; Peakall and Smouse, 2006) was utilized to examine the genetic relationships among accessions of foxtail millet on the basis of EST-SSR data. Population structure analysis was performed using STRUCTURE 2.3.1 (Pritchard et al., 2000). The admixture model was used with a burn-in of 50,000 and 100,000 iterations for 1 to 10 K populations with three independent runs each.
This set of parameters exhibited a convergence point where summary static (e.g. ∝) show equilibrium. The ad-hoc statistic ΔK was used to determine the optimum number of subpopulations (Evanno et al., 2005).
Results
Profile of FM-E-SSR markers
Genetic variability of Setaria italica accessions, representing the diverse collections from different regions of the Korea was assessed using EST-SSR markers (Table 2). The characteristics of the 22 microsatellite loci used in this study are shown in Table 2. A total of 121 alleles were detected for the twenty-two EST-SSR loci among 621 foxtail millet accessions. The number of alleles (NA) per EST-SSR marker locus ranged from 2 to 9. These alleles expressed at all loci with an average of 5.5 alleles per locus. Typically, higher values of HE and HO reveal higher genetic variability among the germplasm collections. As listed in Table 2, the average value for the expected heterozygosity was 0.594 ranging from 0.442 to 0.675. However, the values for HO ranged from 0.000 to 0.131 with an average value of 0.034. Nevertheless, average values of the PIC were relatively higher (0.518) with a range of 0.374 to 0.690 (Table 1).
Phylogenetic analysis
A neighbor joining unweighted tree was constructed based on the genetic dissimilarity matrix data of SSR alleles that manifest a complete structure of the genetic diversity among foxtail millet germplasm collections (Fig. 1). Based on the
Table 2. Characteristics of 22 FM-E-SSR markers used in this study and their genetic diversity parameters among 621 accessions of foxtail millet
Marker Name Seq ID Foward primer Reverse primer Motif NAz HEy Hox PICw FM-E-SSR7 XM_004953420 GCTCGTGTCCTTGATGAG CCTCACATGATGAACTGAACT TTGCT 8 0.619 0.029 0.542 FM-E -SSR82 XM_004966345 TCCAGTACAGGTGTGTGTGTA GCGTAACACAACTAGTAAAACG GTGTAC 7 0.442 0.131 0.389 FM-E -SSR215 XM_004977263 AGTCCAGCGACTTAAGATA ATTGTCCTCAAATGAAATC (GCA)4-(CAG)5 3 0.501 0.006 0.377 FM-E -SSR307 XM_004951429 TCCTCAACCTACATATCAAC CTGATAGAGCTGGTGAGTT (CAACCC)6 3 0.604 0.000 0.519 FM-E -SSR308 XM_004961245 TAAGGAAAAAGACAGAGACA GGAGGCGAGTATGAAAC (GACAAG)6 8 0.611 0.016 0.535 FM-E -SSR312 XM_004979902 ATCGAGTCTCTCACAAGG CTAAACAAGGTGCTGATCT (AACAAG)5 4 0.675 0.099 0.612 FM-E -SSR331 XM_004974206 TCCTCAACCTACATATCAAC CTGATAGAGCTGGTGAGTT (GCA)9 4 0.552 0.016 0.472 FM-E -SSR322 XM_004970387 GTGTACTCCCCCTACAAC GGGAAGAAAGATGAGGA (GCC)9 5 0.622 0.034 0.548 FM-E -SSR334 XM_004960412 TTCTAATCCACCAGTTACAC GATCTTGATAAGTTGGAGGT (GGA)9 2 0.499 0.005 0.374 FM-E -SSR335 XM_004952427 ACAAAGGAGTCATCCATC CTATTGCTGGTTCTGTTG (TCA)9 6 0.615 0.016 0.536 FM-E -SSR337 XM_004960467 GGTCCTCTTCTTCCTTCT TTCTCGAACTTGCACTC (CGCCT)5 7 0.640 0.005 0.587 FM-E -SSR347 XM_004969739 GTAGATACTCTCACCGATCA CACCAGAGACTCAACTTGT (CAC)8 5 0.517 0.047 0.445 FM-E -SSR356 XM _004986154 TAAGGAAAAAGACAGAGACA GGAGGCGAGTATGAAAC (GGGTAC)4 8 0.626 0.025 0.555 FM-E -SSR360 XM _004966685 ATCGAGTCTCTCACAAGG CTAAACAAGGTGCTGATCT (CCACCT)4 7 0.666 0.111 0.608 FM-E -SSR361 XM _004957675 GGTCCTCTTCTTCCTTCT TTCTCGAACTTGCACTC (GGT)8 4 0.656 0.000 0.601 FM-E -SSR379 XM _004964539 TCCTCAACCTACATATCAAC CTGATAGAGCTGGTGAGTT (GCG)8 4 0.492 0.000 0.391 FM-E -SSR380 XM _004961245 TAAGGAAAAAGACAGAGACA GGAGGCGAGTATGAAAC (AGG)8 8 0.597 0.020 0.515 FM-E -SSR385 XM _004976251 GGTCCTCTTCTTCCTTCT TTCTCGAACTTGCACTC (CGCCGA)4 9 0.733 0.042 0.690 FM-E -SSR403 XM _012846173 TCCTCAACCTACATATCAAC CTGATAGAGCTGGTGAGTT (CCG)8 5 0.520 0.029 0.423 FM-E -SSR404 XM _012843154 TAAGGAAAAAGACAGAGACA GGAGGCGAGTATGAAAC (CACCAG)4 5 0.629 0.021 0.557 FM-E -SSR408 XM _004984719 ATCGAGTCTCTCACAAGG CTAAACAAGGTGCTGATCT (AAG)8 5 0.602 0.089 0.519 FM-E -SSR409 XM _004978360 GGTCCTCTTCTTCCTTCT TTCTCGAACTTGCACTC (GCCCCG)4 4 0.649 0.008 0.592
Mean 5.5 0.594 0.034 0.518
zNA: number of alleles per locus, yHE: expected heterozygosity,x Ho: observed heterozygosity, wPIC: polymorphic information content.
unweighted neighbor-joining clustering, 621 landraces of foxtail millet from Korea were divided into three clusters.
The cluster I comprised of 322 accessions while cluster II and cluster III contained 118, and 181 accessions, respectively (Fig. 1, Table 2). The germplasm collected from the sites of the Gangwon-do showed dominance (34.46%) in all three clusters followed by the collections from the Gyeongsang-do area (22.87%). The cluster I was the richest in diversity with representation of germplasm collections from all the regions of Korea, including commercial varieties, reintroduced germplasm, and unknown landraces. Other than GWD, major area of cluster I was covered by collections from GSD, JLD, GGD, RID, CCD, and JJD with 63, 35, 31, 22, 21, and 20 accessions, respectively. The cluster II showed high representation of germplasm from GWD (45) followed by GSD, JLD, CCD,
and GGD with 30, 13, 12, and 8 accessions, respectively. The RID and UKN germplasm collections exhibited less number of accessions (4 and 2 respectively) in cluster II. Similarly, major portion of cluster III was covered by the landraces from GSD (49) and GWD (47) followed by CCD (19), GGD (19), UKN (16), JLD (13), and JJD (8). The RID germplasm, reintroduced landrace accessions from GenBank of Japan occupied their space in all three clusters I, II, and III with 22, 4, and 10 accessions, respectively and the pattern was very similar with landraces of Jeju-do.
Population structure
To determine the population structure of 621 Korean accessions of foxtail millet, STRUCTURE 2.3.3 (Pritchard et al., 2000) was used and the proper structure of subpopulations
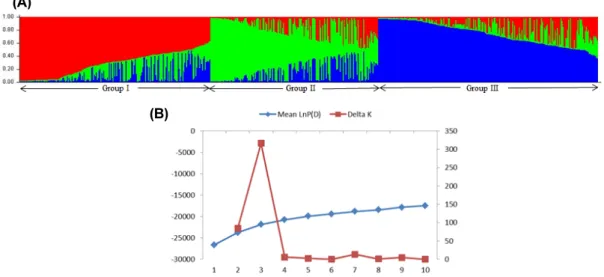
(A)
(B)
Fig. 2. Population structure of 621 accessions of foxtail millet based on 22 FM-E-SSRs. (A) Structure analysis (STRUCTURE K = 3) distributed the population into groups according to the clusters obtained by the UNJ analysis. Numbers in the ‘y’ axis show the subgroup membership and the groups are represented by different colors. (B) Average log-likelihood values (mean lnP (D) for 3 iterations) and ad-hoc statistic △k for K values ranging from 1 to 10.
Coord. 2 (10.99)
Coord. 1 (13.38%)
JLD CCD GGD GSD GWD JJD CVR RID UKN
Fig. 3. Graph of first two axes from a principal coordinate analysis of foxtail millet accessions. The first two coordinates explained 13.38 % and 10.99 % of the total variation.
(K) was determined by employing Evano’s method (Evano et al., 2005). The LnP(D) values for different Ks, ranged from 1 to 10, where a gradual increase was observed before reaching a peak value at K = 3 (Fig. 2B) with the least variance among replicate runs. The LnP(D) values after K = 3, though increased up to K = 10 but variation was observed among the replicate runs. The structure results pointed out that the highest value of △K was observed for K = 3 (Fig. 2B). This analysis suggested that the present collection of foxtail millet accessions can be divided into three groups, as inferred from the model, here designated as Group I (GI) to Group III (GIII), respectively. The Q matrix (the estimated membership coefficients for each individual in each of k clusters), sorted by Q, for K = 3. According to STRUCTURE, Group I and Group III showed the lower degree of admixture than Group II. Group II was higher admixture with genotype of Group I and Group III, disclosed the cluster match with the phylogenetic analysis (Fig. 1, 2).
Principle coordinate analysis (PCoA) was calculated from dissimilarity coefficients to estimate the population divisions and further assessment of the grouping patterns in the neighbor-joining clustering and is graphically presented in Fig. 3. The coordinates were calculated for the two first axes with positive Eigen values. The two axes accounted for
32.06% of the total variation with the first axis (Coord.1) accounting for 13.38% and second (Coord.2) accounting for 10.99%. Coord.1 shows more roughly separated landraces than Coord.2. However, the PCoA showed loose clustering among the local regions because these accessions may have similar allele frequencies as landraces in the lower cluster. It also seems that higher admixture genotypes of Group II (Fig.
2) were located in intermediate position.
Discussion
The presence of genetic variation in the target crop along
with extensive knowledge is a prerequisite for the efficient conservation, management and effective utilization of plant genetic resources (Mondini et al., 2009). Due to its high drought stress tolerance and photosynthetic efficiency, foxtail millet has attracted global research attention (Liu et al., 2011). Furthermore, East Asia including Korea and Japan is suggested as the primary center of diversity of foxtail millet. Thus to determine the genetic diversity among the foxtail millet accessions of Korean landrace through molecular markers such as SSRs and EST-SSRs might be an important step towards crop conservation. EST-SSR markers tend to be more conserved and specific in nature to study comparative genome mapping and phylogenetic relationships in different crops (Cordeiro et al., 2001). Previously, EST derived SSR markers in foxtail millet were used to study their effective transferability (Jia et al., 2009) and genetic diversity (Kumari et al., 2013). Therefore, it inspired us to concentrate on the genetic diversity and population structure of foxtail millet landraces collected from Korea by using EST-SSR markers.
A moderate level of molecular diversity in foxtail millet collections has been explained by our results. The highly polymorphic EST-SSR markers resulted out 121 alleles with an average of 5.5 alleles per locus, which was comparable to other studies such as 4.91 in broomcorn millet, 4.79 in sorghum, 3.93 in rice, 8.2 in maize, 6.16 and 2.4 in foxtail millet, and 7.6 in sorghum (Cho et al., 2000; Agrama et al., 2007; Hu et al., 2009; Shehzad et al., 2009; Wang et al., 2009; Jia et al., 2009; Lin et al., 2012). The HE mean value in the present study (0.594) was higher than that reported in proso millet (0.37), while less than that reported in rice (0.67) (De campos et al., 2008; Cho et al., 2010). Similarly, the Ho average value (0.034) was slightly closer to Indian foxtail millet (0.045) (Gupta et al., 2012). This variation could have happened due to regional barriers, heterosis, and/or man made selection (Upadhyaya et al., 2008). Present research also exhibited a higher PIC (0.518) than that reported earlier in foxtail millet (0.381) and rice (0.42) (Jin et al., 2010; Lin et al., 2012), but lower than that reported in maize (0.72), pearl millet (0.58), persimmon (0.67) and perilla (0.59) (Pejic et al., 1998; Kapila et al., 2007; Seo et al., 2013; Song et al., 2012). Here, we have used a combination of di- and trinucleotides that might be the cause of variation, because a
higher number of dinucleotide repeats instead of trinucleotides or higher numbers increase the genetic variability (Yang et al., 2010).
Based on the EST-SSR data obtained, the 621 accessions of foxtail millet were divided into three clusters (Fig. 1).
However, for the majority of the landraces, no clear corresponding relationship between clustering groups and their geographic locations was found, and most of them had tendency to be grouped together. The landraces from Gangwon-do spanned over three clusters showing higher diversity, which is similar to the results reported by Kim et al. (2011) for the germplasm collections from same region. Additionally, the suitable climate and soil of this area have been useful for the farmers to grow and maintain foxtail millet landraces (Kim et al., 2012). Similarly, reintroduced germplasm collections, saved during Japanese regime around Korea’s pre-1948 might be a vital genetic material for the future crops (Kim et al., 2012).
These accessions were revealed to be in three clusters with highest proportion, among RID germplasm in cluster I near the collections from GWD, GSD, CCD, GGD, JLD, and JJD.
Our results indicate that despite the fact foxtail millet is a minor crop in Korea, the genetic make-up of local landraces has maintained a good diversity level. However, it seems to be needed more molecular markers and phenotypic data to evaluate the origin germplasm flow to other local regions.
Understanding the population structure is important to prevent pseudo association between phenotype and genotype, nonetheless association mapping identify superior alleles and supports introgression of these alleles into elite breeding germplasm (Pritchard et al., 2000). Here, a model based approach, implemented in STRUCTURE was used to study the population structure. This approach in the present study revealed the existence of population subdivision and identified three groups in local landraces of foxtail millet, which is in accordance with the phylogenetic analysis (Fig. 1, 2). Contrary to our results, Fukunaga et al., (2002) observed the geographic differentiation among the accessions from five regions of the world. However, in our case all the 621 accessions of foxtail millet were from Korea, though they were collected from different locations. However, PCoA analysis couldn’t divide them into clear population-level clusters. This pattern of distribution might be the result of
frequent exchange of germplasm from one region to other on account of crop improvement programs in the country.
Genetic diversity and population structure among foxtail millet landraces presented here might be a valuable asset to maintain the genetic resources of such an important crop in diversity rich regions of Korea to produce better crops for future agriculture. Furthermore, the millet specific microsatellite markers used in this study would be a discrete source for the assessment of genetic diversity.
Acknowledgment
This study was carried out with the support of “Research Program for Agricultural Science & Technology Development (Project No. PJ0101062016)”, National Institute of Agricultural Sciences, Rural Development Administration, Republic of Korea.
References
Agrama, H.A., G.C. Eizenga and W. Yan. 2007. Association mapping of yield and its components in rice cultivars. Mol.
Breeding 19:341-356.
Benabdelmouna, A., M. Abirached-Darmency and H. Darmency.
2001. Phylogenetic and genomic relationships in Setaria italica and its close relatives based on the molecular diversity and chromosomal organization of 5S and 18S-5.8S-25S rDNA genes. Theor. Appl. Genet. 103:668-677.
Camacho-Villa, T., N. Maxted, M. Scholten and B. Ford-Lloyd.
2005. Defining and identifying crop landraces. Plant Genetic Resources: Characterization and Utilization. 3:373-384.
Cho, Y.G., T. Ishii, S. Temnykh, X. Chen, L. Lipovich, S.R.
Mccouch, W.D. Park, N. Ayres and S. Cartinhour. 2000.
Diversity of microsatellites derived from genomic libraries and GenBank sequences in rice (Oryza sativa L.). Theor.
Appl. Genet. 100:713-722.
Cho, Y.I., J.W. Chung, G.A. Lee, K.H. Ma, A. Dixit, J.G. Gwag and Y.J. Park. 2010. Development and characterization of twenty-five new polymorphic microsatellite markers in proso millet (Panicum miliaceum L.). Genes Genom. 32:267-273.
Cordeiro, G.M., R. Casu, C.L. McIntyre, J.M. Manners and R.J.
Henry. 2001. Microsatellite markers from sugarcane (Saccharum spp.) EST cross transferable to erianthus and sorghum. Plant
Sci. 160:1115-1123.
da Maia, L.C., D.A. Palmieri, V.Q. de Souza, M.M. Kopp, F.I.
de Carvalho and A.C. de Oliveira. 2008. SSR locator: tool for simple sequence repeat discovery integrated with primer design and PCR simulation. Int. J. Plant Genomics.
doi:10.1155/2008/412696
Deb, D. 2009. Valuing folk crop varieties for agroecology and food security, bioscience resource project commentaries.
The Bioscience Resource Project, Inc., USA.
De Campos, V.A.R., T.C. De Oliveira Borba, C. Brondani, P.H.N. Rangel et al. 2008. Genetic analysis of a local population of Oryza glumaepatula using SSR markers:
implications for management and conservation programs.
Genetica 137:221-231.
de Wet, J.M.J., L.L. Oestry-Stidd and J.I. Cubero. 1979.
Origins and evolution of foxtail millets (Setaria italica). J.
Agric. Trop. Bot. Appl. 26:53-64.
Evanno, G., S. Regnault and J. Goudet. 2005. Detecting the number of clusters of individuals using the software structure. A simulation study. Molecular Ecology 14:2611-2620.
Fukunaga, K., E. Domon and M. Kawase. 1997. Ribosomal DNA variation in foxtail millet and a survey of variation from Europe and Asia. Theor. Appl. Genet. 95:751-756.
Fukunaga, K., K. Ichitani and M. Kawase. 2011. rDNA polymorphism of foxtail millet (Setaria italica ssp. italica) landraces in northern Parkistan and Afghanistan and in its wild ancestor (S. italica ssp. viridis). Genet. Resour. Crop Evo. 58:825-830.
Fukunaga, K., M. Kawase and K. Kato, 2002. Structural variation in the Waxy gene and differentiation in foxtail millet [Setaria italica (L.) P. Beauv.]: implications for multiple origins of the waxy phenotype. Mol. Genet. Genomics.
268:214-222.
Gupta, S., K. Kumari, P.P. Sahu, S. Vidapu and M. Prasad.
2012. Sequence-based novel genomic microsatellite markers for robust genotyping purposes in foxtail millet [Setaria italica (L.) P. Beauv.] Plant Cell Rep. 31:323-337.
Hirano, R., K. Naito, K. Fukunaga, K.N. Watanabe, R. Ohsawa and M. Kawase. 2011. Genetic structure of landraces in foxtail millet (Setaria italica (L.) P. Beauv.) revealed with transposon display and interpretation to crop evolution of foxtail millet. Genome 54:498-506.
Hu, X., J. Wang, P. Lu and H. Zhang. 2009. Assessment of genetic diversity in broomcorn millet (Panicum miliaceum L.) using SSR markers. J. Genet. Genomics 36:491-500.
Jia, X., Z. Zhang, Y. Liu, C. Zhang, Y. Shi, Y. Song, T. Wang and Y. Li. 2009. Development and genetic mapping of SSR markers in foxtail millet (Setaria italica (L.) P. Beauv.).
Theor. Appl. Genet.118: 821-829.
Jia, X.P., Y.S. Shi, Y.C. Song, G.Y. Wang, T.Y. Wang and Y.
Li. 2007. Development of EST-SSR in foxtail millet (Setaria italica). Genet. Resour. Crop Ev. 54:233-236.
Jin, L., Y. Lu, P. Xiao, M. Sun, H. Corke and J. Bao. 2010.
Genetic diversity and population structure of a diverse set of rice germplasm for association mapping. Theor. Appl.
Genet. 121:475-487.
Jusuf, M. and J. Pernes. 1985. Genetic variability of foxtail millet (Setaria italica P Beauv). Theor. Appl. Genet. 71:385-391.
Kapila, R.K., R.S. Yadav, P. Plaha, K.N. Rai et al. 2007.
Genetic diversity among pearl millet maintainers using microsatellite markers. Plant Breeding 127:33-37.
Kim, C.Y., G.T. Cho, J. Lee, J.S. Sung, Y.W. Na, M.S. Yoon, H.J. Baek, H.C. Ko and Y.H. Cho. 2012. Introduction and significance on reintroduction of Korean native plant genetic resources from foreign countries. Korean J. Intl. Agri.
24(1):22-31.
Kim, E.J, K.J. Sa, K.C. Park and J.K. Lee. 2012. Study of genetic diversity and relationship among accessions of foxtail millet [Setaria italica (L.) P. Beauv] in Korea, China and Pakistan using SSR markers. Genes & Genomics.
34:529-538.
Kim, E.J., K.J. Sa and J.K. Lee. 2011. Genetic variation of foxtail millet [Setaria italica (L.) P. Beauv.] among accessions collected from Korea revealed by AFLP markers. Korean J.
Crop Sci. 56:322-328.
Kumari, K., M. Muthamilarasan, G. Misra, S. Gupta, A.
Subramanian, S.K. Parida, D. Chattopadhyay and M. Prasad.
2013. Development of eSSR-markers in Setaria italica and their applicability in studying genetic diversity, cross-trans- ferability and comparative mapping in millet and non-millet species. PLoS ONE 8:e67742.
Le Thierry d’Ennequin, M., O. Panaud, B. Toupance and A.
Sarr. 2000. Assessment of geneticrelationships between Setaria italica and its wild relatives S. viridis using AFLP marker. Theor. Appl. Genet. 100:1061-1066.
Lee, J.K. and N.S. Kim. 2007. Genetic diversity and relationships of cultivated and weedy types of Perilla frutescens collected from East Asia revealed by SSR markers. Korean J. Breed.
Sci. 39(4):491-499.
Li, Y., J. Jia, Y. Wang and W. Shuzhi. 1998. Intraspecific and
interspecific variation in Setaria revealed by RAPD analysis.
Genet. Resour. Crop Ev. 45(3):279-285.
Li, Y., Y.S. Cao, S.Z. Wu and X.Z. Zhang. 1995. A phenotypic diversity analysis of foxtail millet (Setaria italica (L.) P.
Beauv.) landraces of Chinese origin. Genet. Resour. Crop Ev. 43:377-389.
Lin, H.S., G.I. Liao, C.Y. Chiang, C.S. Kuoh and S.B. Chang.
2012. Genetic diversity in the foxtail millet (Setaria italica) germplasm as determined by agronomic traits and microsatellite markers. Aust. J. Crop Sci. 6(2):342-349.
Liu, K. and S.V. Muse. 2005. PowerMarker: an integrated analysis environment for genetic marker analysis. Bioinformatics 21:2128-2129.
Liu, Z., G. Bai, D. Zhang, C. Znu, X. Xia, Z. Cheng and Z. Shi.
2011. Genetic diversity and population structure of elite foxtail millet (Setaria italica (L.) P. Beauv.) germplasm in China. Crop Sci. 51:1655-1663.
Mondini, L., A. Noorani and M.A. Pagnotta. 2009. Assessing plant genetic diversity by molecular tools. Diversity 1:19-35.
Peakall, R. and P. Smouse. 2006. Genalex 6: genetic analysis in Excel. Population genetic software for teaching and research. Mol. Ecol. Notes. 6:288-295.
Pejic, I., P. Ajmone-Marsan, M. Morgante, V. Kozumplick, P.
Castiglioni, G. Taramino and M. Motto. 1998. Comparative analysis of genetic similarity among maize inbred lines detected by RFLPs, RAPDs, SSRs, and AFLPs. Theor. Appl.
Genet. 97:1248-1255.
Perrier X. and J.P. Jacquemoud-Collet. 2006. DARwin software http://darwin.cirad.fr/
Prasada Rao, K.E., J.M.J. de Wet, D.K. Brink and M.H.
Mengesha. 1987. Intraspecific variation and systematics of cultivated Setaria italica, foxtail millet (Poaceae). Econ.
Bot. 41:108-116.
Pritchard, J.K., M. Stephens and P. Donnelly. 2000 Inference of population structure using multilocus genotype data. Genetics 155:945-959.
Reddy, M.T., H. Begum, N. Sunil, P.S. Rao, N. Sivaraj and S.
Kumar. 2014. Preliminary characterization and evaluation of landraces of Indian spinach (Basella spp. L.) for agro-economic and quality traits. Plant Breed. Biotech. 2(1):48-63.
Schontz, D. and B. Reather. 1999. Genetic variability in foxtail millet, Setaria italica P. Beauv.: Identification and classifi- cation of lines with RAPD markers. Plant Breeding 118:190-192.
Seo, D.H., K.M. Jung, S.J. Kim and K.M. Kim. 2013.
Development of EST-SSR markers and analysis of genetic diversity using persimmon (Diospyros kaki Thunb) cultivars collecting from domestic. Korean J. Plant Res. 26(4):
491-502 (in Korean).
Shehzad, T., H. Iwata and K. Okuno. 2009. Genome-wide association mapping of quantitative traits in sorghum (Sorghum bicolor (L.) Moench) by using multiple models.
Breeding Science 59:217-227.
Song, J.Y., J.R. Lee, S. Oh, C.Y. Kim, C.H. Bae, G.A. Lee, K.H. Ma, Y.M. Choi, H.J. Park and M.C. Lee. 2012.
Assessment of genetic diversity and fatty acid composition of perilla (Perilla frutescens var. frutescens) germplasm. Korean J. Plant Res. 25(6):762-772.
Upadhyaya, H.D., S.L. Dwivedi, M. Baum, R.K. Varshney, S.M. Udupa and C.L.L. Gowda. 2008. Genetic structure, diversity, and allelic richness in composite collection and reference set in chickpea (Cicer arietinum L.) BMC Plant Biol. 8: 106. DOI: 10.1186/1471-2229-8-106.
Varshney, R.K., A. Graner and M.E. Sorrells. 2005. Genic microsatellite markers in plants, features and applications.
Trends Biotechnol. 23:48-55.
Vavilov, N.I. 1926. Studies on the origin of cultivated plants.
Inst Appl. Bot. Plant Breed., Leningrad, USSR.
Wright, S.I. and B.S. Gaut. 2005. Molecular population genetics and the search for adaptive evolution in plants.
Molecular biology and evolution 22(3):506-519.
Wang, M.L., C. Zhu, N.A. Barkley, Z. Chen, J.E. Erpelding, S.C. Murray, M.R. Tuinstra, T. Tesso, G.A. Pederson and J.
Yu. 2009. Genetic diversity and population structure analysis of accessions in the US historic sweet sorghum. Theor. Appl.
Genet. 120:13-23.
Wang, R.L., J. Wendell and J. Dekker. 1995. Weedy adaptation in Setaria spp.: I. Isozyme analysis of the genetic diversity and population genetic structure in S. viridis. Amer. J. Bot.
82:308-317.
Yang, X., J. Yan, T. Shah, M.L. Warburton, Q. Li, L. Li, Y.
Chai, Z. Fu, Y. Zhou, S. Xu, G. Bai, Y. Meng, Y. Zheng and J. Li. 2010. Genetic analysis and characterization of a new maize association mapping panel for quantitative trait loci dissection. Theor. Appl. Genet. 121:417-431.
(Received 4 May 2016 ; Revised 3 June 2016 ; Accepted 8 June 2016)