Environmental Science
Vol. 31, No. 3, pp. 177-191, August, 2015 http://dx.doi.org/10.7747/JFES.2015.31.3.177
Environmental Factors Affecting the Abundance and Presence of Tree Species in a Tropical Lowland Limestone and Non-limestone Forest in Ben En National Park, Vietnam
Thinh Van Nguyen1,2,*, Ralph Mitlöhner1, Nguyen Van Bich2 and Tran Van Do2
1Department of Tropical Silviculture and Forest Ecology, Faculty of Forest Sciences and Forest Ecology, University of Göttingen, Germany
2Silvicultural Research Institute (SRI), Vietnamese Academy of Forest Sciences (VAFS), Duc Thang, Bac Tu Liem District, Ha Noi, Vietnam
Abstract
The effect of environmental variables on the presence and abundance of tree species in a tropical lowland undisturbed limestone and non-limestone forest in Ben En National Park, Vietnam was investigated. The relationships between 13 environmental variables and 29 tree species with a DBH ≥10 cm, as well as between six 6 physical variables with 26 species of seedling and sapling communities were assessed by canonical correspondence analysis (CCA). Data concerning all tree species ≥10 cm DBH were collected from eighteen 400 m2 sample plots, while the abundance of regeneration (all individuals ≤5 cm DBH) was counted in fifty 2x20 m strip-plots. The significance of species-environments correlations were tested by distribution-free Monte Carlo tests. The CCA of the 29 examined tree species and 13 environmental variables indicated that the presence and abundance of the tree species were closely related to topographic factors.
We may confirm that soil properties including pH, soil moisture content, and soil textures, were the most crucial factor in tree species composition and their distribution. Several species including Pometia pinnata, Amesiodendron chinense, Gironniera cuspidate, Cinnamomum mairei, and Caryodaphnopsis tonkinensis were not controlled by soil properties and topographic variables. The CCA also indicated that the abundance of regeneration tree species at all sites had positive and significant correlations with soil depth, while the occurrence of several other tree species (such as Koilodepas longifolium and Aglaia dasyclada) was positively correlated with a higher slope and rocky outcrop.
Key Words: Undisturbed limestone and non-limestone forest, environmental factors, canonical correspondence analysis, vegetation-environment relationship
Received: May 5, 2015. Revised: July 27, 2015. Accepted: July 28, 2015.
Corresponding author: Thinh Van Nguyen
Department of Forest Inventory & Planning, Silvicultural Research Institute (SRI), Vietnamese Academy of Forest Sciences (VAFS), Duc Thang, Bac Tu Liem District, Ha Noi, Vietnam
Tel: 49 (0) 551 39 12101, Fax: 49 (0) 551 39 4019, E-mail: [email protected] and [email protected]
Introduction
The relationship analysis between tree species composi- tion and environmental variables is considered a crucial is- sue in the ecological and environmental sciences (Guisan and Zimmermann 2000; Zhang et al. 2012), as the inter-
play between forests and environmental variables is integral to any study of the former (Zhang and Zhang 2011).
Floristic composition and its relationship to environmental factors have become recent topic investigation: numerous studies have shown that the distribution of vegetation types and floristic patterns are most associated with environ-
mental factors, including local variables/topographic factors (elevation, slope aspect, slope degree), soil factors (a soil’s physical and chemical properties) (Huang 2002; Eilu 2004; Jones et al. 2006; Jabeen and Ahmad 2009; Tavili et al. 2009; Zhang et al. 2012), and factors related to human impact (Enright et al. 2005; Hoang et al. 2011). Among these environmental variables, soil type and topographic variables are the most significant factors affecting species diversity and the woody vegetation of a locality (Hejcmanova-Nezerková and Hejcman 2006; Zhang et al.
2012). In general, the distribution of vegetation patterns is mainly controlled by soil factors consisting of organic carbon, total nitrogen, and clay, as well as topographic factors such as elevation (Arekhi et al. 2010). The importance of phys- icochemical soil properties and soil nutrients are key factors influencing tree species richness (Eilu 2004), plant growth, and vegetation development (Zhang and Zhang 2011).
Silt/clay content, organic matter, and the total nitrogen are primarily related to vegetation distribution (He et al.
2007; Zhang and Zhang 2011); however, it could be argued that soil moisture is the most important environmental vari- able affecting the distribution of native species among hab- itats (Lan et al. 2011) and is as such a crucial factor in the valley forest (Pinto et al. 2005). By affecting moisture avail- ability, soil moisture plays a key role in determining the dis- tribution of plant species and roots (Arekhi et al. 2010).
Factors including C/N ratio, soil pH, and the content of ex- changeable calcium (among others) influence plant diver- sity, vegetation structure, and the effects of vegetation proc- esses (Chiarucci et al. 2001; Pärtel et al. 2004).
In addition to the abovementioned factors, the majority of the significant evidence for topographic variables con- trolling the distribution patterns of tree species was found in environmental-tree species studies (Lan et al. 2011).
Elevation is one of the most essential factors relating to the distribution of vegetation patterns and confirms the im- portance of topographic features in controlling the diversity of a tree community on both a small scale (via plots) (Lan et al. 2011) and a regional scale (Chiarucci et al. 2001;
Sharma et al. 2009; Zhang and Zhang 2011; Zhang et al.
2012). Other topographic factors like slope and aspect are also significant to the spatial variation of plant communities (Zhang and Zhang 2011). Slope and outcropping rocks were the two main factors associated with the presence of a
species (Chiarucci et al. 2001), while climatic factors were central in controlling the distribution and species richness patterns of various tree species (Sharma et al. 2009). The main goals of this study are to answer the following ques- tions: (1) What are the most important factors affecting tree abundance and the distribution of tree species in undis- turbed limestone and non-limestone forests in Ben En National Park? And (2) How do physical factors influence the abundance and presence of regeneration in the park?
Materials and Methods
Study sites
This study was conducted in Ben En National Park, Vietnam, over total park area is 16,600 ha at 20∼500 m above sea level. Forests in the park are defined as a tropical lowland evergreen forest (Hoang et al. 2008). Variance in soil depth and outcrop cover varies site to site due to top- ography and soils are derived from a limestone substrate with a pH ranging from 4.5 to 6.7. The most abundant soil in the park is ferralitic, while a small area surrounding Lake Muc has alluvial soils; macgalit is found in the limestone hill areas.
In the park, limestone forests occur infrequently, and have a total area of only approximately 400 ha. The main characteristics of the limestone topography are rocky tops with steep, 20∼30o slopes with shallow, partially uncovered soils and an outcrop and slope erosion. Because the lime- stone forest borders Nghe An Province, this area has suf- fered from illegal logging activities; likewise its proximity to the Ho Chi Minh Road makes the transportation of illegal logs easy. In undisturbed non-limestone forest areas, the physical properties of soils are good and large roots are ob- served reaching to depths of ≥1 m. The slope ranges from 5 to 20o.
Sampling design and data collection Sampling design
The sampling design was deployed in undisturbed low- land limestone (denoted as LF) and non-limestone forests (Non-LF) sites along with a strategy of systematic sampling. For each forest site, a total of twenty-five 20x20 m sample plots were arranged in a systematic design with 50 m intervals between adjacent sampling plots (Fig. 1). All
Fig. 1. Layout of the sampling design with each 400 m² sample plot (20x20 m). The interval sample plot was 50 m.
Fig. 2. One transect of 2x20 m was placed at the middle of each 400 m2 sample plot.
sample plots were carried out in the strictly-protected zone.
Sampling was conducted during the dry season from February to April 2012.
Vegetation data
All trees with a DBH ≥10 cm (Rana and Gairola 2009;
Lu et al. 2010; Suratman et al. 2010) were collected and measured in a total of eighteen 20x20 m sample plots in the two undisturbed forest types (9 plots each, Fig. 1). The bot- anical name of every living tree was determined in the field and the DBH was measured to determine the tree basal area.
At each 2x20 m transect (strip-plot), tree height and DBH were used to identify the regeneration. The abundance and names of tree species regeneration which is ≤5 cm DBH were sampled and recorded in 2x20 m strip-plots (Fig. 2).
Environmental and physical variables
In this study, the environmental variables measured in each of the nine sample plots per forest type consisted of three components: (1) Soil physical properties (including proportions of sand, silt, and clay), soil moisture content, and pH-KCl; (2) Soil chemical properties, consisting of the total nitrogen, total potassium, total phosphorus, Cation-Exchange Capacity (CEC=K++Ca2++Mg2+
H+Al), carbon to nitrogen C/N ratio, and the proportion of soil organic carbon; and (3) Topographical variables (slope and soil depth).
The slope was measured with a compass and looking down-slope (Zhang and Zhang 2007). Because of differ- ences in the soil depth between the limestone and non-lime-
stone forests, two different methods were applied in order to identify these forests’ respective soil depths. At the lime- stone site, the soil depth was measured by a steel probe (Kelly et al. 1989) in two meter intervals at ten points in a transect/strip 2x20 m of each sample plot 20x20 m; the mean soil depth was calculated from the achieved values. At the non-limestone site, nine soil profiles were dug in nine sample plots to determine the soil depth; the mean soil depth value was calculated from these profiles.
The percentage of rock outcrops or percentage cover of surface stones was visually estimated at each sample plot in the undisturbed limestone forests and followed FAO’s pro- tocols (2006). The percentage of covered rock was calcu- lated as the ratio of rock to the total area of a 100x100 cm grid with 25 sub- grids of 20x20 cm, taking the average of five points along the diagonal for each sample plot (Peng et al. 2012). The total coverage of ground vegetation (grass, herbs, and shrubs) was measured in each sample plot (Merkle 1951); it was calculated as the percentage of total area (Park et al. 2005; Kulla et al. 2009) and visually esti- mated (Zhang and Zhang 2011).
The topsoil layer is the most important source of nu- trients for plants (Hejcmanova-Nezerková and Hejcman 2006). The soil’s physical and chemical properties, which is to a depth of 20 cm, play an essential role in shaping vegeta- tion (Tavili et al. 2009). In the case of the non-limestone forest site, soil samples were taken at the central point of the sample plot (Kiianmaa 2005; Nirmal et al. 2011) at depths of 0 to 20 cm (Tavili et al. 2009; Arekhi et al. 2010; Zhang and Zhang 2011) by using an auger 3 cm in diameter. In
the limestone forest where the soil is shallow, soil samples were collected randomly in each sample plot at a depth of 0 to 20 cm (Jha and Singh 1990). A total of nine soil samples were collected from each forest type, leading to 18 soil sam- ples in total.
The soil samples were air dried at room temperature and pooled to form one composite sample that was air-dried, thoroughly mixed, and then passively sieved through a 2 mm screen to remove rocks and large organic material. The percentage of moisture content was calculated as the differ- ence between the pre- and post-drying weights divided by the pre-drying weight. The bouyoucos hydrometer method was used to determine the soil texture and calculate the per- centage of sand, silt, and clay. Organic carbon was meas- ured by the Walkley and Black method; pHKCl was de- termined by using a pH meter (soil water ratio=1:5).
The total nitrogen was estimated using the Kjeldahl meth- od, and the total phosphorus was measured by wet digestion and the Bray II method. Wet digestion and the Atomic Absorption Spectroscopy method were applied in order to determine the total potassium content. The soil organic matter was measured by the K2Cr2O7 method, and the Cation-Exchange Capacity (CEC=K++Ca2++Mg2+
H+Al) was determined via a BaCl2 solution, followed by the Atomic Absorption Spectroscopy method. All physical and chemical properties of the soil were analyzed at the lab- oratory of the Vietnamese Academy of Forest Sciences.
Data analysis
Tree species data and environmental analysis:
The tree abundance, basal area, and number of spe- cies/families occurring at each forest type were determined.
Tree abundance was calculated with a count of all trees with a DBH ≥10 cm from 25 sample plots of each forest type;
the basal area was calculated by using the following equa- tion: BA=πr2=3.142x(DBH/200)2, where BA=the tree basal area (m2) and r=radius (cm). A two sample t-Test was used to test for significant differences in the physical and chemical properties between the soils at the Non-LF and LF sites. All statistical analyses were performed with Statistica, Version 10.
Species and environment matrices: Tree species and related environmental factors were analyzed using ordi- nation techniques. First, the data were entered into a
Microsoft Excel spreadsheet before being transferred to the computer program PC-ORD for Windows version 5.12;
any species absent in the sample plots was entered with a value of ‘0’. A total of 18 sample plots from the two forest types were then analyzed, and two distinct data matrices consisting of the species matrix and the matrix of environ- ment variables were set up as required by the multivariate analysis methods. The species matrix contained a count of the tree abundance per species/sample plot, where species with an abundance of less than 4 individuals were deleted (Pinto et al. 2005; Souza et al. 2007). The resulting samples from the species data matrix consisted of 29 species and 18 sample plots. A second sample from the environmental var- iables data matrix was also constructed for 13 environ- mental factors from the same sample plots; this matrix ini- tially included all physical and chemical properties of the soil and assorted topographic variables.
The data on regeneration and physical variables collected in the LF and Non-LF types were constructed in fifty 2x20 m strip-plots (25 strip-plots each). Two input matrices were used in this analysis. The species matrix consisted of the tree abundance of regeneration and their species richness in each 2x20 m strip-plot in every 400 m2 sample plot. This matrix contained the tree abundance per strip for those with
≥10 individuals in the total sample; as a result, the matrix had 26 species per 50 strip-plots. The physical matrix con- sidered in the analysis were the assorted characteristics of the forest structure, including: the basal area and tree abundance of a 400 m2 sample plot, the understorey vegetation cover (canopy coverage, percentage of herb and shrub cover), and the local topography (slope in degree, percentage of rock out- crops or percentage cover of surface stones, and soil depth).
The matrix contained the values of six physical variables.
Species-environment relationship: To investigate the relationship between tree species variation and environ- mental variables, the CCA was employed. The statistical significance of the species-environment correlation was tested by the Monte Carlo test; a permutation test was used to reveal the effect of the obtained environmental variables on the composition of plant species (Hejcmanova-Nezerková and Hejcman 2006). Permutation tests were run with 499 permutations at a 0.05 significance level. To verify the cor- relations between species, environmental variables, the first three axes, and Spearman’s rank correlation coefficients
Table 1. The number of individuals, species and families counted in fifty 400 m2 sample plots of the LF and Non-LF sites (25 sample plots each) in Ben En National Park, Vietnam
Variables Forest type
LF Non-LF
The total tree abundance (n/ha) 521 526
Species number (n/ha) 76 114
Family number (n/ha) 27 35
Basal area (m2/ha) 46.2 52.2
Table 2. The 29 most abundant tree species ≥10 cm DBH with an abundance ≥4 stems collected in eighteen 400 m2 plots of the LF and Non-LF sites (9 plots each) in Ben En National Park, Vietnam. Species are ranked in order of descending abundance (Nt) found in the two forest types. The codes of the 29 most common species were used in the CCA as expressed in Fig. 3
Family Species Code Forest type
Nt (n) LF (n/0.36 ha) Non-LF (n/0.36 ha)
Sapindaceae Pometia pinnata Pompin 10 13 23
Caesalpiniaceae Saraca dives Sardiv 19 0 19
Lauraceae Cinnamomum mairei Cinmai 10 7 17
Euphorbiaceae Koilodepas longifolium Koilon 16 0 16
Fagaceae Mellettia lasiopetala Mellas 5 10 15
Fagaceae Castanopsis annamensis Casann 12 1 13
Sapindaceae Mischocarpus oppositifolius Misopp 3 9 12
Ulmaceae Gironniera subaequalis Girsub 0 11 11
Lauraceae Actinodaphne obovata Actobo 11 0 11
Moraceae Streblus ilicifolius Strili 10 0 10
Sterculiaceae Pterospermum hetrophyllum Ptehet 9 0 9
Ulmaceae Gironniera cuspidata Gircus 0 9 9
Lauraceae Cinnamomum subavenium Cinsub 2 7 9
Lauraceae Cinnamomum parthenoxylon Cinpar 6 3 9
Caesalpiniaceae Erythrophleum fordii Eryfor 1 7 8
Lauraceae Caryodaphnopsis tonkinensis Carton 7 0 7
Meliaceae Dysoxylum cauliflorum Dyscau 5 2 7
Meliaceae Aglaia perviridis Aglper 5 1 6
Myrtaceae Syzygium chanlos Syzcha 1 5 6
Theaceae Schima superba Schsup 0 6 6
Ebenaceae Diospyros pilosula Diopil 5 0 5
Lauraceae Cryptocarya sp Crysp 5 0 5
Apocynaceae Wrightia laevis Wrilae 0 5 5
Verbenaceae Vitex trifolia Vittri 1 3 4
Meliaceae Aglaia dasyclada Agldas 0 4 4
Caesalpiniaceae Peltophorum tonkinensis Pelton 1 3 4
Lauraceae Cinnamomum tetragonum Cintet 0 4 4
Sapotaceae Sinosideroxylon racemosum Sinrac 1 3 4
Sapindaceae Amesiodendron chinense Amechi 2 2 4
were utilized.
Results
Tree abundance, basal area, and species richness The twenty-five sample plots at the LF site had a lower tree abundance than did the Non-LF site. A total of 146 species belonging to 39 families were encountered in fifty 400 m2 plots. Of these species and families sampled, 76 species representing 27 families and 114 species from 35 families were respectively sampled in the LF and Non-LF sites (Table 1). 44 species (about 30%) were common to
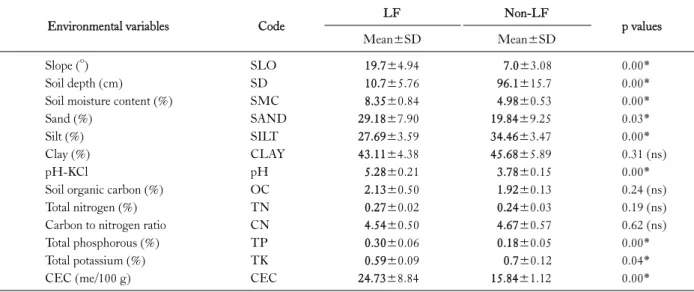
Table 3. The mean values and standard deviations of topographical factors and soil variables collected in the LF and Non-LF sites in Ben En National Park, Vietnam. The codes of the 13 environmental factors were used in the CCA as expressed in Fig. 3
Environmental variables Code LF Non-LF
p values
Mean±SD Mean±SD
Slope (o) SLO 19.7±4.94 7.0±3.08 0.00*
Soil depth (cm) SD 10.7±5.76 96.1±15.7 0.00*
Soil moisture content (%) SMC 8.35±0.84 4.98±0.53 0.00*
Sand (%) SAND 29.18±7.90 19.84±9.25 0.03*
Silt (%) SILT 27.69±3.59 34.46±3.47 0.00*
Clay (%) CLAY 43.11±4.38 45.68±5.89 0.31 (ns)
pH-KCl pH 5.28±0.21 3.78±0.15 0.00*
Soil organic carbon (%) OC 2.13±0.50 1.92±0.13 0.24 (ns)
Total nitrogen (%) TN 0.27±0.02 0.24±0.03 0.19 (ns)
Carbon to nitrogen ratio CN 4.54±0.50 4.67±0.57 0.62 (ns)
Total phosphorous (%) TP 0.30±0.06 0.18±0.05 0.00*
Total potassium (%) TK 0.59±0.09 0.7±0.12 0.04*
CEC (me/100 g) CEC 24.73±8.84 15.84±1.12 0.00*
ns, non-significant; *p<0.05.
both the LF and Non-LF, but 32 were exclusive to the for- mer and 70 to the latter (data not shown). In terms of the quantity of species, the most diverse family observed in both sites was Lauraceae with 16 (Non-LF) and 12 (LF) species. At the former site, Fagaceae, Meliaceae, and Moraceae ranked second with nine species, followed by Magnoliaceae (six species). The family with the largest number of species in the LF was Lauraceae with nine spe- cies; the next two families with the largest number of spe- cies were Caesalpiniaceae, Fagaceae, Meliaceae, and Sapindaceae represented by five species (data not shown).
29 most common species used in the CCA are given in Table 2. Altogether, 12 families were represented by one species and the remaining families were found to have two to three representative species each.
Features of topographic and soil variables
The mean values and standard deviation of the 13 envi- ronmental variables collected in the Non-LF and LF sites which can be broken down into topographic (2) and soil variables (11) is given in Table 3. The two forest types showed significant differences in eight of the 13 environ- mental factors, e.g., in the slope and soil depth (t-Test, p
<0.05), where the LF presented higher degrees of slope than did the Non-LF. The differences in soil properties be-
tween the two study sites were quite notable, suggesting that other environmental factors have a role in determining the soil nutrient availability. The soils of the Non-LF and LF were different in texture; there were significant statistical differences in sand and silt contents (t-Test, p<0.05). The proportion of clay was higher in the Non-LF but the differ- ence was statistically insignificant (t-Test, p>0.05); differ- ences in soil moisture content were, however, significant.
In regards to chemical properties, the soil pH values of both forest sites were low, indicating high acidity at the Non-LF and LF sites. The soil pH obtained in the latter site was significantly higher than that of the former (t-Test, p<0.05). In paired comparisons, significant differences in the total phosphorous and CEC (t-Test, p<0.05) were found between the two forest types; the similar result was found in total potassium (t-Test, p<0.05). A total nitrogen value recorded in the soil of the Non-LF site was similar to that of the LF; there were thus no significant differences in this feature (t-Test, p>0.05).
The relationship between the presence/abundance of tree species and environmental variables
The CCA’s results using the tree abundance of the 29 most common tree species are presented in Table 4. Accor- ding to this table, the CCA showed strong correlations be-
Table 5. The correlation matrix calculated by the Spearman rank order between 13 environmental variables and the first three axes of the 18 sample plots collected in the LF and Non-LF sites in Ben En National Park, Vietnam. The full names of the 13 environmental variables and their units are listed in Table 3
Factor Axis
Slope SD SMC Sand Silt Clay pH OC TN CN TP TK CEC
1 2 3
Slope 0.89 0.13 -0.02 1.00 SD -0.70 0.36 0.22 -0.70 1.00 SMC 0.85 -0.02 -0.38 0.78 -0.75 1.00 Sand 0.22 -0.25 0.31 0.28 -0.28 0.04 1.00 Silt -0.54 0.13 -0.25 -0.60 0.60 -0.37 -0.87 1.00 Clay -0.12 0.36 -0.32 -0.17 0.23 0.05 -0.96 0.75 1.00 pH 0.77 0.14 -0.11 0.78 -0.73 0.84 0.28 -0.59 -0.18 1.00 OC 0.09 -0.05 -0.72 0.02 -0.16 0.35 -0.38 0.27 0.36 0.29 1.00 TN 0.21 -0.14 -0.64 0.15 -0.32 0.37 -0.04 -0.06 0.03 0.39 0.92 1.00 CN -0.02 0.32 -0.24 -0.17 0.17 0.19 -0.84 0.68 0.85 0.03 0.41 0.11 1.00 TP 0.71 -0.13 -0.13 0.71 -0.64 0.68 0.69 -0.78 -0.62 0.67 -0.06 0.20 -0.47 1.00 TK -0.37 0.37 0.05 -0.43 0.44 -0.26 -0.76 0.71 0.73 -0.18 0.34 0.07 0.82 -0.77 1.00 CEC 0.65 -0.05 -0.64 0.59 -0.67 0.86 0.11 -0.35 -0.05 0.76 0.65 0.73 0.08 0.67 -0.27 1.00 Table 4. Eigenvalues and the amount of variance explained by the
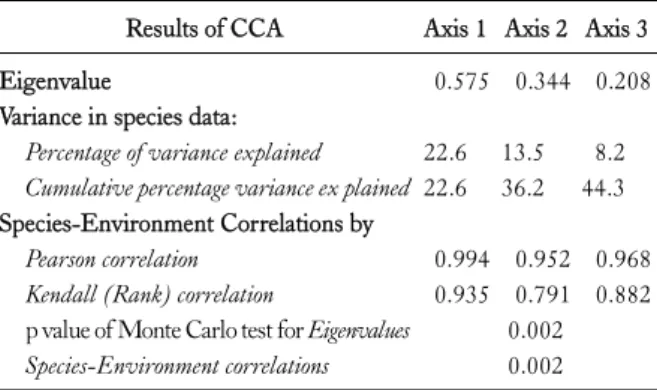
species/species-environment correlations of the first three CCA ax- es for the distribution and abundance of tree species in the LF and Non-LF sites in Ben En National Park, Vietnam
Results of CCA Axis 1 Axis 2 Axis 3
Eigenvalue 0.575 0.344 0.208
Variance in species data:
Percentage of variance explained 22.6 13.5 8.2 Cumulative percentage variance ex plained 22.6 36.2 44.3 Species-Environment Correlations by
Pearson correlation 0.994 0.952 0.968
Kendall (Rank) correlation 0.935 0.791 0.882 p value of Monte Carlo test for Eigenvalues 0.002 Species-Environment correlations 0.002
tween species frequency and the environmental variables.
At a respective 0.575 and 0.336 accounting for 22.6% and 13.5% of variation in species composition, the eigenvalues for the first two axes were very high; they were thus good predictors of species distribution and abundance. The ei- genvalue for the third axis was 0.208 and accounted for 8.2% of the variation in the species data set. It is clear, then, that the axis 1 value signaled the highest change in vegeta- tion structure. The Monte-Carlo permutation test in- dicated a significant difference between the eigenvalues of
the ordination axes (p<0.01) and the species-environment correlations calculated for the first three axes of the CCA were high. The correlation between the first axis and the species-environment variables revealed by the Pearson and Kendall correlation was a respective 0.99 and 0.93. Similarly, the species-environment correlations of the second axis checked by the two aforementioned correlations were 0.95 and 0.79, respectively. A Monte-Carlo permutation test showed that the vegetation-environment relationships dis- tinguished by all axes were highly significant (p<0.01).
These parameters suggest that the forest-environment rela- tionship was well explained by the CCA.
The correlation matrix of the environmental variables collected in the 18 sample plots of the Non-LF and LF is listed in Table 5. A correlative analysis of the 13 environ- mental variables in the study sites demonstrated that slope was significantly and positively correlated with the SMC and soil pH, while soil depth negatively correlated with these factors. Soil texture significantly and positively related to the carbon to nitrogen ratio, total phosphorous, and total potassium. There was a significant positive correlation be- tween the CEC and soil pH, soil organic carbon, and total nitrogen, but a negative correlation with soil depth.
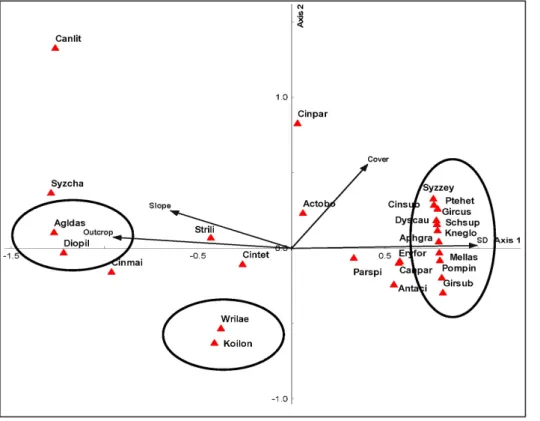
The relationship between the distribution and abun- dance of the 29 most dominant tree species and environ-
Fig. 3. A CCA ordination dia- grams of the 29 most dominant tree species and 13 environmental variables of the first two ordination axes in Ben En National Park, Vietnam. Quantitative environ- mental variables are indicated by arrows, quadrilaterals stand for tree species, and sample plots are represented by red dots in the limestone forest, asterisks in the non-limestone forest. The codes referring to species and environ- mental factors were listed in Tables 2 and 3, respectively.
mental factors measured in 18 sample plots across the two forest types is presented in the CCA ordination diagrams (Fig. 3). It is clear that different species saw different dis- tribution patterns within the sample plots. The CCA spe- cies ordination suggests that a number of species were re- stricted to the limestone forest site. Several species includ- ing Saraca dives, Pterospermum hetrophyllum, Castanopsis an- namensis, and Cryptocarya sp were strongly associated with soil pH, soil moisture content, and slope which meant that they were more frequent in sample plots with high levels of these factors. The total potassium vector was strongly cor- related with the occurrence of such species as Wrightia lae- vis, and Erythrophleum fordii, furthermore, Cinnamomum tetragonum and Gironniera subaequalis seemed to be influ- enced by the vector of soil depth. In contrast, six of the 29 species (Pometia pinnata, Amesiodendron chinense, Gironniera cuspidate, Peltophorum tonkinensis, Cinnamomum mairei,
Cinnamomum parthenoxylon) were influenced by neither the soil properties nor the topographic variables.
Variation in the abundance and distribution of re- generation as a result of physical factors
Among regeneration species, the 26 most common tree species from 15 families were examined in a canonical corre- spondence analysis; the list of species examined is given in Table 6. Many, such as Gironniera cuspidate, Syzygium chanlos, Knema globularia, and Cinnamomum subavenium, had a high- er abundance in the Non-LF site; in contrast, Diospyros pi- losula, Streblus ilicifolius, and Koilodepas longifolium were dominant in the LF site.
The physical variables explained most of the species abun- dance as shown by the CCA results (Table 7 and Fig. 4).
The eigenvalues of the first, second, and third axes were 0.657, 0.072, and 0.061, respectively; the species-environ-
Table 6. The 26 most abundant tree species with an abundance ≥10 individuals, as collected in the LF and Non-LF sites (twenty-five 40 m2 strip-plots each) in Ben En National Park, Vietnam. Species are ranked via descending abundance (Nt) found in both sites. The codes of the 26 most common species were used in the CCA (Fig. 2)
Species Family Code LF (n/0.1 ha) Non-LF (n/0.1 ha) Nt (n)
Diospyros pilosula Ebenaceae Diopil 72 1 73
Pometia pinnata Sapindaceae Pompin 22 22 44
Streblus ilicifolius Moraceae Strili 28 0 28
Cinnamomum parthenoxylon Lauraceae Cinpar 3 23 26
Gironniera cuspidata Ulmaceae Gircus 0 24 24
Schima superba Theaceae Schsup 3 19 22
Syzygium chanlos Myrtaceae Syzcha 0 21 21
Gironniera subaequalis Ulmaceae Girsub 0 20 20
Cinnamomum mairei Lauraceae Cinmai 12 7 19
Aphanamixis grandifolia Meliaceae Aphgra 0 18 18
Knema globularia Myristicaceae Kneglo 0 18 18
Cinnamomum subavenium Lauraceae Cinsub 0 18 18
Aglaia dasyclada Meliaceae Agldas 0 16 16
Koilodepas longifolium Euphorbiaceae Koilon 16 0 16
Pterospermum hetrophyllum Sterculiaceae Ptehet 14 2 16
Syzygium zeylanicum Myrtaceae Syzzey 0 16 16
Erythrophleum fordii Caesalpiniaceae Eryfor 0 15 15
Wrightia laevis Apocynaceae Wrilae 2 11 13
Antidesma acidum Euphorbiaceae Antaci 0 12 12
Paranephelium spirei Sapindaceae Parspi 4 8 12
Mellettia lasiopetala Fagaceae Mellas 4 7 11
Canarium littorale Burseraceae Canlit 7 4 11
Dysoxylum cauliflorum Meliaceae Dyscau 6 4 10
Cinnamomum tetragonum Lauraceae Cintet 0 10 10
Actinodaphne obovata Lauraceae Actobo 6 4 10
Canarium parvum Burseraceae Canpar 2 8 10
Table 7. The eigenvalues, amount of variance explained by the spe- cies data, species-environment relation, and species-environment cor- relations of the first three CCA axes for the regeneration of regeneration species in the LF and Non-LF sites in Ben En National Park, Vietnam
Results of CCA Axis 1 Axis 2 Axis 3
Eigenvalue 0.657 0.072 0.061
Variance in species data:
Percentage of variance explained 18.4 2.0 1.7 Cumulative percentage variance explained 18.4 20.5 22.2 Species-Environment Correlations by
Pearson correlation 0.959 0.603 0.566
p value of Monte Carlo test 0.002 0.002 0.002
ment correlations yielded by these axes were 0.959, 0.603, and 0.566, and their cumulative percentage variances were 18.4%, 20.5%, and 22.2%. These values, along with the re-
sults of the Monte Carlo test (p<0.01), indicated a highly significant correlation between physical variables and the species abundance of seedlings and saplings.
Spearman’s correlation (Table 8) indicates that the soil depth, slope, and rocky outcrop significantly correlated with the first axis (p<0.05). The slope, tree abundance, and total herbaceous coverage also significantly correlated with the third axis, while only the ground vegetation cover- age correlated with the second one (p<0.05).
According to the CCA ordination diagram (Fig. 4), a significant relationship was revealed between the abun- dance and uneven distribution of regeneration and the physical variables measured in the Non-LF and LF sites.
The effects of different physical factors varied among spe- cies, but most were clustered on the right (negative) side of Axis 1. The most distinct group was formed in plots with
Fig. 4. Canonical correspondence analysis ordination diagrams in two dimensional attribute spaces of the 26 most dominant tree regenera- tions of seedlings/saplings and six physical variables in Ben En National Park, Vietnam. The co- des referring to species and phys- ical factors were listed in Tables 6 and 8, respectively.
Table 8. The correlation matrix calculated by the Spearman rank order between six physical variables and the first three axes of fifty strip-plots collected in the LF and Non-LF sites in Ben En National Park, Vietnam
Axis Slope
(o)
Soil depth (SD, cm)
Outcrop (%)
BA (m2/400 m2)
Tree abundance (N/400 m2)
Cover
1 2 3 (%)
Slope (o) -0.61 0.15 0.49 1.00
Soil depth (SD, cm) 0.77 -0.05 -0.20 -0.77 1.00
Outcrop (%) -0.75 0.12 0.20 0.77 -0.99 1.00
BA (m2/400 m2) 0.08 0.21 0.29 -0.14 0.24 -0.26 1.00
Tree abundance (N/400 m2) -0.25 0.21 -0.43 -0.08 0.00 0.00 0.00 1.00
Cover (%) 0.09 0.58 -0.45 -0.47 0.50 -0.45 0.21 0.04 1.00
higher soil depth, less rocky outcrop, and low slope, which means that the increase in soil depth appears to enhance the occurrence of these regeneration. In contrast, the occur- rence of several tree species such as Diospyros pilosula and Aglaia dasyclada was positively correlated with higher slope and rocky outcrop. Unlike the abovementioned species, Cinnamomum parthenoxylon seemed to prefer plots with a relatively high amount of ground vegetation coverage;
Koilodepas longifolium and Wrightia laevis were not influ- enced by any physical variables.
Discussion and Conclusion
Effects of topographic variables on the abundance and presence of tree species
Topography has numerous effects on the environment;
for example, it influences vegetation and soil (Chahouki et al. 2012) and predicts tree species composition and tree abundance (Valencia et al. 2004). Other environmental fac- tors such as aspect and slope affect plant community struc- ture (Amezaga et al. 2004); indeed, one study indicated
that slope had a significant effect on the composition and tree abundance of tree species (Mohtashamnia et al. 2011).
In regards to both the distribution of species composition and the relationship between slope and tree abundance, the results of this study were well in keeping with those con- clusions reached by other researchers. In two Israeli sites differing in the climatic and edaphic conditions of various woody life forms of eastern Mediterranean plant commun- ities, species composition and richness differed significantly between north and south-facing slopes (Sternberg and Shoshany 2001). A study carried out in natural mixed forest stands in the Eastern Black Sea region of Turkey found that geomorphology features (e.g., elevation, slope, and aspect) strongly influenced tree species diversity and composition in the forests (Ozcelik et al. 2008). A similar finding also observed that terrain variables including altitude and slope affected the moisture regime and soil formation processes;
consequently, there was a lower tree diversity to be found on steeper slopes and at higher elevation (Kebede et al. 2013).
Effects of soil properties on the abundance and presence of tree species
Soil is one of the most crucial components influencing vegetation (Chahouki et al. 2012) and as a result, changes in species composition among forests may be due to edaphic factors (Swamy et al. 2000); however changes in vegetation are mainly the result of soil properties in lowland forests (Arekhi et al. 2010). Ordination analyses for the LF and Non-LF sites revealed a close relationship between soil fac- tors and tree species abundance/distribution. It is apparent that the distribution and abundance of tree species is de- termined by topography and soil properties (Clark et al.
1998). In the present study, the CCA’s results demon- strated that of the environmental factors (i.e., the topo- graphic and edaphic variables), the presence and abundance of tree species were most strongly correlated with several soil characteristics consisting of soil pH, soil moisture content, soil texture, total phosphorous, and total potassium. The re- sults indicated that Cinnamomum tetragonum and Gironniera subaequalis were strongly influenced by soil depth which comes as no surprise as soil is an essential factor given its effect on the availability of moisture for plants (Chahouki et al. 2012).
Soil moisture content has many effects on the dis- tribution of vegetation groups and plant species (Tavili et al.
2009). The CCA results expressing the magnitude of soil moisture in the present study have been confirmed by Lyon and Sagers (2003) who used multivariate analysis and ordi- nations to characterize the composition and distribution of woody vegetation within the Ozark National Scenic Riverways (ONSR), Missouri, USA. Soil moisture as a factor influencing the distribution of plant species has been reported by further studies conducted in a coastal desert plain of Southern Sinai, Egypt (El-Ghani and Amer 2003);
similarly, it may be responsible for such evergreen species as Xanthophyllum flavescens, Ixora brachiata, and Dimocarpus longan in the low-elevation forests in the Western Ghats of Tamil Nadu, India (Swamy et al. 2000).
The CCA results of the present study indicate that the tree abundance and distribution of Saraca dives, Pterospermum hetrophyllum, Castanopsis annamensis, and Cryptocarya sp were strongly associated with a higher soil pH, whereas Pometia pinnata, Vitex trifolia, and Amesiodendron chinense’s abundance and presence were not associated with soil fertility. These findings also demonstrated the importance of pH in the top soil layers for plant species distribution, an observation was in keeping with the reports of several other authors who have discussed at length the variation in spe- cies composition and distribution as a result of soil pH.
Tanner (1977), for example, noted that the limiting factor in the Mor Ridge forest, one of four montane rain forests of Jamaica, was the extremely low pH. A close relationship be- tween plant species composition and soil chemistry (pH and organic carbon) was also explored in an inland arid des- ert of Egypt (Abd El-Ghani 1998); likewise, Zhang et al.
(2005) suggested secondary botanical gradients relating to pH and soil moisture in the China’s Tarim River, Southern Xinjiang,. Further studies implemented in the Tianshan Mountains, China confirmed that soil pH was one of the main factors determining the development and affecting the distribution of vegetation (Lou and Zhou 2001; Xu et al.
2006; Zhang et al. 2012).
Variation in the regeneration abundance and dis- tribution of tree species related to physical variables The natural regeneration of a species is a process de- pendent on various genetic and environmental factors (Felfili 1997) and is as such a crucial factor in determining forest structure for sustainable forest management (Montes
et al. 2007). A forest’s regeneration is essentially controlled by four groups of potentially limiting factors: disturbances, site resources, weed competition, and plants (Hardwick et al. 2000). It is clear that environmental conditions have a complex effect on the establishment and survival of seed- lings has been clearly documented by Topoliantz and Ponge (2000) among others; a pattern of regeneration abundance, for example, seems to be related mainly to the climate (Silva et al. 2012) in connection with local factors spanning alti- tude, topography, soil and slope (Felfili 1997; Figueroa- Rangel and Olvera-Vargas 2000; Silva et al. 2012).
Other factors such as forest structure (basal area, stand abundance, and canopy), gap characteristics, and vegeta- tion play a crucial role in structuring regeneration com- munities (Park et al. 2005). Most of the seedlings/saplings were related to forest types or the developmental stage, which consisted of the basal area and stand abundance of forests along with several environmental factors, e.g., soil moisture and light (Asanok et al. 2013). It is generally rec- ognized that the species richness of seedlings is positively associated with species abundance (Denslow and Guzman G 2000); the species composition of regeneration commun- ities in harvested areas appears determined by a complex as- sortment of environmental factors (Park et al. 2005). The ground flora, especially natural regeneration, may take ad- vantage of any canopy openings (Madsen and Larsen 1997). The effects of the canopy density or the over-storey stand structure may have on the stand itself are among the most important factors for controlling both.
The CCA’s results in this study indicated that the effect of the different physical factors varied among regeneration species. The results in Fig. 4 indicate that most species were clustered on the right side of Axis 1; the most distinct group was formed by those plots with higher soil depth, less rocky outcrop, and lower slope. This means that increasing the soil depth enhances the occurrence of these regeneration. In contrast, the occurrence of several tree species such as Koilodepas longifolium and Aglaia dasyclada was positively correlated with higher slope and rocky outcrop. Variations in slope were obvious and their effects on sapling abundance were apparent insofar as they affected the maintenance and germination of seeds in soils (Zhang and Zhang 2007).
Unlike the species mentioned above, Cinnamomum parthe- noxylon seemed to prefer plots with a relatively higher
amount of ground vegetation coverage, this assumption is in accordance with a further study conducted on Crannach Hill, Aberdeenshire, Scotland where, Rao et al. (2003) found that taller saplings occurred in higher and denser un- derstorey vegetation. However, Chapman and Chapman (1997) documented that when a dense shrub layer is estab- lished, it may inhibit seedling and sapling survival; it, there- fore, appears that there was much lower recruitment into the sapling class in logged areas as opposed to unlogged ones.
The distribution and abundance of regeneration were af- fected by many factors and as such varied among species.
Most of the regeneration were related to forest types which consisted of the basal area and stand abundance of forests along with several environmental factors, e.g., soil moisture and light (Asanok et al. 2013). It is generally recognized that the species richness of seedlings is positively associated with species abundance (Denslow and Guzman G 2000);
the species composition of regeneration communities in harvested areas appears determined by a complex assort- ment of environmental factors (Park et al. 2005). The re- stricted distribution and range of the occurrence of species can be explained by the presence of steep ecological gra- dients including soil moisture, organic matter, exchange- able cations, soil pH, and temperature (Tesfaye et al. 2002).
Differences in topography, slope, and altitudes among clus- ters contribute to differences in seedling species composi- tion (Figueroa-Rangel and Olvera-Vargas 2000). In addi- tion, the topographic gradient and ground water table level directly influence the pattern of a species’ establishment in each forest (Marimon et al. 2010). Human disturbances could further influence seed dispersal mechanisms, fruiting, germination, and regeneration (Omeja 2004).
Conclusion
Our analysis based on a systematic design may have been constrained by lack of observations. 18 sample plots plus 18 soil sample collected in the two undisturbed forest types lo- cated in restrictly protected zone, while this may reflect cur- rent conditions, they does not facilitate detailed statistical analysis. We have realized that the main restriction of this study is constrained by pseudo-replication which is one of the most influential methodological issues in ecological research. From this point, investigations in this study will be
a preliminary knowledge for exploring the spatial relation- ship between environmental variables and tree species dis- tribution of an undisturbed tropical limestone/non-lime- stone forest. Further studies of other areas with similar char- acteristics in the National Park would be very welcome in order to draw more general conclusions. Other methods that may have been employed, such as line distance sampling, are believed to be more efficient and are recommended for a better understanding of tree species distribution/abundance and environmental factors in such areas.
The preliminary results of the ordination analysis re- vealed a close relationship between environmental factors and the abundance/presence of tree species in such an un- disturbed limestone/non-limestone forest. The distribution of the tree species was closely related to edaphic and topo- graphic factors; soil was the most crucial factor for forest composition, and these results emphasized the importance of the soil’s physical and chemical properties in influencing tree species distribution. Significant differences between limestone and non-limestone forests were observed in terms of tree species composition, diversity, and dominance; it is believed that variation in soil characteristics between the two forest types influences the distribution of the forests’ tree communities. Saraca dives, Diospyros pilosula and Koilodepas longifolium were the most dominant in the limestone forest, whereas Gironniera subaequalis, Gironniera cuspidate, Erythro- phleum fordii, and Wrightia laevis dominated in the non-limestone forest. It appears that the distribution of tree species in the both sites was determined by soil pH, SMC, slope, and soil texture. Differences in tree species dis- tribution observed over the gradients of a soil’s physical/
chemical properties, as well other environmental factors such as slope, should be taken into account when designing management strategies in the undisturbed limestone/non- limestone forest of the park.
Acknowledgements
We wish to thank all the people who contributed to this work, especially Mr. Nguyen Van Thang and Mr. Le Van Son for their help in the field. The authors are also grateful to the Research Institute for Forest Ecology and Environment under the Vietnamese Academy of Forest Sciences for the soil analyses. Thanks also go out to Prof.
Dr. J. Sabororwski and Dr. Cao Thi Thu Hien, Department of informatics, Biometrics and Forest Growth, and Ms. Dao Thi Hoa Hong who provided us with stat- istical advice at times of critical need.
References
Abd El-Ghani MM. 1998. Environmental correlates of species distribution in arid desert ecosystems of eastern Egypt. Journal of Arid Environments 38: 297-313.
Amezaga I, Mendarte S, Albizu I, Besga G, Garbisu C, Onaindia M. 2004. Grazing intensity, aspect, and slope effects on lime- stone grassland structure. Rangeland Ecology & Management 57: 606.
Anru L, Guofa Z. 2001. Relationships between environment and spatial pattern of vegetation types in the mid tianshan mountains. Acta Phytoecological Sinica 25: 385-391.
Arekhi S, Heydari M, Pourbabaei H. 2010. Vegetation-Environmental relationships and ecological species groups of the ilam oak forest landscape, Iran. Caspian J Env Sci 8: 115-125.
Asanok L, Marod D, Duengkae P, Pranmongkol U, Kurokawa H, Aiba M, Katabuchi M, Nakashizuka T. 2013. Relationships be- tween functional traits and the ability of forest tree species to re- establish in secondary forest and enrichment plantations in the uplands of northern Thailand. For Ecol Manage 296: 9-23.
Chahouki MAZ, Khojasteh F, Tavili A. 2012. Distribution of vege- tation type according to edaphic properties and topography in Iran. Pol J Environ Stud 21: 1071-1077
Chiarucci A, Rocchini D, Leonzio C, De Dominicis V. 2001. A test of vegetation-environment relationship in serpentine soils of Tuscany, Italy. Ecological Research 16: 627-639.
Clark DB, Clark DA, Read JM. 1998. Edaphic variation and the mesoscale distribution of tree species in a neotropical rain forest.
Journal of Ecology 86: 101-112.
Denslow JS, Guzman G S. 2000. Variation in stand structure, light and seedling abundance across a tropical moist forest chronose- quence, Panama. Journal of Vegetation Science 11: 201-212.
Eilu G, Hafashimana DLN, Kasenene JM. 2004. Density and species diversity of trees in four tropical forests of the Albertine rift, western Uganda. Diversity & Distributions 10: 303-312.
El-Ghani MMA, Amer WM. 2003. Soil-vegetation relationships in a coastal desert plain of southern Sinai, Egypt. Journal of Arid Environments 55: 607-628.
Enright NJ, Miller BP, Akhter R. 2005. Desert vegetation and vegetation-environment relationships in Kirthar National Park, Sindh, Pakistan. Journal of Arid Environments 61: 397-418.
FAO. 2006. Guidelines for soil description. Food and Agriculture Organization of the United Nations, Rome.
Felfili JM. 1997. Dynamics of the natural regeneration in the Gama gallery forest in central Brazil. Forest Ecology and Management 91: 235-245.
Figueroa-Rangel BL, Olvera-Vargas M. 2000. Regeneration pat- terns in relation to canopy species composition and site variables in mixed oak forests in the Sierra de Manantlán Biosphere Reserve, Mexico. Ecological Research 15: 249-261.
Guisan A, Zimmermann NE. 2000. Predictive habitat distribution models in ecology. Ecological Modelling 135: 147-186.
Hardwick K, Healey J, Blakesley D. 2000. Research needs for the ecology of natural regeneration of seasonally dry tropical forest in southeast Asia. In: Forest restoration for wildlife conservation (Elliott S, Kerby J, Blakesley D, Hardwick K, Woods K, Anusarnsunthorn V, eds). International Tropical Timber Organisation, Chiang Mai, Thailand, pp 165-179.
He MZ, Zheng JG, Li XR, Qian YL. 2007. Environmental fac- tors affecting vegetation composition in the Alxa Plateau, China.
Journal of Arid Environments 69: 473-489.
Hejcmanova-Nezerková P, Hejcman M. 2006. A canonical corre- spondence analysis (CCA) of the vegetation and environment relationships in Sudanese savannah, Senegal. South African Journal of Botany 72: 256-262.
Hoang VS, Baas P, Keβler PJA. 2008. Plant biodiversity in Ben En National Park, Vietnam. Agricultural Publishing House, Hanoi, Vietnam.
Hoang VS, Baas P, Keβler PJA, Slik JWF, Steege HT, Raes N.
2011. Human and environmental influences on plant diversity and composition in Ben En National Park, Vietnam. Journal of Tropical Forest Science 23: 328-337.
Huang KY. 2002. Evaluation of the topographic sheltering effects on the spatial pattern of Taiwan fir using aerial photography and GIS. International Journal of Remote Sensing 23: 2051-2069.
Jabeen T, Ahmad SS. 2009. Multivariate analysis of environmental and vegetation data of Ayub National Park Rawalpindi. Soil &
Environment 28: 106-112.
Jha CS, Singh JS. 1990. Composition and dynamics of dry tropical forest in relation to soil texture. Journal of Vegetation Science 1:
609-614.
Jones MM, Tuomisto H, Clark DB, Olivas P. 2006. Effects of mesoscale environmental heterogeneity and dispersal limitation on floristic variation in rain forest ferns. Journal of Ecology 94:
181-195.
Kebede M, Kanninen M, Yirdaw E, Lemenih M. 2013. Vegetation structural characteristics and topographic factors in the remnant moist Afromontane forest of Wondo Genet, south central Ethiopia. Journal of Forestry Research 24: 419-430.
Kelly BJ, Wilson JB, Mark AF. 1989. Causes of the species-area re- lation: a study of islands in lake Manapouri, New Zealand.
Journal of Ecology 77: 1021-1028.
Kiianmaa S. 2005. Natural regeneration and ecological succession in Pinus kesiya watershed plantations in northern Thailand: im- plications for plantation management. MS thesis. University of Helsinki, Helsinki, Finland.
Kulla L, Merganič J, Marušák R. 2009. Analysis of natural re- generation in declining spruce forests on the Slovak part of the
Beskydy Mts. Beskydy 2: 51-62.
Lan G, Hu Y, Cao M, Zhu H. 2011. Topography related spatial distribution of dominant tree species in a tropical seasonal rain forest in China. Forest Ecology and Management 262: 1507- 1513.
Lu XT, Yin JX, Tang JW. 2010. Structure, tree species diversity and composition of tropical seasonal rainforests in Xishuangbanna, South-West China. Journal of Tropical Forest Science 22: 260-270.
Lyon J, Sagers C. 2003. Correspondence analysis of functional groups in a riparian landscape. Plant Ecology 164: 171-183.
Madsen P, Larsen JB. 1997. Natural regeneration of beech (Fagus sylvatica L.) with respect to canopy density, soil moisture and soil carbon content. Forest Ecology and Management 97:
95-105.
Marimon BS, Felfili JM, Lima EdS, Duarte WMG, Marimon-Júnior BH. 2010. Environmental determinants for natural regeneration of gallery forest at the Cerrado/Amazonia boundaries in Brazil. Acta Amazonica 40: 107-118.
Merkle J. 1951. An analysis of the plant communities of Mary's peak, Western Oregon. Ecology 32: 618-640.
Mohtashamnia S, Zahedi G, Arzani H. 2011. Multivariate analy- sis of rangeland vegetation in relation to edaphical and physio- graphical factors. Procedia Environmental Sciences 7: 305-310.
Montes F, Pardos M, Canellas I. 2007. The effect of stand struc- ture on the regeneration of Scots Pine stands. Forest Biometry, Modelling and Information Sciences 1: 1-9.
Nirmal Kumar JI, Patel K, Kumar RN, Kumar Bhoi R. 2011.
Forest structure, diversity and soil properties in a dry tropical forest in Rajasthan, Western India. Annals of Forest Research 54: 89-98.
Omeja P, Obua J, Cunningham AB. 2004. Regeneration, density and size class distribution of tree species used for drum making in central Uganda. African journal of ecology 42: 129-136.
Ozcelik R, GuI AU, Merganic J, Merganicova K. 2008. Tree spe- cies diversity and its relationship to stand parameters and geo- morphology features in the eastern Black sea region forests of Turkey. Journal of environmental biology 29: 291-298.
Park A, Joaquin Justiniano M, Fredericksen TS. 2005. Natural re- generation and environmental relationships of tree species in logging gaps in a Bolivian tropical forest. Forest Ecology and Management 217: 147-157.
Pärtel M, Helm A, Ingerpuu N, Reier Ü, Tuvi E-L. 2004.
Conservation of Northern European plant diversity: the corre- spondence with soil pH. Biological Conservation 120: 525-531.
Peng W, Song T, Zeng F, Wang K, Du H, Lu S. 2012.
Relationships between woody plants and environmental factors in karst mixed evergreen-deciduous broadleaf forest, southwest China. Journal of Food, Agriculture & Environment 10:
890-896.
Pinto JRR, Oliveira-Filho AT, Hay JDV. 2005. Influence of soile and topography on the composition of a tree community in a
central Brazilian valley forest. Edinburgh Journal of Botany 62:
69-90.
Rana CS, Gairola S. 2009. Forest community structure and compo- sition along an elevational gradient of parshuram kund area in lohit district of arunachal pradesh, India. Nature and Science 1:
44-52.
Sharma CM, Suyal S, Gairola S, Ghildiyal SK. 2009. Species rich- ness and diversity along an altitudinal gradient in moist temper- ate forest of Himalya. Joural of American Science 5: 119-128.
Silva D, Rezende Mazzella P, Legay M, Corcket E, Dupouey JL.
2012. Does natural regeneration determine the limit of European beech distribution under climatic stress? Forest Ecology and Management 266: 263-272.
Souza JP, Araújo GM, Haridasan M. 2007. Influence of soil fertil- ity on the distribution of tree species in a deciduous forest in the Triângulo Mineiro region of Brazil. Plant Ecology 191: 253-263.
Sternberg M, Shoshany M. 2001. Influence of slope aspect on Mediterranean woody formations: comparison of a semiarid and an arid site in Israel. Ecological Research 16: 335-345.
Suratman MN, Kusin M, Yamani Zakaria SAK, Saleh K, Ahmad M, Bahari SA. 2010. Stand structure and species diversity of Keniam forest, Pahang National Park. Science and Social Research (CSSR), 2010 International Conference on, Kuala Lumpur, Malaysia, pp 766-771.
Swamy PS, Sundarapandian SM, Chandrasekar P, Chandrasekaran S. 2000. Plant species diversity and tree population structure of a humid tropical forest in Tamil Nadu, India. Biodiversity &
Conservation 9: 1643-1669.
Tavili A, Rostampour M, Zare Chahouki MA, Farzadmehr J.
2009. CCA application for vegetation - environment relation-
ships evaluation in arid environments (southern Khorasan ran- gelands). Desert 14: 101-111.
Tesfaye G, Teketay D, Fetene M. 2002. Regeneration of fourteen tree species in Harenna forest, southeastern Ethiopia. Flora - Morphology, Distribution, Functional Ecology of Plants 197:
461-474.
Topoliantz S, Ponge J-F. 2000. Influence of site conditions on the survival of Fagus sylvatica seedlings in an old-growth beech forest. Journal of Vegetation Science 11: 369-374.
Valencia R, Foster RB, Villa G, Condit R, Svenning J-C, Hernández C, Romoleroux K, Losos E, Magård E, Balslev H.
2004. Tree species distributions and local habitat variation in the Amazon: large forest plot in eastern Ecuador. Journal of Ecology 92: 214-229.
Xu L, Liu H, Chu X, Su K. 2006. Desert vegetation patterns at the northern foot of Tianshan Mountains: The role of soil conditions.
Flora - Morphology, Distribution, Functional Ecology of Plants 201: 44-50.
Zhang H, Qian Y, Wu Z, Wang Z. 2012. Vegetation-environment relationships between northern slope of Karlik Mountain and Naomaohu Basin, East Tianshan Mountains. Chinese Geographical Science 22: 288-301.
Zhang JT, Zhang F. 2007. Diversity and composition of plant func- tional groups in mountain forests of the Lishan Nature Reserve, North China. Botanical Studies 48: 339-348.
Zhang JT, Zhang F. 2011. Ecological relations between forest com- munities and environmental variables in the Lishan Mountain Nature Reserve, China. African journal of Agricultural Rresearch 6: 248-259.