Environmental Science
Vol. 37, No. 2, pp. 128-140, June, 2021 https://doi.org/10.7747/JFES.2021.37.2.128
Estimation of Biomass and Carbon Stocks of Trees in Javadhu Hills, Eastern Ghats, India
Balaraman Tamilselvan
1, Thangavel Sekar
1and Munisamy Anbarashan
2,*
1PG & Research Department of Botany, Pachaiyappa’s College, Tamil Nadu, Chennai 600030, India
2Department of Ecology, French Institute of Pondicherry, Puducherry 605001, India
Abstract
Tropical dry forests are one of the most threatened, widely distributed ecosystems in tropics and estimation of forest biomass is a crucial component of global carbon emission estimation. Therefore, the present study was aimed to quantify the biomass and carbon storage in trees on large scale (10, 1 ha plots) in the dry mixed evergreen forest of Javadhu forest of Eastern Ghats. Biomass of adult (≥10 cm DBH) trees was estimated by non-harvest methods. The total biomass of trees in this tropical dry mixed evergreen forest was ranged from 160.02 to 250.8 Mg/ha, with a mean of 202.04±24.64 Mg/ha. Among the 62 tree species enumerated, Memecylon umbellatum accumulated greater biomass and carbon stocks (24.29%) more than the other species in the 10 ha study plots. ANOVA revealed that there existed a significant variation in the total biomass and carbon stock among the three plant types (Evergreen, brevi-deciduous and deciduous (F (2, 17)=15.343, p<0.001). Basal area and density was significant positively correlated with aboveground biomass (R2 0.980;
0.680) while species richness exhibited negative correlation with above ground biomass (R2 0.167). Finding of present study may be interpreted as most of the trees in this forest are yet to be matured and there is a net addition to standing biomass leading to carbon storage.
Key Words: biomass estimation, climate change, tropical dry forest, Eastern Ghats, carbon mitigation
Received: November 6, 2020. Revised: March 10, 2021. Accepted: April 22, 2021.
Corresponding author: Munisamy Anbarashan
Department of Ecology, French Institute of Pondicherry, Puducherry 605001, India Tel: +91-413-2231616, Fax: +91-413-2231605, E-mail: [email protected]
Introduction
Tropical forests span only about 15% of Earth’s surface, but serve as hotspots for both biodiversity and carbon. They act as sinks for around 40% of global terrestrial carbon (Brown et al. 1999; Gandhi and Sundarapandian 2017) and comprise 80% of the total terrestrial plant biomass (Kindermann et al. 2008). They are widely recognized to be highly productive ecosystems (Subashree and Sundarapandian 2017) and stock more carbon in biomass and soil together than present in the atmosphere (Pan et al. 2013). Tropical forests are known to exchange more carbon dioxide with the atmosphere than any other biome (Foley et al. 2003; Beer et
al. 2010; Giri et al. 2019) and increasing biomass of intact tropical forests can absorb carbon at a rate of 1.1±0.3 Pg per year, thereby decelerating the rate of global warming by about 15% (Malhi 2012; Sundarapandian et al. 2013).
Tropical forests contain 247 Gt of carbon in vegetation,
with dry forests and rainforests share about 110 and 134 Gt
of it respectively (Foley 1995; Sahu et al. 2016), and 193 Gt
of it is stored aboveground (Saatchi et al. 2011). Hence, the
amount of biomass in a forest directly quantifies the poten-
tial amount of carbon that would be added to the atmos-
phere or sequestered on the land (Brown et al. 1999; Bora
et al. 2013), depending on whether the forest acts as source
or sink. Since biomass and its carbon stocks are known to
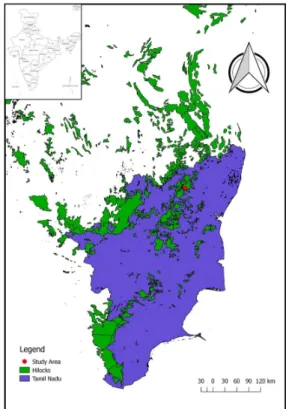
Fig. 1. Map showing the study plots in the Javadhu hills, southern Eastern Ghats, India.
show uneven spatial patterns even within the same ecotype of forests (Houghton 2005), estimation of biomass and car- bon and the latter’s allocation patterns, even in local forest ecosystems plays a crucial role in global carbon budget (Brown et al. 1993; Majumdar et al. 2016; Subashree and Sundarapandian 2017).
Plant biodiversity and the relationship with carbon cycle have become an important aspect, given the international efforts to moderate or minimize the impact of climate change through reducing the conversion of natural ecosys- tems (Midgley et al. 2010; Sahu et al. 2016). The United Nations Programme for Reducing Emissions from Deforestation and Forest Degradation (REDD) has poten- tial to provide considerable benefits for biodiversity con- servation through protection of various forests species (Harvey et al. 2010; Gardner et al. 2012; Sahu et al. 2016).
The rapid conversion like plantation and agricultural lands of tropical forests was a major source of greenhouse gases (Nascimento and Laurance 2002). Plants act as a major carbon sink and capture carbon from the atmosphere and store it in the form of fixed biomass during the growth process (Chavan and Rasal 2010; Pragasan 2014). Hence, a functional relationship is required between diversity and carbon sequestration that has implications for carbon man- agement projects.
The Eastern Ghats (EG), situated along the eastern coast of the Indian peninsula, contributes extensively to both species diversity and endemicity of the Indian region (Foley 1995; Sudhakar Reddy et al. 2011). Irrespective of the EG’s rich floral diversity, the forests are less studied and received little attention compared to the well-known the Western Ghats of India. The southern Eastern Ghats are under severe threat of deforestation and degradation due to numerous anthropogenic activities (Naidu et al. 2014a;
Naidu et al. 2014b) and are now limited to a few remnant patches in the hill tracts. Overexploitation of medicinal plants, construction of roads, mining, fuel wood collection, habitat destruction, and grazing driving the the plant diver- sity of the EG at an alarming rate (Padal et al. 2009;
Premavani et al. 2014), and this may lead to the extinction of many valuable and important plant species. Forest bio- mass and carbon stock data are available for different for- ests of the EG (Bora et al. 2013; Pragasan 2014; Pragasan 2015a, 2015b; Gandhi and Sundarapandian 2017; Naveenkumar
et al. 2017). With this background, this present study has been taken with the following objective of to estimate the bi- omass and carbon storage of trees in Javadhu hill, Eastern Ghats, India.
Materials and Methods
Study area
The Eastern Ghats are a long chain of broken hills, un-
like that of the Western Ghats of India, consecutively from
north-east to south west along the coastal plain and the pla-
teau and extend from 11°30' N to 22°00' N latitudes and
76°50' E to 86°30' E longitudes. They are highly dissected
and intervened by 13 valleys. The Eastern Ghats can be
broadly divided into 3 zones, i.e., North Eastern Ghats
(Orissa), Middle Eastern Ghats (Andhra Pradesh) and
South Eastern Ghats (Tamil Nadu). The Javadhu hills
form a part of the Eastern Ghats in Tamil Nadu and have a
typical geographical setting with a broad range of physical
features and vast stretches having a broad spectrum of rich
Table 1. Plot wise biomass and carbon stocks (Mg/ha) of trees in the tropical dry mixed evergreen forest of Javadhu hills, Eastern Ghats, India
Plot Density AGB BGB Total biomass Total carbon
1 469 196.2 30.6 226.8 113.4
2 490 169.8 27.5 197.3 98.7
3 623 205.0 33.7 238.7 119.3
4 471 157.3 25.7 183.0 91.5
5 514 152.0 25.1 177.2 88.6
6 541 184.0 30.4 214.4 107.2
7 483 214.8 36.0 250.8 125.4
8 515 181.4 30.0 211.5 105.7
9 534 144.2 23.9 168.1 84.0
10 500 137.2 23.0 160.2 80.1
AGB, aboveground biomass; BGB, belowground biomass.
forest wealth (floristic composition) (Fig. 1). The hill rang- es of Javadhu have extensive lofty peaks and several river valleys and are endowed with a broad range of ecological habitats giving rise to a varied and rich forest resource and thus assume significance for conservation strategies. A number of vegetation types ranging from Semi-evergreen forest to dry grassland with varying species composition in each type and with peculiar phenology warrant careful veg- etation analysis. Much of the southern part of the hills sup- ports many remnant patches of semi-evergreen forests and dry mixed deciduous forests, which act as sources of medic- inal plants and contain rare, endangered and endemic plant species providing at the same time valuable resources sup- porting the hill populations. The Javadhu hills currently are now facing rapid fragmentation and degradation due to se- vere biotic pressure. This fact justifies the necessity of con- serving the remaining ecosystems from further degradation.
Vegetation of Javadhu hills varies considerably with ele- vation gradient. Scrub vegetation occupies the foot hills and the mixed deciduous forest is present in the elevation be- tween 400 to 700 m, while dry evergreen forests occupy at the higher elevation between 700 to 1150 m. The study plots lies within 650 to 700 m elevation and it’s comprise mixed dry evergreen forest type of vegetation. The present study area lies between 12°55'N. and 78°97'E. The Javadhu hill range comprises of hills running from the North to the South attaining a maximum length of 64 kms, and a width of 25 kms. An interesting feature at the top of these hills is the place of plateaus extending for a ten kilometers. The average height above mean sea level is
1,100-1,150 m; the highest point is Kumbukudi (1,273 m).
The climate is typical tropical asymmetric type with most rainfall received from north east monsoon and very little and inconsistent rainfall in the south-west monsoon. The mean annual maximum temperature is 44.4°C in May and minimum 11.7°C in January. The average rainfall is about 886 mm.
The study was conducted in the Javadhu reserve forest from 2015. We laid 10 square plots of 1 ha randomly in the forest and sub-gridded each into 10, 10 m×10 m size (100 m
2) quadrats as easy, workable units. The minimum dis- tance between the plots was 1000 meters. At each quadrat (10 m), all the individual plants with ≥10 cm diameter at breast height (DBH) were enumerated and their girths were measured at 1.37 m from the ground level. Identificat- ion of individual trees was done at the species, genera and family level. The DBH measured for each tree was used to infer dry aboveground biomass (AGB) and belowground biomass (BGB). Following the recommandation of the IPCC’s 2005 fourth assessment report, we inferred the car- bon stock (Mg ha
-1) in our plots as 50% of the total biomass (AGB+BGB).
We calculated the aboveground biomass (AGB) of trees in our plots using the regression equation given by Chave et al. (2005):
AGB est=×exp (−1.499+2.148 ln (D)+0.207
(ln(D))2−0.0281 (ln(D))3) (1)
where AGB is aboveground dry biomass in Mg ha
-1, is
Table 2. Estimated biomass and carbon stocks (Mg/ha) of tree species in the 10 ha study plots of tropical dry mixed evergreen forest of Javadhu hills, Eastern Ghats, India
Sl. no Species No. of
individuals AGB BGB TB TC stock % C
1 Memecylon umbellatum Burm. f. 1,085 431.19 65.53 496.72 248.36 24.49
2 Psydrax dicoccos Gaertn. 902 234.44 43.15 277.59 138.80 13.69
3 Anogeissus latifolia (Roxb. ex DC.) Wall. exGuillem. & Perr. 534 217.84 34.36 252.20 126.10 12.44
4 Chloroxylon swietenia DC. 686 215.19 32.63 247.82 123.91 12.22
5 Buchanania axillaris (Desr.) Ramamoorthy 352 99.93 16.40 116.34 58.17 5.74
6 Cassia siamea Lam. 46 57.50 10.11 67.61 33.80 3.33
7 Lannea coromandelica (Houtt.) Merr. 147 54.40 11.39 65.79 32.89 3.24
8 Terminalia chebula Retz. 49 52.26 7.43 59.69 29.85 2.94
9 Vitex altissima L.f. 116 37.69 6.75 44.44 22.22 2.19
10 Phyllanthus polyphyllus Willd. 185 25.77 4.62 30.39 15.20 1.50
11 Terminalia bellirica (Gaertn.) Roxb. 15 26.64 3.70 30.34 15.17 1.50
12 Diospyros buxifolia (Blume) Hiern 114 25.99 4.07 30.06 15.03 1.48
13 Erythroxylum monogynum Roxb. 126 22.75 4.39 27.14 13.57 1.34
14 Diospyros ebenum J.Koenig ex Retz. 60 21.87 3.67 25.54 12.77 1.26
15 Diospyros angustifolia Audib. exSpach 43 20.99 3.52 24.51 12.26 1.21
16 Madhuca longifolia (J.Koenig ex L.) J.F.Macbr. 29 17.83 2.64 20.46 10.23 1.01
17 Dalbergia paniculata Roxb. 59 17.42 2.99 20.41 10.20 1.01
18 Memecylon edule Roxb. 89 17.34 3.07 20.41 10.20 1.01
19 UI-1 46 14.72 2.69 17.41 8.70 0.86
20 Terminalia paniculata Roth 6 15.03 2.11 17.13 8.57 0.84
21 Pterocarpus marsupium Roxb. 54 13.85 2.19 16.04 8.02 0.79
22 Ixora pavetta Andr. 79 10.14 2.10 12.23 6.12 0.60
23 Manilkara hexandra (Roxb.) Dubard 23 9.87 1.73 11.60 5.80 0.57
24 Atalantia monophylla DC. 30 9.23 1.46 10.69 5.35 0.53
25 Mallotus philippensis (Lam.) Müll.Arg. 15 7.93 1.26 9.19 4.59 0.45
26 Diospyros candolleana Wight 23 7.78 1.39 9.17 4.58 0.45
27 Pterospermum suberifolium (L.) Willd. 23 6.73 1.27 7.99 4.00 0.39
28 Phyllanthus emblica L. 34 6.58 1.09 7.67 3.83 0.38
29 Commiphora caudata (Wight &Arn.) Engl. 22 4.68 1.21 5.89 2.94 0.29
30 Premna tomentosa Willd. 13 4.62 0.90 5.52 2.76 0.27
31 Terminalia crenulata Roth 12 3.97 0.66 4.63 2.31 0.23
32 Albizia amara (Roxb.) B.Boivin 11 3.25 0.57 3.82 1.91 0.19
33 Pongamia pinnata (L.) Pierre 6 2.95 0.48 3.43 1.72 0.17
34 Gmelina arborea Roxb. 6 2.67 0.49 3.16 1.58 0.16
35 Dalbergia latifolia Roxb. 7 2.72 0.42 3.14 1.57 0.15
36 Albizia chinensis (Osbeck) Merr. 11 2.09 0.38 2.46 1.23 0.12
37 UI-2 5 2.02 0.33 2.35 1.18 0.12
38 Chukrasia tabularis A.Juss. 6 1.89 0.35 2.24 1.12 0.11
39 Albizia lebbeck (L.) Benth. 6 1.90 0.34 2.23 1.12 0.11
40 Sapindus emarginatus Vahl. 5 1.67 0.28 1.95 0.98 0.10
41 Semecarpus anacardium L.f. 6 1.09 0.22 1.30 0.65 0.06
42 Tamarindus indica L. 2 1.00 0.14 1.14 0.57 0.06
43 Miliusa eriocarpa Dunn. 5 0.85 0.18 1.03 0.52 0.05
44 Ficus benghalensis L. 3 0.66 0.14 0.80 0.40 0.04
45 Naringi crenulata (Roxb.) Nicolson 6 0.63 0.14 0.77 0.38 0.04
46 Morinda coreia Buch.Ham. 5 0.53 0.12 0.64 0.32 0.03
Table 2. Continued.
Sl. no Species No. of
individuals AGB BGB TB TC stock % C
47 Givotia rottleriformis Griff. ex Wight 3 0.47 0.16 0.63 0.32 0.03
48 Strychnos nux- vomica L. 2 0.53 0.10 0.62 0.31 0.03
49 Jatropha curcas L. 2 0.45 0.15 0.60 0.30 0.03
50 Sapindus trifoliatus L. 2 0.46 0.08 0.54 0.27 0.03
51 Canthium coromandelicum (Burm.f.) Alston 5 0.44 0.09 0.53 0.27 0.03
52 Drypetes sepiaria (Wight & Arn.) Pax & K.Hoffm. 1 0.24 0.04 0.28 0.14 0.01
53 Miliusa montana Gardner ex Hook.f.& Thomson. 4 0.21 0.06 0.27 0.13 0.01
54 Mallotus rhamnifolius (Willd.) Müll.Arg. 3 0.21 0.05 0.26 0.13 0.01
55 Streblus asper Lour. 3 0.18 0.04 0.23 0.11 0.01
56 Ziziphus xylopyrus (Retz.) Willd. 1 0.19 0.03 0.22 0.11 0.01
57 Diospyros montana Roxb. 2 0.14 0.03 0.17 0.08 0.01
58 Ficus microcarpa L.f. 1 0.13 0.03 0.16 0.08 0.01
59 Terminalia pallida Brandis. 1 0.11 0.02 0.13 0.07 0.01
60 Ziziphus sp. 1 0.05 0.01 0.06 0.03 0.00
61 Santalum album L. 1 0.05 0.01 0.06 0.03 0.00
62 Atalantia racemosa Wight ex Hook. 1 0.05 0.01 0.06 0.03 0.00
Total 1,741.95 285.95 2,027.90 1,013.95 100
AGB, aboveground biomass; BGB, belowground biomass; TB, total biomass (AGB+BGB); TC stock, total carbon stock.
Fig. 2. Estimated biomasses and carbon stock in each individual 10, 1-ha plot in the study area. AGB, aboveground biomass; BGB, belowground biomass.
wood specific gravity and D is DBH (cm). The wood spe- cific gravity of each tree species was taken from the available published literature (Reyes et al. 1992; Cordero and Kanninen 2002; Mani and Parthasarathy 2007; Wiemann and Green 2007; Sundarapandian et al. 2014) and also from global wood density data. For multistemmed trees we calculated the biomass separately for each stem and sum- med together. We estimated the belowground biomass (BGB) of trees by using a widely accepted allometric equa- tion given by Cairns et al. (1997):
BGB=exp (−1:0587+0:8836×ln (AGB)) (2) Statistical analysis
The statistical analysis was performed by SPSS software package. The relationship between biomass and vegetation parameters (species richness, density and basal area) was examined by simple linear regression models. ANOVA were performed to test for significant differences in the tree C stocks and AGB among the three plant groups.
Results
In total, we identified 5140 individuals of 62 plant spe- cies belonging to 23 families in the 10, 1-ha plots (Table 1).
The number of individuals in each plot ranged from 469 to
623. Memecylon umbellatum (1085 individuals), and
Psydrax dicoccos (902) were the most abundant species in
our plots (Table 2).
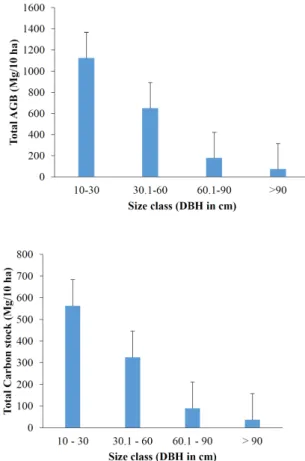
Fig. 3. Girth class distribution and ABG and C stock.
Biomass and carbon stock
The total estimated biomass (i.e. aboveground + below- ground) and carbon stacks of plants showed spatial varia- tions among the 10 study plots (Table 1; Fig. 2). They also showed variations with respect to number of individuals in each plot; some plots with low number of individuals had comparatively higher biomass and carbon than some plots with high number of individuals (Fig. 2). The total biomass ranged from 160.02 to 250.8 Mg/ha, with a mean of 202.04±24.64 Mg/ha) (Table 1). The aboveground bio- mass ranged from 137.2 to 214.8 Mg/ha, with a mean of 174.2±24.19 Mg/ha and the belowground biomass ranged from 23.0 to 66.0 Mg/ha with a mean of 28.62±3.35 Mg/ha (Table 1). The total estimated carbon stock was 1014.00 Mg, ranged from 80.1 to 125.4 Mg/ha with a mean value of 101.4±12.31 Mg/ha in our study plots (Table 1; Figs. 1, 2).
Species contribution to biomass and carbon stock Among the 62 tree species enumerated, Memecylon um- bellatum accumulated greater biomass and carbon stocks (24.29%) than other species in the study plots (Table 2).
The top ten species, viz., Memecylon umbellatum (24.9%), Psydrax dicoccos (13.6%), Anogeissus latifolia (12.4%), Chloroxylon swietenia (12.2%), Buchanania axillaris (5.7%), Cassia siamea (3.3%), Lannea coromandelica (3.2%), Terminalia chebula (2.9%), Vitex altissima (2.1%), and Phyllanthus polyphyllus (1.5%), together contributed 81.8%
of carbon to the total carbon stocks. In contrast, the remain- ing 44 tree species contributed only 0.1% of the total carbon stocks (Table 2). Interestingly, although P. dicoccos has higher number of individuals (902), the amount of carbon stored by it is similar to that of A. latifolia and C. swietenia which have relatively less number of individuals, 534 and 686 respectively in the plots (Table 2).
Biomass and carbon stock by single tree
Out of 5140 individuals recorded from the total 10 ha area, the average carbon stock sequestered by a single tree individual was 0.028±0.14 t/tree. The carbon stock was found maximum in Terminalia paniculata (1.42 t/tree), fol- lowed by Terminalia bellirica (1.01 t/tree), Cassia siamea (0.73 t/tree), Terminalia chebula (0.60 t/tree), Madhuca
longifolia (0.35 t/tree), Mallotus philippensis (0.30 t/tree) and Pongamia pinnata (0.28 t/tree), and the minimum was recorded in Atalantia racemosa (0.02 /tree) (Table 2).
Distribution of biomass and carbon in different size classes
Contribution of DBH to the estimation of aboveground biomass and carbon showed a decreasing trend with in- creasing size class (Fig. 3). For the aboveground biomass the maximum contribution (55.1%) was for 10-30 cm size class, followed by 30.1-60 cm (32.2%), 60.1-90 cm (8.84%) and >90 cm dbh (3.62) classes (Fig. 3).
Biomass and carbon stock by plant types
Our study plots displayed three plant types: Evergreen,
deciduous and brevi-deciduous. Evergreen species con-
tributed more to both biomass and carbon stock estimations
(47%), followed by deciduous (35%) and brevi-deciduous
Fig. 4. Biomass distribution of different plant types.
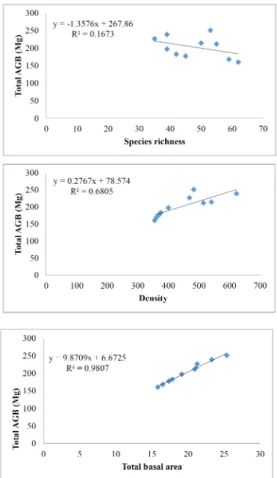
Fig. 5. Relationship of AGB with tree diversity, density and basal area.
Table 3. The family-wise contribution of total biomass and carbon stock in the tropical dry mixed evergreen forest of Javadhu Hills, Eastern Ghats
Sl. no. Family TB TC stock % C
1 Melastomataceae 517.13 258.57 25.50
2 Combretaceae 364.12 182.06 17.96
3 Rubiaceae 291.00 145.50 14.35
4 Rutaceae 259.34 129.67 12.79
5 Anacardiaceae 183.43 91.71 9.05
6 Ebenaceae 89.44 44.72 4.41
7 Caesalpiniaceae 68.75 34.37 3.39
8 Verbenaceae 53.13 26.56 2.62
9 Euphorbiaceae 48.73 24.37 2.40
10 Fabaceae 43.02 21.51 2.12
11 Sapotaceae 32.06 16.03 1.58
12 Erythroxylaceae 27.14 13.57 1.34
13 UI-1 19.76 9.88 0.97
14 Mimosoideae 8.52 4.26 0.42
15 Sterculiaceae 7.99 4.00 0.39
16 Moraceae 7.07 3.54 0.35
17 Sapindaceae 2.50 1.25 0.12
18 Meliaceae 2.24 1.12 0.11
19 Annonaceae 1.30 0.65 0.06
20 Loganiaceae 0.62 0.31 0.03
21 Rhamnaceae 0.28 0.14 0.01
22 Putranjivaceae 0.28 0.14 0.01
23 Santalaceae 0.06 0.03 0.00
2,027.90 1,013.95 100 TB, total biomass (AGB+BGB); TC stock, total carbon stock.
(17%) (Fig. 4). ANOVA revealed a significant variation in the total biomass and carbon stock among the three plant types (F (2, 17)=15.343, p<0.001).
Family contribution to biomass and carbon stock
Among the 23 plant families enumerated, Melastomataceae
contributed to greater biomass and carbon stocks (571.13
Mg) than the remaining families. It constituted 25.5% of
the total woody carbon estimated (Table 3) in this tropical
dry mixed evergreen forest. The top five plant families in-
cluding Melastomataceae, viz., Combretaceae (17.9%),
Rubiaceae (14.3%), Rutaceae (12.7%) and Anacardiaceae
(9.05%), contributed 79.6% of biomass and total carbon
stock in the 10 study plots. The reamining 18 plant families
contributed to the remaining 20.3% of the total woody
carbon. Eleven families contributed less than 1% to the esti-
mated total biomass and carbon stocks.
Table 4. Comparison of above ground biomass and carbon stock of Javadhu forests with other tropical forests of the world Forest type and location ABG (Mg ha-1) C Stock (Mg ha-1) Reference
Tropical forest, Thailand - 60.0-179.0 Ogawa et al. (1965)
Tropical rain forests, Malaysia 230-290 - Whitmore (1975)
Tropical forest, Sri Lanka 154 77 Brown and Lugo (1992)
Rainforest, Bajo Calima, Choco, Columbia 11.09-193.29 - Faber-Langendoen and Gentry (1991) Southeast Asia, including India, Cambodia, Malaysia
and Indonesia
- 17.0-350.0 Flint and Richards (1994)
India 126 - Ravindranath et al. (1997)
Tropical forests of Thailand - 138.0-182.0 Boonprakob (1998)
India 67.4 - Haripriya (2000)
Tropical seasonal rain forest, Xishuangbanna, China 241.27 171 Shanmughavel et al. (2001)
Tropical dry deciduous forest, Mexico - 113 Cairns et al. (2003)
Tropical evergreen forest, Colombia - 112 Sierra et al. (2009)
Tropical dry evergreen forests, India 90.25-173.1 - Mani and Parthsarathy (2007)
Tropical forest, India 324 162 Baishya et al. (2009)
Tropical forests, India 372 186 Mohanraj et al. (2011)
Tropical dry deciduous forest, India - 87 Chaturvedi et al. (2011)
Tropical forest of Cachar, Assam, India 32.47-261.64 16.24-130.82 Borah et al. (2013) Chitteri reserve forest, Eastern Ghats, India 1,171 585.5 Arul Pragasan (2014) Tropical forests, Pachaimalai forest, India 57.7 28.8 Arul Pragasan (2015a) Tropical dry forest, Eastern Ghats, India 792 395.83 Arul Pragasan (2015b) Tropical semi-evergreen forest, India - 10-204 Arul Pragasan (2016)
Dry deciduous forest, Eastern Ghats, India 64.81-624.96 32.4-312 Sanjay Gandhi and Sundarapandian (2017) Javadi hills, Eastern Ghats, India 99-216 - Naveenkumar et al. (2017)
Tropical dry mixed evergreen forests, Eastern Ghats, India
137.2-214.8 80-125 Present study (2018)
Relationship of aboveground biomass with species richness, density and basal area
The relationship between aboveground biomass and spe- cies richness, density and basal area were shown in Fig. 5.
The basal area and density showed significant positive cor- relation with the aboveground biomass (R
20.980; 0.680) while species richness exhibited negative correlation (R
20.167).
Discussion
Tropical forests store significant amount of biomass and Carbon. Estimation of biomass (aboveground and below- ground) enables the assessment of the amount of C that a forest can accumulate. Biomass estimation is an important factor for National Development Planning as well as for scientific studies of carbon budget (Devagiri et al. 2013;
Naveenkumar et al. 2017). The aboveground biomass of trees in the present study ranged from 160.02 to 250.8 Mg/ha, with a mean of 202.04±24.64 Mg/ha and this is not much different from that of other tropical dry forests of the Eastern Ghats (Kolli Hills of Eastern Ghats, 36.85-196.98 Mg/ha (Ramachandran et al. 2007) Chitteri Hills of Eastern Ghats, 7.92-307 Mg/ha (Pragasan 2014);
Sathanur Reserve Forest, 64.81-624.96 Mg/ha (Gandhi and Sundarapandian 2017) (Table 4). The present study biomass values are comparable to the other world tropical forest average biomass values (Brown et al. 1993; Slik et al.
2010, Návar-Chaidez 2011; Becknell et al. 2012; Lewis et
al. 2013; Berenguer et al. 2014). But, contrarily, the results
are lower than those for the tropical dry forests of Costa
Rica (334 Mg/ha (Becknell et al. 2012)) and Brazilian
America (375.7 Mg/ha (Geoghegan et al. 2010)). However,
there is a major variation in biomass among various forest
types and geographic locations which could be attributed to
differences in vegetation/plant structure, composition of species, edaphic factors, rainfall pattern, dry season length, elevation, aspect, etc. Biomass is also determined by tree density, height, and basal area at any given location. The lower values may be due to forest successional stages, the composition of species variability and varying tree density, as suggested by Joshi and Ghose (2014) and Sudhakar Reddy et al. (2011). Brown and Lugo (1992) stated that belowground biomass might vary from 10 to 50% with an average of 17% of the total aboveground biomass of many tropical forests in the world. The belowground biomass as estimated in the present study was 12% of the total above- ground biomass. In the present study, woody biomass showed variations among the plots which may be due to variation of tree girth classes. Nevertheless, few plots in the present study hold higher total woody biomass which may be due to the presence of many trees of large-girthed trees, which coincides with the report of Pande (2005) who ob- served that the higher basal area plots stored greater bio- mass compared to other plots having a young population of trees. The biomass of a forest ecosystem is reliant on the density and basal area of woody vegetation as well as the population structure of the plant community. The present study proves that the conservation of this forest not only supports and restores biodiversity but also will lead to a sig- nificant increase in C pool in the future. In forests where most trees are at the juvenile stage there will be a net addi- tion to the standing biomass, leading to C stock in future, which ultimately suggests that the conservation and man- agement of juvenile trees can considerably increase carbon storage potential in the near future (Baishya et al. 2009;
Naveenkumar et al. 2017).
The tree carbon stock (ranged from 80.1 to 125.4 Mg/ha with a mean value of 101.4±12.31 Mg/ha) esti- mated in the present study is comparable with that found by several studies in India and elsewhere (Singh and Singh 1991; Malhi et al. 1999; Cairns et al. 2003; Balvanera and Aguirre 2006; Glenday 2008; Slik et al. 2010; Chaturvedi et al. 2011a; Chaturvedi et al. 2011b; Mohanraj et al. 2011;
Chaturvedi and Raghubanshi 2013; Devagiri et al. 2013;
Lewis et al. 2013; Pan et al. 2013; Sundarapandian et al.
2013; Becknell and Powers 2014; Ekoungoulou et al.
2014; Pawar et al. 2014; Salunkhe et al. 2014; Hu et al.
2015; Lee et al. 2015; Lung and Espira 2015; Pragasan
2015b; Rao and Rao 2015; Prado‐Junior et al. 2016;
Paladines and Ruiz 2016; Sahu et al. 2016; Spracklen and Righelato 2016; Gandhi and Sundarapandian 2017;
Naveenkumar et al. 2017). C storage rate variations in dry forests are due to variations in the availability of soil mois- ture and nutrients (Chaturvedi et al. 2011a; Chaturvedi et al. 2011b; Gandhi and Sundarapandian 2017). The mean value (101.4±12.31 Mg/ha) of C stock obtained in the tropical dry mixed evergreen forest of Javadhu hill forest lies within the global range (14-123 Mg C/ha) of above- ground carbon stock for the tropical dry forest (Murphy and Lugo 1986) and the range of Mexican tropical forests by Návar-Chaidez (2011). Tiessen et al. (1998) reported that the dry tropical forests can store about 20 to 150 Mg C/ha. Prado-Junior et al. (2016) stated that tropical dry for- ests with over 50 years of conservation will have three times the amount of the present-day carbon stocks. This signifies the role of dry tropical forests in serving as carbon pool dur- ing crucial climate change.
We tried to demonstrate top five relative contributing species of total biomass and aboveground C stocks and it will help forest management and selective logging of tree species. Kirby and Potvin (Kirby and Potvin 2007) reported that the selective logging could lead to carbon impoverished forests because of preferences for timber species that dis- proportionately important carbon store. In the present study, Memecylon umbellatum , Psydrax dicoccos , Anogeissus latifolia , Chloroxylon swietenia , Buchanania axillaris , Cassia siamea , Lannea coromandelica , Terminalia chebula , Vitex altissima , and Phyllanthus polyphyllus . etc., were the important contributor of biomass and total C stock.
Removing or conserving these species from study forests will therefore have important effect on overall AGB and C stock.
Aboveground biomass and carbon stocks of forests are also driven by tree density, height, mean stem diameter, and wood specific gravity of trees (Poorter et al. 2015). A strong positive relationship was observed between aboveground biomass and basal area and tree density, which were in agreement with several earlier findings (Cannell 1984; Rai and Proctor 1986; Murali et al. 2005; Lewis et al. 2013;
Sundarapandian et al. 2014a; Dar and Sundarapandian
2015; Poorter et al. 2015; Sahu et al. 2016; Gandhi and
Sundarapandian 2017; Naveenkumar et al. 2017). A direct
relationship exists among basal area, biomass, and carbon stock because allometric equations for estimation have been developed based on prime factor, either diameter or basal area of trees. Chiba (1998) and Bora et al. (2013) stated that, the relationship between AGB and basal area in forest stand is probably to be associated with tree architectural de- velopment because the lower part of the tree trunk must contain the growth process of the tree since initiation.
Several studies stated that mature tropical forest with high AGB; contain a large amount of their aboveground bi- omass in large girthed trees (Brown and Lugo 1992;
Brown et al. 1993; Clark 1996; Bora et al. 2013). As the tropical forests are now experiencing by anthropogenic ac- tivities, the density diameter distribution of trees would be important determinant of carbon stock (Baishya 2009; Bora et al. 2013). In the present study, the smaller trees to me- dium sized trees (10-60 cm) contributed more than 80% of biomass and C stock in 10 ha plots. The numbers of small girthed trees were greater than the large girthed trees in the present study and this could be the reason for great stock in small and medium sized trees. The findings of earlier work- ers (Brown and Lugo 1992; Brown et al. 1993; Chiba 1998; Clark 1996), they reported up to 50% contribution to AGB by large trees (>70 cm dbh). On the other hand, Brown et al. (1993) reported that smaller trees contribute to most AGB in forests with <300 Mg ha
-1). Similarly, Slik et al. (2013) also observed that 70% of aboveground bio- mass was determined by the number of large trees (>70 cm DBH) while analyzing 120 lowlands tropical forest in pantropical forests. This is also in agreement with another study in the neotropical forest, which holds 30% less bio- mass than palaeotropical forests because of the least abun- dance or lack of large-girthed class trees (Poorter et al.
2015).
Conclusion
The variation of biomass and carbon stocks among the 10 ha plots in the present study may be due to soil charac- teristics, level of anthropogenic pressure, associated micro- climatic conditions, and status of stand structure. Finding of present study may be interpreted as most of the trees in this forest are yet to be matured and there is a net addition to standing biomass leading to carbon storage. The data
(biomass and carbon stock) obtained in the present study would serve as a baseline data for tropical dry forest and would be useful to assess both national and global level car- bon stocks.
Acknowledgements
The authors are thankful to the Ministry of Earth Science, Government of India, New Delhi for providing fi- nancial support through a project (MoES/16/25/2013- RDEAS dated 03.07.2014).
References
Baishya R, Barik SK, Upadhaya K. 2009. Distribution pattern of aboveground biomass in natural and plantation forests of humid tropics in northeast India. Trop Ecol 50: 295-304.
Balvanera P, Aguirre E. 2006. Tree diversity, environmental hetero- geneity, and productivity in a Mexican tropical dry forest.
Biotropica 38: 479-491.
Becknell JM, Kucek LK, Powers JS. 2012. Aboveground biomass in mature and secondary seasonally dry tropical forests: a liter- ature review and global synthesis. For Ecol Manag 276: 88-95.
Becknell JM, Powers JS. 2014. Stand age and soils as drivers of plant functional traits and aboveground biomass in secondary tropical dry forest. Canadian J For Res 44: 604-613.
Beer C, Reichstein M, Tomelleri E, Ciais P, Jung M, Carvalhais N, Rödenbeck C, Arain MA, Baldocchi D, Bonan GB, Bondeau A, Cescatti A, Lasslop G, Lindroth A, Lomas M, Luyssaert S, Margolis H, Oleson KW, Roupsard O, Veenendaal E, Viovy N, Williams C, Woodward FI, Papale D. 2010.
Terrestrial gross carbon dioxide uptake: global distribution and covariation with climate. Science 329: 834-838.
Berenguer E, Ferreira J, Gardner TA, Aragão LE, De Camargo PB, Cerri CE, Durigan M, Cosme De Oliveira Junior R, Vieira IC, Barlow J. 2014. A large-scale field assessment of carbon stocks in human-modified tropical forests. Glob Chang Biol 20:
3713-3726.
Boonpragob K. 1998. Estimating greenhouse gas emission and se- questration from land use change and forestry in Thailand. In:
Greenhouse Gas Emissions, Aerosols, Land Use and Cover Changes in Southeast Asia (Moya TB, ed). Southeast Asia Regional Committee, Bangkok, pp 18-25.
Bora N, Nath AJ, Das AK. 2013. Aboveground Biomass and Carbon Stocks of Tree Species in Tropical Forests of Cachar District, Assam, Northeast India. Int J Ecol Environ Sci 39:
97-106.
Brown S, Hall CAS, Knabe W, Raich J, Trexler MC, Woomer P.
1993. Tropical Forests: Their Past, Present, and Potential
Future Role in the Terrestrial Carbon Budget. Water Air Soil Pollut 70: 71-94.
Brown S, Lugo AE. 1992. Aboveground Biomass Estimates for Tropical Moist Forests of the Brazilian Amazon. Interciencia 17: 8-18.
Brown SL, Schroeder P, Kern JS. 1999. Spatial distribution of bio- mass in forests of the eastern USA. For Ecol Manag 123: 81-90.
Cairns MA, Brown S, Helmer EH, Baumgardner GA. 1997. Root biomass allocation in the world's upland forests. Oecologia 111:
1-11.
Cairns MA, Olmsted I, Granados J, Argaez J. 2003. Composition and aboveground tree biomass of a dry semi-evergreen forest on Mexico’s Yucatan Peninsula. For Ecol Manag 186: 125-132.
Cannell MGR. 1984. Woody biomass of forest stands. For Ecol Manag 8: 299-312.
Chaturvedi RK, Raghubanshi AS, Singh JS. 2011a. Carbon den- sity and accumulation in woody species of tropical dry forest in India. For Ecol Manag 262: 1576-1588.
Chaturvedi RK, Raghubanshi AS, Singh JS. 2011b. Effect of Small-Scale Variations in Environmental Factors on the Distribution of Woody Species in Tropical Deciduous Forests of Vindhyan Highlands, India. J Bot 2011: 297097.
Chaturvedi RK, Raghubanshi AS. 2013. Aboveground biomass es- timation of small diameter woody species of tropical dry forest.
New For 44: 509-519.
Chavan BL, Rasal GB. 2010. Sequestered standing carbon stock in selective tree species grown in University campus at Aurangabad, Maharashtra, India. Int J Eng Sci Technol 2:
3003-3007.
Chave J, Andalo C, Brown S, Cairns MA, Chambers JQ, Eamus D, Fölster H, Fromard F, Higuchi N, Kira T, Lescure JP, Nelson BW, Ogawa H, Puig H, Riéra B, Yamakura T. 2005.
Tree allometry and improved estimation of carbon stocks and balance in tropical forests. Oecologia 145: 87-99.
Chiba Y. 1998. Architectural analysis of relationship between bio- mass and basal area based on pipe model theory. Ecol Model 108: 219-225.
Clark DB. 1996. Abolishing Virginity. J Trop Ecol 12: 735-739.
Cordero LD, Kanninen M. 2002. Wood specific gravity and aboveground biomass of Bombacopsis quinata plantations in Costa Rica. For Ecol Manag 165: 1-9.
Dar JA, Sundarapandian S. 2015. Variation of biomass and carbon pools with forest type in temperate forests of Kashmir Himalaya, India. Environ Monit Assess 187: 55.
Devagiri GM, Money S, Singh S, Dadhawal VK, Patil P, Khaple A, Devakumar AS, Hubballi S. 2013. Assessment of above ground biomass and carbon pool in different vegetation types of south western part of Karnataka, India using spectral modeling.
Trop Ecol 54: 149-165.
Ekoungoulou R, Liu X, Loumeto JJ, Ifo SA, Bocko YE, Koula FE, Niu S. 2014. Tree Allometry in Tropical Forest of Congo for Carbon Stocks Estimation in Above-Ground Biomass.
Open J For 4: 481-491.
Faber-Langendoen D, Gentry AH. 1991. The Structure and Diversity of Rain Forests at Bajo Calima, Choco Region, Western Colombia. Biotropica 23: 2-11.
Flint EP, Richards JF. 1994. Trends in carbon content of vegetation in South and Southeast Asia associated with changes in land use.
In: Effects of Land-Use Change on Atmospheric CO2 Concentrations, South and Southeast Asia as a Case Study (Dale VH, ed). Springer-Verlag, New York, pp 201-300.
Foley JA, Costa MH, Delire C, Ramankutty N, Snyder P. 2003.
Green surprise? How terrestrial ecosystems could affect earth’s climate. Front Ecol Environ 1: 38-44.
Foley JA. 1995. An equilibrium model of the terrestrial carbon budget. Tellus B Chem Phys Meteorol 47: 310-319.
Gandhi DS, Sundarapandian SM. 2017. Large-scale carbon stock assessment of woody vegetation in tropical dry deciduous forest of Sathanur reserve forest, Eastern Ghats, India. Environ Monit Assess 189: 187.
Gardner TA, Burgess ND, Aguilar-Amuchastegui N, Barlow J, Berenguer E, Clements T, Danielsen F, Ferreira J, Foden W, Kapos V, Khan SM, Lees AC, Parry L, Roman-Cuesta RM, Schmitt CB, Strange N, Theilade I, Vieira ICG. 2012. A frame- work for integrating biodiversity concerns into national REDD+ programmes. Biol Conserv 154: 61-71.
Geoghegan J, Lawrence D, Schneider LC, Tully K. 2010.
Accounting for carbon stocks in models of land-use change: an application to Southern Yucatan. Reg Environ Change 10:
247-260.
Giri K, Buragohain P, Konwar S, Pradhan B, Mishra G, Meena DK. 2019. Tree Diversity and Ecosystem Carbon Stock Assessment in Nambor Wildlife Sanctuary, Assam. Proc Natl Acad Sci India Sect B Biol Sci 89: 1421-1428.
Glenday J. 2008. Carbon storage and emissions offset potential in an African dry forest, the Arabuko-Sokoke Forest, Kenya.
Environ Monit Assess 142: 85-95.
Haripriya GS. 2000. Estimates of biomass in Indian forests.
Biomass Bioenerg 19: 245-258.
Harvey CA, Dickson B, Kormos C. 2010. Opportunities for ach- ieving biodiversity conservation through REDD. Conserv Lett 3: 53-61.
Houghton R. 2005. Aboveground Forest Biomass and the Global Carbon Balance. Glob Chang Biol 11: 945-958.
Hu Y, Su Z, Li W, Li J, Ke X. 2015. Influence of Tree Species Composition and Community Structure on Carbon Density in a Subtropical Forest. PLoS One 10: e0136984.
Joshi HG, Ghose M. 2014. Community structure, species diver- sity, and aboveground biomass of the Sundarbans mangrove swamps. Trop Ecol 55: 283-303.
Kindermann G, McCallum I, Fritz S, Obersteiner M. 2008. A global forest growing stock, biomass and carbon map based on FAO statistics. Silva Fenn 42: 387-396.
Kirby KR, Potvin C. 2007. Variation in carbon storage among tree
species: Implications for the management of a small-scale carbon sink project. For Ecol Manag 246: 208-221.
Lee S, Lee D, Yoon TK, Salim KA, Han S, Yun HM, Yoon M, Kim E, Lee WK, Davies SJ, Son Y. 2015. Carbon stocks and its variations with topography in an intact lowland mixed dipter- ocarp forest in Brunei. J Ecol Environ 38: 75-84.
Lewis SL, Sonké B, Sunderland T, Begne SK, Lopez-Gonzalez G, van der Heijden GM, Phillips OL, Affum-Baffoe K, Baker TR, Banin L, Bastin JF, Beeckman H, Boeckx P, Bogaert J, De Cannière C, Chezeaux E, Clark CJ, Collins M, Djagbletey G, Djuikouo MN, Droissart V, Doucet JL, Ewango CE, Fauset S, Feldpausch TR, Foli EG, Gillet JF, Hamilton AC, Harris DJ, Hart TB, de Haulleville T, Hladik A, Hufkens K, Huygens D, Jeanmart P, Jeffery KJ, Kearsley E, Leal ME, Lloyd J, Lovett JC, Makana JR, Malhi Y, Marshall AR, Ojo L, Peh KS, Pickavance G, Poulsen JR, Reitsma JM, Sheil D, Simo M, Steppe K, Taedoumg HE, Talbot J, Taplin JR, Taylor D, Thomas SC, Toirambe B, Verbeeck H, Vleminckx J, White LJ, Willcock S, Woell H, Zemagho L. 2013. Above-ground bio- mass and structure of 260 African tropical forests. Philos Trans R Soc Lond B Biol Sci 368: 20120295.
Lung M, Espira A. 2015. The influence of stand variables and hu- man use on biomass and carbon stocks of a transitional African forest: implications for forest carbon projects. For Ecol Manag 351: 36-46.
Majumdar K, Choudhary BK, Datta BK. 2016. Aboveground Woody Biomass, Carbon Stocks Potential in Selected Tropical Forest Patches of Tripura, Northeast India. Open J Ecol 6:
598-612.
Malhi Y, Baldocchi DD, Jarvis PG. 1999. The carbon balance of tropical, temperate and boreal forests. Plant Cell Environ 22:
715-740.
Malhi Y. 2012. The productivity, metabolism and carbon cycle of tropical forest vegetation. J Ecol 100: 65-75.
Mani S, Parthasarathy N. 2007. Above-ground biomass estimation in ten tropical dry evergreen forest sites of peninsular India.
Biomass Bioenerg 31: 284-290.
Midgley GF, Bond WJ, Kapos V, Ravilious C, Scharlemann JP, Woodward FI. 2010. Terrestrial carbon stocks and biodiversity:
key knowledge gaps and some policy implications. Curr Opin Environ Sustain 2: 264-270.
Mohanraj R, Saravanan J, Dhanakumar S. 2011. Carbon stock in Kolli forests, Eastern Ghats (India) with emphasis on above- ground biomass, litter, woody debris and soils. iForest 4: 61-65.
Murali KS, Bhat DM, Ravindranath NH. 2005. Biomass estima- tion equations for tropical deciduous and evergreen forests. Int J Agric Res Gov Ecol 4: 81-92.
Murphy PG, Lugo AE. 1986. Ecology of tropical dry forest. Annu Rev Ecol Syst 17: 67-88.
Naidu MT, Kumar OA, Rao MS, Venkaiah M. 2014a. Impact of Indira Sagar Dam in the Eastern Ghats of Andhra Pradesh on the Floristic Wealth. Int J Adv Res Sci Technol 3: 8-16.
Naidu MT, Kumar OA, Venkaiah M. 2014b. Taxonomic Diversity of Lianas in Tropical Forests of Northern Eastern Ghats of Andhra Pradesh, India. Not Sci Biol 6: 59-65.
Nascimento HEM, Laurance WF. 2002. Total aboveground bio- mass in central Amazonian rainforests: a landscape-scale study.
For Ecol Manag 168: 311-321.
Návar-Chaidez J. 2011. The spatial distribution of aboveground biomass in tropical forests of Mexico. Trop Subtrop Agroecosystems 13: 149-158.
Naveenkumar J, Arunkumar KS, Sundarapandian SM. 2017.
Biomass and carbon stocks of a tropical dry forest of the Javadi Hills, Eastern Ghats, India. Carbon Manag 8: 351-361.
Ogawa H, Yoda K, Ogino K, Kira T. 1965. Comparative ecological studies on three main types of forest vegetation in Thailand II.
Plant biomass. Nat Life South East Asia 4: 49-80.
Padal SB, Rao JP, Naidu MT, Rao DS, Rao MS, Prameela R, Aruna K. 2009. Some important pteridophytes from eastern Ghats of northern Andhra Pradesh, India. J Nat Conserv 21:
287-294.
Paladines VC, Ruiz RG. 2016. Floristic Composition and Structure of a Deciduous Dry Forest from Southern Ecuador: Diversity and Aboveground Carbon Accumulation. Int J Curr Res Acad Rev 4: 154-169.
Pan Y, Birdsey RA, Phillips OL, Jackson RB. 2013. The Structure, Distribution, and Biomass of the World's Forests.
Annu Rev Ecol Evol Syst 44: 593-622.
Pande PK. 2005. Biomass and productivity in some disturbed trop- ical dry deciduous teak forests of Satpura plateau, Madhya Pradesh. Trop Ecol 46: 229-239.
Pawar GV, Singh L, Jhariya MK, Sahu KP. 2014. Effect of anthro- pogenic disturbances on biomass and carbon storage potential of a dry tropical forest in India. J Appl Nat Sci 6: 383-392.
Poorter L, Van Der Sande MT, Thompson J, Arets EJ, Alarcón A, Álvarez‐Sánchez J, Ascarrunz N, Balvanera P, Barajas‐Guzmán G, Boit A, Bongers F, Carvalho FA, Casanoves F, Cornejo‐
Tenorio G, Costa FRC, de Castilho CV, Duivenvoorden JF, Dutrieux LP, Enquist BJ, Fernández‐Méndez F, Finegan B, Gormley LHL, Healey JR, Hoosbeek MR, Ibarra‐Manríquez G, Junqueira AB, Levis C, Licona JC, Lisboa LS, Magnusson WE, Martínez‐Ramos M, Martínez‐Yrizar A, Martorano LG, Maskell LC, Mazzei L, Meave JA, Mora F, Muñoz R, Nytch C, Pansonato MP, Parr TW, Paz H, Pérez‐García EA, Rentería LY, Rodríguez‐Velazquez J, Rozendaal DMA, Ruschel AR, Sakschewski B, Salgado‐Negret B, Schietti J, Simões M, Sinclair FL, Souza PF, Souza FC, Stropp J, ter Steege H, Swenson NG, Thonicke K, Toledo M, Uriarte M, van der Hout P, Walker P, Zamora N, Peña‐Claros M. 2015. Carbon storage in tropical forests. Glob Ecol Biogeogr 24: 1314-1328.
Prado‐Junior JA, Schiavini I, Vale VS, Arantes CS, van der Sande MT, Lohbeck M, Poorter L. 2016. Conservative species drive biomass productivity in tropical dry forests. J Ecol 104:
817-827.
Pragasan AL. 2015a. Tree Carbon Stock Assessment from the Tropical Forests of Bodamalai Hills Located In India. J Earth Sci Clim Change 6: 314.
Pragasan LA. 2014. Carbon Stock Assessment in the Vegetation of the Chitteri Reserve Forest of the Eastern Ghats in India Based on Non-Destructive Method Using Tree Inventory Data. J Earth Sci Clim Change S11: 001.
Pragasan LA. 2015b. Assessment of Tree Carbon Stock in the Kalrayan Hills of the Eastern Ghats, India. Walailak J Sci Tech 12: 659-670.
Premavani D, Naidu MT, Venkaiah M. 2014. Tree Species Diversity and Population Structure in the Tropical Forests of North Central Eastern Ghats, India. Not Sci Biol 6: 448-453.
Rai SN, Proctor J. 1986. Ecological Studies on Four Rainforests in Karnataka, India: I. Environment, Structure, Floristics and Biomass. J Ecol 74: 439-454.
Ramachandran A, Jayakumar S, Haroon RM, Bhaskaran A, Arockiasamy DI. 2007. Carbon sequestration: estimation of car- bon stock in natural forests using geospatial technology in the Eastern Ghats of Tamil Nadu, India. Curr Sci 92: 323-331.
Rao VS, Rao BRP. 2015. Carbon sequestration potential of tropical deciduous forests of Nallamalais, India. Asian J Plant Sci Res 5:
24-33.
Ravindranath NH, Somashekhar BS, Gadgil M. 1997. Carbon flow in Indian forests. Clim Change 35: 297-320.
Reyes G, Brown S, Chapman J, Lugo AE. 1992. Wood densities of tropical tree species. USDA Forest Service, Southern Forest Experiment Station, New Orleans, LA. General Technical Report S0-88.
Saatchi SS, Harris NL, Brown S, Lefsky M, Mitchard ET, Salas W, Zutta BR, Buermann W, Lewis SL, Hagen S, Petrova S, White L, Silman M, Morel A. 2011. Benchmark map of forest carbon stocks in tropical regions across three continents. Proc Natl Acad Sci U S A 108: 9899-9904.
Sahu SC, Suresh HS, Ravindranath NH. 2016. Forest Structure, Composition and Above Ground Biomass of Tree Community in Tropical Dry Forests of Eastern Ghats, India. Not Sci Biol 8:
125-133.
Salunkhe O, Khare PK, Sahu TR, Singh S. 2014. Above Ground Biomass and Carbon Stocking in Tropical Deciduous Forests of State of Madhya Pradesh, India. Taiwania 59: 353-359.
Shanmughavel P, Sha L, Zheng Z, Cao M. 2001. Nutrient cycling in a tropical seasonal rain forest of Xishuangbanna, Southwest China. Part 1: tree species: nutrient distribution and uptake.
Bioresour Technol 80: 163-170.
Shanmughavel P, Zheng Z, Liqing S, Min C. 2001. Floristic struc- ture and biomass distribution of a tropical seasonal rain forest in Xishuangbanna, southwest China. Biomass Bioenerg 21:
165-175.
Sierra CA, Loescher HW, Harmon ME, Richardson AD, Hollinger DY, Perakis SS. 2009. Interannual variation of car-
bon fluxes from three contrasting evergreen forests: the role of forest dynamics and climate. Ecology 90: 2711-2723.
Singh L, Singh JS. 1991. Storage and Flux of Nutrients in a Dry Tropical Forest in India. Ann Bot 68: 275-284.
Slik JW, Aiba SI, Brearley FQ, Cannon CH, Forshed O, Kitayama K, Nagamasu H, Nilus R, Payne J, Paoli G, Poulsen AD, Raes N, Sheil D, Sidiyasa K, Suzuki E, van Valkenburg JLCH. 2010.
Environmental correlates of tree biomass, basal area, wood spe- cific gravity and stem density gradients in Borneo’s tropical forests. Glob Ecol Biogeogr 19: 50-60.
Slik JW, Paoli G, McGuire K, Amaral I, Barroso J, Bastian M, Blanc L, Bongers F, Boundja P, Clark C, Collins M, Dauby G, Ding Y, Doucet JL, Eler E, Ferreira L, Forshed O, Fredriksson G, Gillet JF, Harris D, Leal M, Laumonier Y, Malhi Y, Mansor A, Martin E, Miyamoto K, Araujo‐Murakami A, Nagamasu H, Nilus R, Nurtjahya E, Oliveira Á, Onrizal O, Parada‐Gutierrez A, Permana A, Poorter L, Poulsen J, Ramirez
‐Angulo H, Reitsma J, Rovero F, Rozak A, Sheil D, Silva‐
Espejo J, Silveira M, Spironelo W, ter Steege H, Stevart T, Navarro‐Aguilar GE, Sunderland T, Suzuki E, Tang J, Theilade I, van der Heijden G, van Valkenburg J, Van Do T, Vilanova E, Vos V, Wich S, Wöll H, Yoneda T, Zang R, Zhang MG, Zweifel N. 2013. Large trees and tropical forest biomass.
Glob Ecol Biogeogr 22: 1261-1271.
Spracklen DV, Righelato R. 2016. Carbon storage and sequestra- tion of re-growing montane forests in southern Ecuador. For Ecol Manag 364: 139-144.
Subashree K, Sundarapandian SM. 2017. Biomass and carbon stock assessment in two savannahs of Western Ghats, India.
Taiwania 62: 272-282.
Sudhakar Reddy C, Babar S, Amarnath G, Pattanaik C. 2011.
Structure and floristic composition of tree stand in tropical forest in the Eastern Ghats of northern Andhra Pradesh, India. J For Res 22: 491-500.
Sundarapandian SM, Dar JA, Gandhi DS, Kantipudi S, Subashree K. 2013. Estimation of biomass and carbon stocks in tropical dry forests in Sivagangai District, Tamil Nadu, India. Int J Environ Sci Eng Res 4: 66-76.
Sundarapandian SM, Mageswaran K, Sanjay Gandhi D, Dar JA.
2014. Impact of Thane Cyclone on Tree Damage in Pondicherry University Campus, Puducherry, India. Curr World Environ 9:
287-300.
Tiessen H, Feller C, Sampaio EVSB, Garin P. 1998. Carbon Sequestration and Turnover in Semiarid Savannas and Dry Forest. Clim Change 40: 105-117.
Whitmore TC. 1975. Tropical Rain Forests of the Far East.
Cleardon Press, Oxford.
Wiemann MC, Green DW. 2007. Estimating Janka hardness from specific gravity for tropical and temperate species. USDA Forest Service, Forest Products Laboratory, Madison, WI. Research Paper FPL-RP-643. pp 21.