Assessment of Biomass and Carbon Stock in Sal ( Shorea robusta Gaertn.) Forests under Two Management Regimes in Tripura, Northeast India
Journal of Forest and Environmental Science
J FES
Abstract
We investigated tree composition, stand characteristics, biomass allocation pattern and carbon storage variability in Sal forests (Shorea robusta Garten.) under two forest management regimes (Sal forest and Sal plantation) in Tripura, Northeast India. The results revealed higher species richness (29 species), stand density of 1060.00±11.12 stems ha−1 and diversity index (1.90±0.08) in Sal forest and lower species richness (4 species), stand density of 230.00±37.22 stems ha−1 and diversity index (0.38±0.15) in Sal plantation. The total basal cover (33.02±4.87 m2 ha−1) and dominance (0.76±0.08) were found higher in Sal plantation than the Sal forest (22.53±0.38 m2 ha−1 and 0.23±0.02 respectively). The total vegetation carbon density was recorded higher in Sal plantation (219.68±19.65 Mg ha−1) than the Sal forest (167.64±16.73 Mg ha−1). The carbon density estimates acquired in this study suggest that Sal plantation in Tripura has the potentiality to store a large amount of atmospheric carbon inspite of a very low species diversity.
However, Sal forests has also an impending sink of carbon due to presence of large number of young trees.
Key Words : biomass, carbon sink, diversity, management regimes, soil
Introduction
Forest ecosystems act as natural carbon sinks and play the most significant role by producing large carbon pools stored as vegetation biomass including storage of carbon in the soil (Brown and Lugo 1992). The carbon acquired from the atmosphere is fixed to form organic compounds through photosynthesis (Alexandrov 2007). Thus atmospheric car- bon becomes the part of the plant body and stored for a long period in different parts of the plant. The growing danger of increased environmental degradation and tangible economic services for human civilization, has resulted in primary old growth forest being replaced with planted forest, as a result biological diversity is lost due to the mismanagement of nat- ural resources. The roles of natural as well as planted forests
are being increasingly felt for diverse intangible services rather than tangible economic goods. Forest ecosystems are unique- ly placed in the global scenario of climate change as they are acting as storehouse of biodiversity and carbon sink (Dixon et al. 1994; Dirzo and Raven 2003; Gibbs et al. 2007; Fahey et al.
2010). Once the plant dies or the plant material decomposes the carbon is released to the soil. This carbon content can be released in the form of CO2 through decomposition of plant biomass and respiration, especially respiration of plant roots and the soil microbes. The amount of soil respiration that oc- curs in an ecosystem is largely controlled by factors like tem- perature, moisture, nutrient content and oxygen level.
It was reported that globally, biodiversity is changing at an unprecedented rate as a complex response to natural and human-induced changes (Vitousek 1997; FAO 2006). As per Journal of Forest and Environmental Science
Vol.34, No.3, pp.209-223, June, 2018 https://doi.org/10.7747/JFES.2018.34.3.209
Biplab Banik1, Dipankar Deb2,*, Sourabh Deb2 and B. K. Datta1
1Plant Taxonomy & Biodiversity Laboratory, Department of Botany, Tripura University, Suryamaninagar 799022, Tripura India
2Agroforestry& Forest Ecology Laboratory, Department of Forestry & Biodiversity, Tripura University, Suryamaninagar 799022, Tripura India
Received: October 30, 2017. Revised: January 4, 2018. Accepted: March 20, 2018
*Corresponding author: Dipankar Deb
Agroforestry & Forest Ecology Laboratory, Department of Forestry & Biodiversity, Tripura University, Suryamaninagar 799022, Tripura India Fax: 03812379269, E-mail: [email protected]
FAO (2012), the global forest area has decreased by 4.1 and 6.4 million ha year−1 and 3% of the world’s forest are dis- turbed annually by logging, fire, pests, or weather. It has been reported that more than 60% of the world’s forest are recov- ering from a past disturbance (FAO 2006). The role of trop- ical forest in mitigating climate change and potential effects on climate as result of deforestation have been extensively studied globally (Dixon et al. 1994; Houghton 1995; Masera et al. 1995; Fang et al. 1998; De Jong et al. 1999, 2000; Cairns et al. 2000; Grace et al. 2006). There is uncertainty in the magnitude of carbon flux due to tropical forest deforestation (Brown and Lugo 1984). In India, large areas of primary trop- ical forests are degraded at to a varying extent and converted to other land uses (Behera and Misra, 2006; Barik and Mishra 2008). About two-thirds of terrestrial C stored in terrestrial carbon pools like rocks and sediments and also sequestered in the standing forests, forest understory plants, leaf and for- est debris, and in forest soils (Sedjo et al. 1998). Out of total carbon stored in an ecosystem, 89 % of losses are due to loss of living biomass (Keith et al. 2014).
In India Sal is spread over an estimated area of 13 mil- lion hectares and primary Sal forest is gradually replaced by secondary regenerated Sal forest due to over-exploitation, deforestation, encroachment and alteration in land use and land cover (Deka et al. 2012). Species composition of forests depends on potential regenerative status of tree species with- in a forest stand (Ayyapan and Parthsarthy 1999) and forest biomass is drastically modified by the level of exploitation, successional levels, and management practices. Absence of all negative factors and good management practices including model plantations of Sal would contribute further in high bio- mass values. The protection of existing forests, regeneration of degraded forests and raising of forest plantations in India have been contributing at large extent to enhanced produc- tivity and carbon stock (Ravindranath et al. 2008).
Researches on carbon accumulation pattern and storage in forest ecosystem as well as plantation forest have gained mo- mentum. Forests cover 4.03 billion hectares globally, approx- imately 30% of the Earth’s total land area (FAO 2010). Natural forests possess high species diversity when compared with the plantation forests they are increasingly recognized for their capacity to sequester atmospheric carbon (Baishya and Barik 2011). It has been suggested that atmospheric carbon seques- tration through increasing the volume of plantation forest lands
on the planet is an effective measure for mitigating atmospher- ic carbon dioxide (Peichl and Arain 2006; Taylor et al. 2007).
Plantations represent a reservoir of biomass carbon similar to natural forest since stand age is the dominant factor influencing the total plantation ecosystem carbon pool (Justine et al. 2015).
Tropical plantation forests have a slight competitive advantage over the natural forests when sequestering at- mospheric C because of adoption of improved silvicultural practices (Baishya et al. 2009). Other studies estimated tree biomass and carbon (C) stock in different natural and plantation forests and yielded variable results (Young et al.
2005; Devagiri et al. 2013). The replacement of unproduc- tive natural forests with plantations could be considered as a measure to enhance carbon sequestration. Biomass and carbon density varies with climatic zones and different management regimes within land-use types (Upadhaya et al. 2015). The sequestration potential also varies with different age classes and species level density change that lead to stratification of different carbon pools (Baishya and Barik, 2011). More emphasis is placed estimating abo- veground biomass as it represents the 60% of total phyto- mass (Baishya et al. 2009) and considered as an important aspect while studying vegetation carbon pool (Ketterings et al. 2001). Furthermore assessment of other biomass components viz. belowground biomass, dead wood bio- mass and litter biomass is essential to account for the total carbon sequestered by the vegetation over a specific time and would be the key determinant of land use change and deforestation influence the net carbon fluxes. In terms of carbon benefit the present study has been conducted on Sal plantation and moist deciduous Sal forest in Tripura, Northeast India.
Therefore, the present study aims to assess stand charac- teristics, tree species composition, tree biomass and carbon stock (above and below ground) of Shorea robusta Gaertn.
dominated two management regimes (Sal forest and Sal plan- tation) of Tripura, Northeast India. It was also undertaken to understand the uncertainties and inconsistency of biomass and carbon stock variability in two management regimes.
Materials and Methods
Study area
The State Tripura has a tropical climate and receives
adequate rainfall during the monsoons. The local flora and fauna bear a close affinity and resemblance with In- do-Malayan and Indo-Chinese sub-regions (http://www.
forest.tripura.gov.in). The State is located in the bio-geo- graphic zone of 9B-North-East hills (Champion and Seth, 1968) and possesses an extremely rich bio-diversity. The state lies between 22°56’ to 24°32’ N latitude and 90°09’ to 92°20’ E longitude. The state experiences three different climates of tropical savanna, tropical monsoon and humid subtropical climatic condition (https://www.en.climate-da- ta). The temperature in the state ranges from 21°C to 38°C in summer, whereas it fluctuates from 13°C to 27°C in the winter season. The annual rainfall ranges from 1922 mm to 2855 mm. As per the report of the Forest Survey of India (FSI 2015) total forest and tree cover in the state is 8,044 km2 i.e., 76.71 % of the total State’s geographical area.
The forests of Tripura are divided into two major forest groups viz. - i) Semi Evergreen Forests and ii) Moist Decid- uous Forests (FSI 2011). The Moist Deciduous Forests are further divided into Moist Deciduous Sal Forests and Moist Deciduous Mixed Forests, the former beingt found in Be- lonia, Udaipur, Sonamura and Sadar Sub-Divisions of the state. Shorea robusta Gaertn. (commonly called as ‘Sal’) is the most dominant tree species in the Moist Deciduous Sal Forest occupying more than 60% top canopy (http://tspcb.
tripura.gov.in). This type of forest is also found in southern and northern low hills extending up to the border of Ban- gladesh. However, due to expansion of agriculture cou- pled with other landuse change in recent years, Sal forests have undergone significant changes in some areas of the state. Most frequently the native moist deciduous Sal forest found in Belonia, Udaipur, Sonamura and Sadar Sub-Divi- sions of the state. The major changes in this types of forest due anthropogenic pressure in terms of over exploitation of timber, fuelwood, extension of rubber plantation and other factors intensified the alteration of such forest cover into secondary degraded vegetation even in some PF and RF. However, as a management practices, several types of plantation program with native species had been carried out by Forest Department for rehabilitation of degraded forest for last few decades (Chakraborty 1985). In case of native Moist deciduous Sal forest potential silvicultur- al conditions prevail for forest production maintain by forest department. The present study area covered some
extent of such forest types which comes under the juris- diction of Sadar Forest Division, Udaipur Forest Division and Teliamura Forest Division comprising Reserve forest (23°28’41.80”N Lat. and 91°28’49.00”E Long.; 23°33’5.83”N Lat. and 91°25’10.54”E Long.; 23°30’20.40”N Lat. and 91°26’42.00”E Long.; 23°48’12.6”N Lat. and 91°38’36.8”E Long.), monoculture plantation (23°53’07.8” N Lat. and 91°17’21.2”E Long.). Among the studies one RF was sec- ondary regenerated Sal forest due to the past disturbances and gradual shift from primary forest.
Sample plot design and measurements
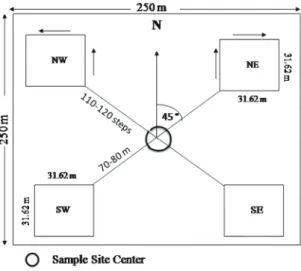
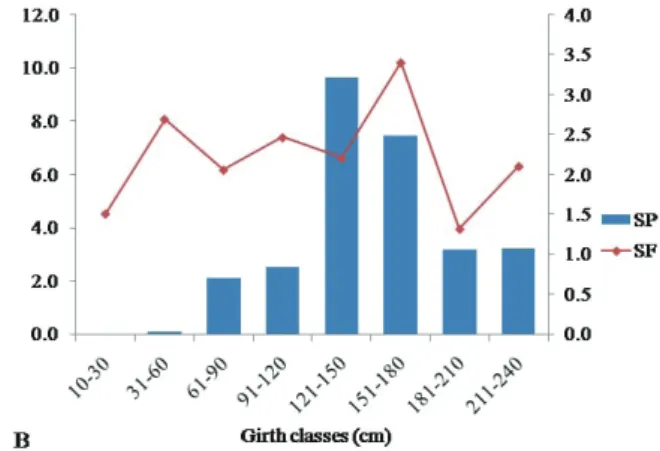
Assessment of terrestrial vegetation biomass in the five different sites of Tripura was carried out using ground sampling. The selection of representative sites in different forests divisions was made on the basis of type of forest stand (Moist deciduous Sal forest, Secondary Sal forest and Sal monoculture plantation) and magnitude of stem distri- bution in terms of homogeneity in girth class and height classes thereby reduction in sampling area. A permanent plot of 250 x 250 m size was established during field in- vestigation at each site. Four sample plots, each of 31.6 m x 31.6 m (0.1 ha) size in all the four directions i.e. NE, NW, SW and SE, respectively (Fig. 1.) were laid in each super plot for detail record such as forest type, species compo- sition, girth at breast height (gbh of ≥ 10 cm) and height measurement. Tree population structure were analyzed using eight girth classes i.e., 10-30, 31-60, 61-90, 91-120, 121-150, 151-180, 181-210, 211-240. Overall 8 quadrats for Moist Deciduous Sal Forest (SF) and 12 quadrats for Sal Plantation (SP) were considered for girth measurement.
All woody individuals at ≥10 cm girth over bark at 1.37 m height were measured which is a useful starting point for estimating tree volume. Height of all the trees present in the plot was measured using Clinometers. Basal area (m2) was calculated using the following equation adapted from the simple formula for the area of a circle (area = πr2).
Stand density of the tree species within the selected areas were assessed as the number of trees per unit area and ex- pressed per hectare basis.
Analytical features of the plant community (abundance, density and frequency) were calculated from field data for abundance, density and frequency following Curtis and McIntosh (1950). The relative frequency, relative density,
relative basal area and Importance Value Index (IVI) was calculated following Mueller–Dombois and Ellenberg (1974). Tree species diversity, dominance index of the stand and evenness of the stand of both the selected for- est types were calculated following Shannon and Weiner 1963, Simpson (1949) and Pielou (1966) respectively.
Fig. 1. Cluster sample plot design for enumerating trees species (Dadhwal et al. 2009).
Estimation of biomass & carbon density
Selection of methodological approaches before con- ducting any vegetation study is quite crucial when a large number of methods already had been practiced. There are a number of practical approaches to determine the stand volume by selecting and measuring the volume of an aver- age tree, then inflate this value for the stand volume. The above ground biomass (AGB) of the tree species of forest stand and plantation stand was calculated by the existing volume equations. Species specific volume equation de- veloped by Forest Survey of India (FSI 1996) and Biomass Conversion and Expansion Factor (0.8) for conversion of stem volume to above-ground Biomass (IPCC 2006), fol- lowed by Sahu et al. (2015) was considered under present study. In case of non-availability of species specific volume equation allometric biomass equation i.e. Above Ground Biomass (AGB) = exp[-0.37+0.33*ln(DBH)+0.933*ln(D- BH)2-0.122*ln(DBH)3] developed by Chambers et al. (2001) where AGB was calculated per tree in kg and diameter at
breast height (DBH) in cm. The allometric equation which was used for Moist deciduous Sal dominated mixed forest that have been suggested for vegetation carbon inventory (Chave et al. 2005) followed by many researchers of the North-eastern region (Baishya and Barik 2011; Upadhya et al. 2015). This is a very conventional method followed in several studies from the same eco-region of the North- East India and also in other states of the Indian territory (Salunkhe et al. 2016; Devagiri et al. 2013; Dadhwal et al.
2009) and has been suitable for biomass estimation by Non-destructive method (Table 1). The estimated volume was converted into biomass by using wood specific grav- ity of selected tree species developed by Forest Research Institute (FSI 1996). Below groundbiomass (BGB), dead wood biomass carbon (DWB C) of trees was determined by indirect method followed by Sahu et al. (2015). The esti- mation of forest floor litter biomass, the amount of per unit area was calculated as per Subedi et al. (2010).
For carbon stock assessment in all the study sites, IPCC (2006) suggested carbon fraction of 0.50 was used (Bhat and Ravindranath 2011; Mandal and Joshi 2014). Total veg- etation carbon stock of the selected stand was estimated by adding all the values of AGB C, BGB C, DWB C and LB C and converted as Mg C ha-1.
Soil carbon stock density
Soil samples were collected from four different corners from each of the quadrat maintaining 3 layers of the soil strata with the help of soil auger from 0-15, 15-30, 30-45 cm respectively. In total 60 samples (12 samples from each layer total of 36 samples from Sal plantation and 24 sam- ples from Sal forest) were collected from each depth class.
Collected soil samples were brought to the laboratory and air-dried. Samples were passed through a 2 mm sieve to remove stones, roots and large organic residues before conducting analyses of physical and chemical characteris- tics. Bulk density was determined by the core method. Soil organic Carbon (SOC %) was determined by Walkley-Black Method (1934) and carbon stock density of soil was esti- mated by following Pearson et al. (2007).
Statistical analysis
The variation in tree density, basal area, biomass and carbon stock due to differences in vegetation type were
statistically analyzed using one-way analysis of variance (ANOVA). Comparison was also made between two land use types (Sal forest to Sal plantation) across different bio- mass and soil parameters. Data were analyzed using M.S.
Excel 2007 (12.0.4518.1014).
Results
Stand structure and characteristics
The Sal forests differed in their structure and community characteristics (Table 2). Maximum number of species (29 tree species) with a mean stem density of 1060.00±11.12 stem ha-1 and mean basal cover of 22.53±0.38 m2 ha-1 was recorded for moist deciduous Sal forest. On the other hand
low species richness (4 tree species) with a mean stem density of 230.00±37.22 stem ha-1 and mean basal cover of 33.02±4.87 m2 ha-1 was recorded for Sal plantation (Ta- ble 3). The result of ANOVA showed significant variation in stand characteristics. Stand density and basal cover of tree species were significantly different in all the selected stands (F=11.05, df=4,15; P<0.001 and F=7.23, df=4,15;
P<0.05, respectively). Furthermore, results of the t-test also suggested that stem density (t=4.86, df=7; p<0.05) was sig- nificantly higher in Sal forest than Sal plantation. Thoughba- sal cover (t=5.65, df=7; p<0.05) was significantly higher in Sal plantation than Sal forest. The number of family and ob- served species in both the management regimes showed different trend of distribution. Mean Shannon’s index value Table 1. Volume equations and wood specific gravity used in the present study
Species Volume equation Type
Species specific
gravity Albizia lebbeck (L.) Benth. V/D2H = −0.00858/D2H+0.0000316 G (North Cachar
Hills) 0.760
Albizia procera (Roxb.) Benth. √V = −0.23861+3.22483D L (Tripura Survey) 0.579
Anogeissus acuminata (Roxb. ex DC.) Wall. ex
Guillem. & Perr. V = 0.099−1.119D+8.2D2 L (MP, Andhra P and
Orissa) 0.880
Artocarpus chama Buch.−Ham. √V = −0.15154+2.79983D L (Tripura) 0.450
Bombax ceiba L. √V = −0.24276+2.95525D L (Tripura Survey) 0.329
Callicarpa arborea Roxb. √V=0.04506+2.33446D L (Assam Survey) 0.410
Dillenia pentagyna Roxb. √V = −0.18641+2.87919D L (Tripura Survey) 0.579
Ficus hispida L.f. √V = 0.03629+3.95389D−0.84421 √D 0.390
Grewia nervosa (Lour.) Panigrahi V = −0.44075+7.49221D−36.09962D2+71.91238D3 L (Assam Survey) 0.703 Holarrhena pubescens Wall. ex G.Don V = 0.17994−2.78776D+14.44961D2 L (Assam Survey) 0.640
Lannea coromandelica (Houtt.) Merr. √V = −0.21972+2.86603D L (Tripura Survey) 0.513
Phyllanthus emblica L. V = 0.13734−2.49039D+15.59566D2−11.06205D3 L (Assam Survey) 0.619
Schima wallichii Choisy √V = −0.11242+2.54133D L (Tripura Survey) 0.550
Shorea robusta Gaertn. √V = −0.22388+3.29474D L (Tripura Survey) 0.700
Sterculia villosa Roxb. V = 0.27909−3.26515D+13.46829D2 L (Assam Survey) 0.543
Tectona grandis L.f. V =0.19112−3.25372D+17.9194D2−1.66117D3 L (Assam Survey) 0.720 Terminalia bellirica (Gaertn.) Roxb. √V = −0.00598+2.28626D L (Tripura Survey) 0.628
Vitex peduncularis Wall. ex Schauer √V = −0.26502+3.01933D L (Tripura Survey) 0.300
Source: (FSI 1996).
Note: V= Volume (m3), D= DBH (cm), H= height (m), L=Local volume equation, G=General volume equation.
was higher in Sal forest (1.90±0.08) than in Sal plantation (0.38±0.15) and Simpson’s index value also varied from site to site and was significantly (p<0.05) higher in Sal plan- tation (0.76±0.08) due to homogeneity of the stand in tree species composition than Sal forest (0.23±0.02). Species were evenly distributed in all the studied sites except in Sal plantation compared to Sal forest. In each stand type dis- tribution of density and basal area in different gbh classes were shown in Fig. 2.A-D. In Sal planation maximum den- sity was recorded in 121-150 cm gbh class followed by 61- 90 gbh class. Overall, 87.3% density was recorded between 61 and 180 cm gbh in Sal plantation while 84.8% density was recorded between 10-60 cm gbh in Sal forest indicat- ing good occurrence of juvenile and adult tree species and
marked reduction of species of higher-diameter classes.
Biomass and carbon stock
The biomass allocation in different pools viz. above ground biomass (AGB), below ground biomass (BGB), dead wood biomass (DWB) and litter biomass (LB) in five differ- ent sites categorized into two vegetation type varied from Sal plantation to Sal forest. Sal plantation possessed maximum AGB (179.88±29.43 Mg ha-1) in girth class 121-150 cm fol- lowed by 110.53±1.82 Mg ha-1 in girth class 31-60 cm recorded in Sal forest (Fig. 2C.). Among different sites, maximum con- tribution was made by Shorea robusta in Sal plantation (72.5%) and Sal forest (46.5%) (Fig. 2D.). The AGB and BGB biomass when pooled together registered higher biomass in Sal plan-
Fig. 2A. Girth class distribution of tree density.
Fig. 2C. Above ground tree biomass (ABG) in Sal plantation (SP) and Sal forest ecosystem.
Fig. 2B. Girth class distribution of tree basal area cover (BA).
Fig. 2D. Above ground biomass attribute of tree species (AGTB) and the contribution of Shorea robusta as the greatest degree of biomass potential.
Table 2. Phyto-sociological attributes of tree species in Sal forests under two management regimes in Tripura, Northeast India Species NameFamilyRelative FrequencyMean Density Stem ha-1Relative AbundanceBA m2 ha-1IVI SPSFSPSFSPSFSPSFSPSF Albizia lebbeck (L.) Benth.Leguminosae_2.08_5.00_1.17_0.03_2.82 Albizia procera (Roxb.) Benth.Leguminosae_3.70_10.00_1.61_1.94_13.47 Alstonia scholaris (L.) R. Br.Apocynaceae_2.08_7.50_1.75_0.06_3.34 Anogeissus acuminata (Roxb. ex DC.) Wall. ex Guillem. & Perr.Combretaceae_6.02_50.00_2.70_0.91_17.76 Aporosa octandra (Buch.-Ham. ex D.Don) VickeryPhyllanthaceae_2.08_5.00_1.17_0.01_2.66 Artocarpus chama Buch.-Ham.Moraceae32.5014.8150.0010.0027.691.618.234.2186.5434.16 Bauhinia acuminata L.Leguminosae_4.17_20.00_2.33_0.30_8.76 Bombax ceiba L.Malvaceae_3.70_10.00_1.61_0.02_5.40 Bridelia retusa (L.) A.Juss.Phyllanthaceae_6.25_7.50_0.58_0.01_7.13 Callicarpa arborea Roxb.Lamiaceae_8.33_35.00_2.04_0.18_13.44 Careya arborea Roxb.Lecythidaceae_6.60_66.25_10.78_0.33_18.67 Cassia fistula L.Leguminosae_6.25_60.00_4.67_0.34_15.23 Dillenia pentagyna Roxb.Dilleniaceae_7.41_20.00_3.23_0.10_11.07 Ficus hispida L.f.Moraceae_2.08_5.00_1.17_0.03_2.85 Grewia nervosa (Lour.) PanigrahiMalvaceae_6.02_73.75_4.82_0.44_17.50 Holarrhena pubescens Wall. ex G.DonApocynaceae_4.17_47.50_5.54_0.33_11.75 Lannea coromandelica (Houtt.) Merr.Anacardiaceae_2.08_5.00_1.17_0.21_4.33 Mitragyna rotundifolia (Roxb.) KuntzeRubiaceae_2.08_5.00_0.58_0.01_2.68 Phyllanthus emblica L.Phyllanthaceae_2.89_6.25_1.10_0.03_4.02 Schima wallichii ChoisyTheaceae20.008.6810.0028.7510.002.652.530.6733.9016.97 Shorea robusta Gaertn.Dipterocarpaceae63.3311.57165.00311.2576.9240.3321.9710.54221.69104.00 Spondias pinnata (L. f.) KurzAnacardiaceae_3.70_20.00_3.23_0.07_7.24 Sterculia villosa Roxb.Malvaceae_4.17_5.00_0.58_0.08_5.33 Suregada multiflora (A.Juss.) Baill.Euphorbiaceae_4.17_10.00_1.17_0.06_5.71 Syzygium cumini (L.) SkeelsMyrtaceae25.006.255.0025.003.851.940.290.1428.1810.00 Tectona grandis L.f.Lamiaceae_4.17_32.50_3.79_0.88_14.96 Terminalia bellirica (Gaertn.) Roxb.Combretaceae_7.41_130.00_20.97_0.47_30.36 Vitex peduncularis Wall. ex SchauerLamiaceae_5.79_38.75_5.86_0.08_12.01 Ziziphus oenopolia (L.) Mill.Rhamnaceae_3.70_10.00_1.61_0.04_5.48 Note: SP - Sal plantation and SF - Sal forest.
tation (226.65 Mg ha-1) than in Sal forest (139.27 Mg ha-1) (Ta- ble 4). Total carbon estimated in all pools in Sal plantation was 219.68±19.65 Mg ha-1 while the corresponding value for Sal forest was 167.64±16.73 Mg ha-1. In both the systems, the contribution of SOC was maximal to the total carbon stock;
however, the relative contribution of SOC to the total carbon was conspicuously higher in Sal forest than Sal plantation. In terms of biomass productivity above ground biomass varies significantly from site to site (F=21.97, df=4,15; P<0.05) and significantly higher in Sal plantation than Sal forest (t=9.08, df=7, P<0.05). Sal forest showed significantly lower biomass density than Sal plantation since these sites accounted high- er species density and considered to be as disturbed forest.
Due to the irregular felling of trees and comparatively lesser number of mature trees formation of secondary forest though natural regeneration was found be very high (Table 4).
ANOVA showed significant variation in organic carbon accumulation within all sites (F=6.42, df=4,15; P<0.05) whereas t-test showed comparatively greater (t=38.64, df=7, P<0.001) mean soil organic carbon stock in Sal plan- tation than the mean value recorded for Sal forest however mean percent organic carbon content was higher in Sal forest (1.67±0.27) with mean bulk density of 1.78±0.04 than Sal plantation (1.59±0.35) with mean bulk density 1.95±0.04 and it can be assumed that due to high degree of compact- ness, porosity and bulky nature of the soil may lead to the uplift of organic matter deposition in various soil depth.
Correlation matrix (Table 5) highlighted a positive re- lation between SOC stocks which is depended on bulk density (62% variation in SOC can be explained by bulk density). A strong and significantly positive correlation (0.83) was found between aboveground tree biomass and evenness index and it can be presumed that homogeneity in species composition along with their diameter class dis- tribution is the key determinant of enhanced productivity.
A positive correlation was found between aboveground biomass and basal cover by tree species. However, above ground biomass was not correlated with stem density.
Discussion
Stand structure and characteristics
Large and relatively low cost mitigation opportunities through biomass accumulation on the pick of global car-
bon issues likely to be attained by extensive studies. The results of this study revealed that the magnitude of bio- mass storage is comparatively higher in Sal plantation than Sal forest may be attributed to the adoption of proper silvi- cultural management practices including timber harvest- ing, fire management, adequate regeneration of suitable species. Moreover information on the species composition of a forest is essential for its sustainable management in terms of economic value, regeneration potential and ultimately may be leading to conservation of biological diversity. The observed tree species density was higher in Sal forest than Sal plantation and was comparable with the other studies reported from India. Jha and Singh (1990) reported 294–559 tree ha-1 in Sal forest from Central In- dia and 408 trees ha-1 was reported in Gorakhpur, India by Pandey and Shukla (2003). In moist Sal forests of West Bengal, India (Kushwaha and Nandy 2012) and in Doboka reserve forest, Assam, NE India (Dutta and Devi 2013) the reported tree densities were 438 tree ha-1 and 422 tree ha-1 respectively. However, Nag and Gupta (2014) report- ed much higher stem densities (1441 to 2233 stem ha-1) with basal area cover between 12.89 m2 ha-1 and 13.89 in Dry Deciduous Shorea robusta forests of West Bengal. The higher stem density recorded in their study was attributed to higher regeneration Sal forest owing to increased an- thropogenic disturbances. The present study recorded low species richness (4) in plantation and comparatively higher species richness (29) in forest and such estimates was also comparable with Rabha (2014a) who reported 3 species in disturbed Sal forests and 18 species in undisturbed Sal forests in Goalpara, Assam, Northeast India and also com- parable with the other studies reported from different part of Northeast India (Deka et al. 2012; Dutta and Devi 2013). Rabha (201b) reported mean stem density and basal area of 830±33.6 tree ha-1 and 26.29±1.0 m2 ha-1 respec- tively of an undisturbed Sal forest. and stand density of the six stands ranged between 560 and 846 trees ha-1 with a mean value of 673±40 ha-1 in Meghalay, Northet India was reported by Upadhaya et al. (2015). Whereas basal cover distribution did not show any similarity with the present findings. The observed Shannon diversity index (0.4-1.9) of the present study was within the range (0.83 to 4.1) for different Indian forests reported by Visalakshi (1995) and Mishra et al. (2000). Kent and Coker (1992) reported di-
Table 3. Species diversity, dominance and structural variables in Sal forests under two management regimes in Tripura, Northeast India
Parameters Stand Type
SP SF
Number of species 4 29
Number of genera 4 28
Number of family 4 17
Density (stem ha-1) 230.00±37.22 1060.00±11.12
Basal area (m2 ha-1) 33.02±4.87 22.53±0.38
Dominance Index 0.76±0.08 0.23±0.02
Diversity Index 0.38±0.15 1.90±0.08
Evenness Index 0.92±0.08 0.53±0.04
SP-Sal plantation, SF-Sal forest, ± SEM, n=8
Table 4. Biomass stock, carbon allocation and soil attributes (0-45 cm depth) of Sal forest under two management regimes in Tripura, Northeast India
Major pools Stand Type
SP SF
AGB (Mg ha-1) 179.88±29.43 110.53±1.82
AGB C (Mg C ha-1) 89.94±14.72 55.27±0.91
BGB (Mg ha-1) 46.77±7.65 28.74±0.47
BGB C (Mg C ha-1) 23.38±3.83 14.37±0.24
DWB C Mg ha-1 12.47±2.04 7.66±0.13
LB C Mg ha-1 1.25±0.01 1.49±0.12
SOC (%) 1.59±0.35 1.67±0.27
SOC Mg ha-1 92.64±2.53 88.85±4.07
Total C Mg ha-1 219.68±19.65 167.64±16.73
Soil Temperature 28.73±0.26 28.55±0.75
Soil Moisture Content 16.06±0.35 18.92±0.94
Bulk Density 1.95±0.04 1.78±0.04
pH 5.00±0.14 5.46±0.12
OM (%) 3.55±0.05 3.73±0.06
SP-Sal plantation, SF-Sal forest, ± SEM, n=8
Table 5. Correlation matrix between stand structural variables (stem density and basal area); diversity indices (Dominance index, Shannon index and Evenness index), above ground carbon pool (above ground tree biomass, aboveground biomass carbon) and soil characteristics (bulk density, soil organic carbon percent, soil organic carbon stock) among two different management regimes
Stem Density
ha-1
Basal Area (m2 ha-1)
Dominance_
D
Shannon_
H Evenness
(H´/log(S))
AGTB (Mg ha-1)
AGB C (Mg ha-1)
Bulk Density (g
cm-3)
SOC (%) SOC (Mg ha-1)
Stem Density ha-1 -
Basal Area (m2 ha-1) -0.99ns -
Dominance_D -0.72ns 0.61* -
Shannon_H 0.83* -0.74ns -0.97ns -
Evenness (H´/log(S)) -0.87ns 0.81* 0.83* -0.93ns -
AGTB (Mg ha-1) -0.78ns 0.75* 0.83* -0.83ns 0.83* -
AGB C (Mg ha-1) -0.78ns 0.75* 0.83* -0.83ns 0.83* - -
Bulk Density (g cm-3) -0.89ns 0.91* 0.62* -0.66ns 0.60* 0.75* 0.75* -
SOC (%) 0.60* -0.59ns -0.74ns 0.66* -0.56ns -0.92ns -0.92ns -0.76ns -
SOC (Mg ha-1) -0.63ns 0.68* 0.06 -0.22ns 0.25 0.05 0.05 0.62* 0.04 -
* significance p< 0.05, ns- not significant.
versity index value which varies from 1.5 to 3.5 and rarely cross the value of 4.5 whereas Parthasarathy et al. (1992) and Visalakshi (1995) reported this index value varies from 0.83 to 4.1 for Indian forests. Present synthesis on struc- tural and compositional attributes of plantation forest and natural forest land would play a vital role in future to un- derstand about prioritization of plantation activity and the role of dominant species in terms of ecosystem services.
Biomass and carbon stock
Biomass allocation pattern and carbon stock density of the tree layer showed overall higher biomass and carbon storage in planted sal forest than naturally grown sal forest. The present estimates of above ground tree biomass (AGB) in Sal plantation is lower than the estimates of similar studies conducted in tropical semi-evergreen forest and Sal plantation forest of of Nongkhyllem wildlife sanctu- ary in Meghalaya, Northeast India (Baishya et al. 2009).
However, it was in the range of the earlier estimate of AGB in a recovering tropical Sal forest of Eastern Ghats, India, (ranged 12.68-231.91 Mg ha-1) along with AGB (261.08 Mg ha-1) for 10-year-old Sal stand (Behera and Misra 2006) and also close to the reported value of ABG ranged 149-389 Mg ha-1 with a mean value of 254 Mg ha-1 for Community Managed Hill Sal Forests of Central Nepal (Thapa-Magar and Shrestha 2015). The observed AGB was also compara- ble with the findings of Rabha (2014b) who estimated AGB of 239.45 Mg ha-1 for an undisturbed regenerating Sal forest of Assam, North-East India. Chaturvedi and Raghubanshi (2015) reported biomass carbon of 176 Mg C ha-1 for the mono-specific (Sal) category on determination of carbon density ( Kg-C ha-1) of a tropical dry region in India which was less than the present above ground biomass carbon value of 167.64 Mg C ha-1 in Sal forest. Forest inventory study during 2002-2008 by Forest Survey of India (FSI), es- timated carbon stocks in different pools viz. above ground, below ground, deadwood, litter biomass and soil organic matter of very dense tropical moist deciduous forests, moderate dense tropical moist deciduous forests and open tropical moist deciduous forests as 124.98 Mg ha-1, 95.38 Mg ha-1 and 65.25 Mg ha-1 respectively which was compa- rable and slightly higher than the present value (93.72 Mg ha-1) as per forest types. However, present value was quite low compared to that of Shrestha et al. (2000), who report-
ed above ground tree biomass in the range of 337–698 Mg ha-1 in Sal regenerating forests of Central Nepal. AGB es- timated for plantation and forest in the present study was very less than the reported value ranged 255.96-259.8 Mg ha-1and ranged 204.15- 272.83 Mg ha-1 in Sal plantation and mixed sal natural forest repectively of Meghalaya, North- East India (Upadhaya et al. 2015). The value of AGB (110.53 Mg ha-1) obtained in the Sal forests is within the range (27.5- 205.50 t ha-1) reported by Pande and Patra, (2010); also within the range (32.4-261.61 Mg.ha-1) reported by Borah et al. (2013) from tropical moist evergreen and tropical semi-evergreen forests and much higher than the value of AGB (42.26 Mg ha-1) reported from tropical moist decid- uous Sal forest (Majumdar et al. 2016). The present study implies that the remarkable less trend in biomass storage potential of the Sal forest of the State. The AGB of Sal forest in most of cases contrasts the findings of earlier workers from different region of India. Baishya et al. (2009) report- ed that the tropical plantation forests had an edge over the natural forests in terms of carbon storage because of adop- tion of improved forestry practices. Forest stand having mixed species can sequester CO2 rapidly due to different photosynthetic rate by species (Montagnini and Porras 1998). In spite of the best protection efforts, most natural tropical forests are now under threat due to various human activities (Chaturvedi et al. 2011). It is an undisputed fact that natural forests harbour high diversity, plantation forests are increasingly recognized for their capacity to sequester atmospheric carbon. However, studies attempting to esti- mate tree biomass and carbon stock in different natural and plantation forests yielded variable results (Chen et al. 2005;
Young et al. 2005; Devagiri et al. 2013).
The variability observed in two different management re- gimes in terms of carbon storage potential may be attributed to the stand structure adopted management practices. The biomass and C stocks are primarily determined by the diam- eter distribution of trees and species composition (Clark and Clark 2000). With the agreement of earlier workers (Brown and Lugo 1992; Brown et al. 1995; Brown 1996; Clark and Clark 1996; Terakunpisut et al. 2007; Baishya et al 2009; Up- adhyaya et al. 2015) it was quite clear that in terms of carbon storage large trees (>70 cm dbh) generally contribute max- imum storage potential but does not undermine the role of small trees with lower dbh classes (<60 cm dbh) which would
enhance the future carbon stock because of their high carbon sequestration potential. In this concern it was also suggested to forest managers to fill the blanks inside the forest by target species to enhance tree productivity and this will also helpful to maintain the tree composition of the forest (Pande 2002).
In natural forests, there is a net addition to standing biomass leading to carbon storage if most trees are yet to be matured.
However, Plantation forests with higher annual productivity were reported to be ideal for carbon storage and sequestra- tion. In the contrary with the other results our results has reflected such variation in terms of carbon allocation pattern and it can be concluded that the Sal forests of Tripura were ex- posed to different intensities of anthropogenic disturbances in the past and differential management practices adopted in Sal plantation seem to be one of the most important determi- nants of tree density-diameter distribution that has affected the AGB, BGB and C stock of the forest stands.
Due to being inconsistent and lacking a harmonious uni- formity, generalization of the role of plantation forests contrast to natural plantation in stocking carbon at global level has been barred and it has been also given the evidence against the replacement of natural forests by the plantations as a measure to enhance carbon sequestration (Liao et al. 2010).
Shorea robusta Gaertn. also possess good natural regenera- tion capacity and fast growing ability. Therefore, this species came out as significant carbon sequester in this region and long term monitoring of carbon dynamics. However, lower plant diversity in Sal plantation could potentially decline the ability of long lived carbon pools of terrestrial ecosystems to continue to act as carbon sinks of atmospheric CO2 (Fan et al.
1998; Pacala et al. 2001). A result from other mixed species plantations suggests that the identity of the dominant tree species plays an important role in determining carbon gained by the trees (Redondo-Brenes 2007). It was reported by Baishya et al. (2009) that large trees which represents maxi- mum diameter range in a forest stand contribute 49% to the total AGB in natural forest. In contrast, the contribution of the smaller trees to total AGB in the plantation forest was higher (76%) than the larger trees. However present study recorded 72.46 % of total AGB production by a single dominant tree species in Sal plantation. It was reported that the contribution of large trees to AGB in natural forest is considerably higher (Brown and Lugo 1992; Brown 1996; Clark and Clark 1996).
Analyses have shown that forests with reduced biomass ei-
ther had their large trees removed by past human disturbance or represent regenerating secondary forests which do not yet have large trees. The distribution of biomass in large trees, therefore, could be an indicator of the presence or absence of past anthropogenic disturbance (Brown 1996).
In natural ecosystem, soil plays a very important role in regulating the environment. Soil nutrient level is a key attribute which influence soil’s capacity to support ecosystem services.
The differences in soil organic carbon (SOC) stock is mainly influenced by land use types. This suggests that differential use of forest land have fundamental difference in net prima- ry productivity and carbon cycling processes. The observed SOC% of the present study revealed higher value of SOC% in Sal forest than Sal plantation which was similar to the findings of Chauhan et al. (2010) who reported SOC% value of 2.2 and 1.5 in natural Sal forest and planted forest. The present value was quite higher than the findings of Thapa et al. (2011) who reported SOC% value of 0.88 and 1.05 in Sal plantation and Sal natural forest respectively.. The decrese in SOC% in Sal plantation may be attributed to the less number of tree species, removal of top soil through erosion and increased soil compactness resulting into increased soil bulk density (Mills and Cowling 2010). However, present study did not follows any definite pattern of soil organic carbon stock (SOC stock) distribution. Shin et al. (2007) reported over exploitation of forest resources and forest land encroachment reduces soil carbon faster. However present study is comparable with the findings of Singh et al. (1991) in tropical moist deciduous forest of Mizoram who reported SOC stock value ranged 82.1-134.1 Mg C ha-1 and also comparable with the reported SOC stock value ranged 31.0 – 62.90 Mg ha-1 in the top 30 cm depth de- pending upon the tree density and age of the stand tree (Negi and Chauhan 2002). As the forest ages the organic matter deposition as a result of litter fall and along with the reduced soil disturbance the soil switches from losing carbon to begin- ning to sequester carbon (Mao et al. 2010).
Conclusion
The estimated high C stocks in Sal plantation than the Sal forest in the present study suggest that the former is more productive in terms of carbon storage than the later owing to its less species diversity, uniform age and struc- ture. The study further suggests that greater carbon stock
may not always be associated with higher diversity. The Sal forest, on the other hand had higher species diversity implying a better role in carbon sequestration in long run if suitable management are undertaken.
Acknowledgements
We gratefully acknowledge the supports of Mr. Jitaditya Debnath, Mr. Prasanta Debbarma and Mr. Mantosh Roy for proving assistance in the field work. The authors also thankful to all anonymous reviewers for improving the first draft of the manuscript.
Disclosure statement
No potential conflict of interest was reported by the au- thors.
References
Alexandrov GA. 2007. Carbon stock growth in a forest stand:
the power of age. Carbon Balance Managt 2: 4.
Ayyappan N. Parthasarthy N. 1999. Biodiversity inventory of trees in a large scale permanent plot of tropical evergreen forest at Varagalaiar, Anamalai, Western Ghats, India. Bio- divers Conserv 8: 1533–1554.
Baishya R, Barik SK, Upadhaya K. 2009. Distribution pattern of above ground biomass in natural and plantation forests of humid tropics in north east India. Trop Ecol 50: 295-304.
Baishya R, Barik SK. 2011. Estimation of tree biomass carbon pool and net primary production of an old-growth Pinus kesiya Royle ex Gordon forest in north-eastern India. Ann For Sci 68: 727–736.
Barik SK, Mishra SK. 2008. Assessment of the contribution of forests to the economy of the north-eastern states of India.
Int Forest Rev 10: 349-361.
Behera SK, Misra MK. 2006. Above ground tree biomass in a recovering tropical sal (Shorea robusta Gaertn.) forest of Eastern Ghats India. Biomass Bioenergy 30: 509– 521.
Bhat DM, Ravindranath NH. 2011. Above ground standing biomass and carbon stock dynamics under a varied degree of anthropogenic pressure in tropical rain forests of Uttara Kannada district Western Ghats, India. Taiwania 56: 85-96.
Borah N, Nath AJ, Das AK. 2013. Aboveground biomass and carbon stocks of tree species in tropical forests of Cachar District Assam Northeast India. Int J Ecol Environ Sci 39:
97-106.
Brown S, Lugo AE. 1984. Biomass of tropical forests: a new estimate based on forest volume. Science 223: 1290-1293.
Brown S, Lugo AE. 1992. Above ground biomass estimates for tropical moist forests of the Brazilian Amazon. Inter- ciencia 17: 8-18.
Brown S. 1996. Tropical forests and the global carbon cycle:
estimating state and change in biomass density. pp. 135- 144. In: M. Apps & D. Price (eds.) Forest Ecosystems, Forest Management and the Global Carbon Cycle. NATO ASI Se- ries, Springer- Verlag.
Cairns MA, Haggerty PK, Alvarez R, De Jong BHJ, Olmsted I.
2000. Tropical Mexico’s recent land-use change: a region’s contribution to global carbon cycle. Ecolo Appl 10: 1426- 1441.
Chakraborty RN. 1985. First Working Plan for Sadar Forest Division Part I, II & APP Tripura for the Year 1975–1976 to 1984–1985.
Champion HG, Seth SK. 1968. A Revised Survey of the Forest Types of India. Govt of India publications New Delhi.
Chaturvedi RK, Raghubanshi AS. 2015. Assessment of carbon density and accumulation in mono- and multi-specific stands in Teak and Sal forests of a tropical dry region in In- dia. Forest Ecol Manag 339: 11–21.
Chaturvedi RK, Raghubanshi AS, Singh JS. 2011. Carbon density and accumulation in woody species of tropical dry forest in India. Forest Ecol Manag 262: 1576-1588.
Chambers JQ, Santos DJ, Ribeiro RJ, Higuchi N. 2001. Tree damage allometric relationships and above-ground net primary production in central Amazon forest. Forest Ecol Manag 152: 73–84.
Chauhan DS, Singh B, Chauhan S, Dhanai CS, Todaria MP.
2010. Regeneration and Plant Diversity of Natural and Planted Sal (Shorea robusta GaertnF) Forests in the Terai – Bhabhar of Sohagibarwa Wildlife Sanctuary India. J Am Sci 6: 32-45.
Chave J, Andalo C, Brown S, Cairns MA, Chambers JQ, Ea- mus D, Fölster H, Fromard F, Higuchi N, Kira T, Lescure JP, Nelson BW, Ogawa H, Puig H, Riéra B, Yamakura T. 2005.
Tree allometry and improved estimation of carbon stocks and balance in tropical forests. Oecologia 145: 87–99.