J F E S
Journal of Forest and Environmental Science
Journal of Forest and Environmental Science Vol. 34, No. 5, pp. 359-375, October, 2018 https://doi.org/10.7747/JFES.2018.34.5.359
Forest Floor Biomass, Litterfall and
Physico-chemical Properties of Soil along the Anthropogenic Disturbance Regimes in Tropics of Chhattisgarh, India
P. R. Oraon1, Lalji Singh2 and Manoj Kumar Jhariya3,*
1Department of Silviculture and Agroforestry, Faculty of Forestry, Birsa Agriculture University, Ranchi-834006 Jharkhand, India
2Indira Gandhi Krishi Vishwavidyalaya, Raipur-492012 (Chhattisgarh), India
3Department of Farm Forestry, Sarguja University, Ambikapur-497001 (Chhattisgarh), India
Abstract
The long term ecological effects have been reported in natural forest ecosystem due to various anthropogenic disturbances, especially in tropics of the world. The present study was carried out in the sanctuary area of central India to assess the changes on litter biomass, litterfall pattern and soil attributes under different disturbance regimes. The study area includes three forest circles i.e., Bhoramdeo, Jamunpani and Salehwara each comprising three disturbances regimes viz., high, medium and low severity of biotic pressure. A noticeable variation and impact were recorded in different sites. The impact varies significantly from least disturbed sites to highly disturbed sites across the circle and among different disturbances level. The seasonal mean total forest floor biomass across the forest circles varied from 2.18 to 3.30 t ha-1. It was found highest under lightly disturbed site and lowest under heavily disturbed site. Total litterfall varied from 5.11 to 7.06 t ha-1 yr-1 across the forest circle. Lowest litterfall was recorded at heavily disturbed site while highest in lightly disturbed site. Annual turnover of litter varied from 69-73% and the turnover time ranged between 1.37-1.45 years. The turn over time was higher for heavily disturbed site and lower for lightly disturbed site. The heavily disturbed site of all the circle showed the sandy loam soil texture, whereas moderately and lightly disturbed site comprised of sandy loam, sandy clay loam and clay soil texture, respectively. The bulk density decreases from heavily disturbed site to lightly disturbed site and the pH of soils ranged from 5.57-6.89 across the circle. Across the circle the total soil nitrogen ranged from 0.12-0.21%, phosphorus from 10.03-24.00 kg and Potassium from 139.88-448.35 kg ha-1, respectively. Our results demonstrate that anthropogenic disturbances regime significantly influences forest floors in terms of mass, composition and dynamics along with litterfall rate and soil properties.
Key Words: disturbance regimes, forest soils, littermass, tropical forest
Received: February 23, 2018. Revised: September 12, 2018. Accepted: September 17, 2018.
Corresponding author: Manoj Kumar Jhariya
Department of Farm Forestry, Sarguja University, Ambikapur-497001 (Chhattisgarh), India Tel: 91-07774-223242, Fax: 91-07774-222791, E-mail: [email protected]
Introduction
Tropical forests are faced with a substantial loss of forest cover due to biotic interferences. The various forms of land
use influence habitat structure, composition, site’s micro- climate, which in turn possible effects on ecosystem proc- esses (Kagezi et al. 2016; Jhariya 2017a,b; Yadav et al.
2017). The disturbances in forest ecosystem may sig-
nificantly influence the structure, composition, litter pro- duction, their subsequent decomposition and properties of soils (Xuluc-Tolosa et al. 2003; Dezzeo et al. 2004; Yadav et al. 2008; Jhariya 2010, 2014, 2017a,b). Factors such as, species pool, site quality and disturbance regime control the vegetation dynamics and soil properties of forest ecosystem (Shrestha et al. 2000; Yadav et al. 2008; Triadiati et al.
2011; Sahu et al. 2013; Jhariya 2014; Yadav et al. 2017).
The ecology related to litter and forest floor in forest ecosys- tems emphasized their role in carbon balance, nutrient cy- cling and soil health. Therefore, it is essential to measure the amount of forest floor and litterfall in addition to its pat- tern of senescence in particular site, habitat by forest types to determine and understand the ecosystems process and functioning (Berg 2000; Wang et al. 2008; Jhariya 2014 &
2017a).
The addition of litter in forest floor and further its de- composition is important for productive ecosystem espe- cially in tropics because here soils are weathered and nu- trient limited or poor (Martius et al. 2004). In the tropics of the world, forest disturbances and changes in land-use con- stitute a matter of serious concern because it causing loss to ecosystem structure, function and biodiversity of a region (Pimm and Raven 2000; Bihn et al. 2008; Yadav et al.
2017). The decomposition rates of litter in tropics have been reported higher in primary forests then the disturbed forest (Martius et al. 2004). The tress canopy in forests protects the soil biota from various abiotic stress conditions (Dibog et al. 1999). Therefore, deforestation lead towards alteration in soil attributes and biota, which further de- termine the abundance, composition, and activity of decom- posers (Martius et al. 2004), with consequences for ecosys- tem processes mediated by these organisms (Kagezi et al.
2011). The senescence pattern, accumulation, deposition and subsequent decomposition rate, nutrient release also in- fluenced by disturbance regimes (Jordan 1985; Aquiar et al. 2010; Jhariya et al. 2012 & 2014; Jhariya 2017a). The quantification of forest floor biomass, litterfall and its qual- ity are pivotal for defining the change caused by natural or biotic interference (Sizer et al. 2000; Jhariya 2014 &
2017a). These acts as major pathway of energy, materials and nutrients pool in a forest ecosystems.
The precise appraisal of senescence material in addition to its associated process in forest pedon is constitutional to
better understand the nutrient cycling (Proctor et al. 1983).
The maintenance or natural recovery of forest soils is ac- complished through senescence material and its decom- position (Jordan 1985; Dawoe et al. 2010; Tandon et al.
2012; Jhariya 2017a). Understanding the basics of litter production and decomposition processes provides a frame- work for evaluating the dynamics of the forest floor and its relationship to site and soil properties. The major idea be- hind this work, there is significant level of influence of vari- ous disturbances over litterfall, soil nutrient level and bio- mass deposition in forest. Therefore, the aim of the present investigation is to assess the influence of various dis- turbance regimes over the forest floor biomass, litterfall and soil nutrient status under tropical deciduous forest of Chhattisgarh, India.
Materials and Methods
Study site
The Chhattisgarh state in India is well known for its rich natural resources. The state has nearly 44.0% of forest cov- er in his credit. The diverse agro-ecological, edaphic and climatic condition supports rich floral and faunal biodiversity.
The Chhattisgarh being placed in deccan biogeographical area, houses an important part of that rich and unique bio- logical diversity and the state is significantly rich in endem- ism with respect to many plants having diverse utility espe- cially medicinally importance. The present research was carried out in the Bhoramdeo Wildlife Sanctuary, Kawardha occupies a special position in Chhattisgarh. The name of sanctuary was kept in the name of Bhoramdeo temple made-up by King Gopal Dev of Naga dynasty during 11th century. This temple is also known as Khajuraho of Chhattisgarh. The natural forest of Kawardha is well con- nected with the Kanha national park (M.P.) and is one of the important migratory routes of wildlife. The natural for- est of Kawardha is well known for its rich, complex and di- verse flora and fauna (Jhariya 2010 & 2014; Oraon et al.
2014 & 2015). The area is notified as Bhoramdeo wildlife sanctuary by the state forest department in August 2001 un- der the notification no. – F/7/18/FC/ Raipur. The whole forest area is a part of reserve forest (Banjari and Sarodha) and earlier it was under the Kawardha range.
The study site is located between 21°23’-22°00’ North
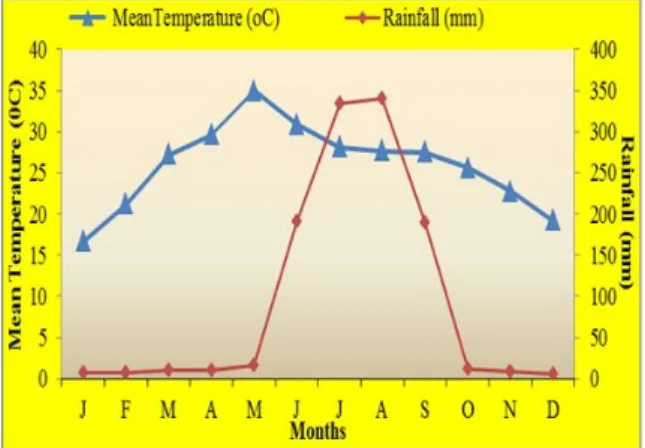
Fig. 1. Ombrothermic diagram for tropical dry deciduous forest based on five year data.
latitude and 80°58’-82°34’ East longitudes. The top- ography is hilly which falls in the Maikal range of the Satpura hills. The altitude ranges from 600-900 m from the sea level and climate is dry tropical with annual average rainfall of 1250-1380 mm. The rainy season commences from about mid June to September. The winter season, which commences from the beginning of December, lasts till the end of February. The summer commences from the beginning of March. It is quite prolonged and severe and lasts till monsoon sets in June. The mean monthly annual temperature ranges from 16.7°C in January to 35.0°C in May and the annual temperature averages 26.0°C (Fig. 1).
Dry deciduous forest, grasslands, agriculture lands and human settlements surround the study area. Most of the villages in study area are categorized as forest villages and majorities of them are accessible through Kaccha roads, which is motorable only in dry season. Road network is ab- sent in hilly tracts, which are inaccessible due to steep slopes and dense forests and wildlife. The forests of the state fall under two major forest types, i.e., Tropical Moist Deciduous forest and the Tropical Dry Deciduous forest.
The Chhattisgarh is endowed with about 22 varied forest sub-types existing in the state. From the management point of view, there are four types of forests in the state of Chhattisgarh. These are teak, sal, miscellaneous and bam- boo forests. Different types of forest vegetation occur in the study area of Kawardha. Northern and eastern directions covered with luxuriant forests, whereas teak plantations mainly occupy in southern direction. The western direction
covered by degraded and mixed forest and also with bam- boo brakes (Champion and Seth 1968).
Experimental design
Three disturbance gradients viz. highly, moderately and lightly disturbed sites were identified after observing the anthropogenic pressures according to the level of dis- turbances i.e., grazing, lopping, collection of fuelwood, fod- der and NTFPs, illicit felling, surface burning, etc. (Kumar and Ram 2005). The study was conducted in three circle comprised of different disturbance regimes in each site after the repeated reconnaissance survey of sanctuary.
Data for forest floor material were collected randomly from 50×50 cm placed quadrat and the forest floor was categorized following Singh (1995). Material on the forest floor was then collected carefully, avoiding contamination with soil as much as possible and categorized into: as (a) Fresh leaf litter (b) Partly decayed litter (c) Wood litter (including reproductive parts also i.e. flower fruits and seeds). The collections were brought to laboratory sepa- rately by category and oven dry weights were determined.
Litterfall was studied for one year and the litter input was measured by randomly placing stone-block lined denuded quadrat technique following Pragasan and Parthsarthy (2005). The litter was collected bimonthly from 50×50 cm quadrats in each site during the study period, separated into leaf and wood. The samples were weighed after oven drying at 60°C to constant weight. The turnover rate (K) of the lit- ter was measured by the method of Jenny et al. (1949). The formula K=A/(A+F) were used for calculation, where A is the annual increment of litter (annual litterfall) and F is the amount of the litter at steady state. Turnover time (t) is the reciprocal of the turnover rate and is expressed as t=
1/K (Jenny et al. 1949).
Soils were sampled randomly from each site using a soil auger. The soil samples were collected from 0-20 cm depth from each site. Soil texture, bulk density and moisture con- tent were determined following Mishra (1968). The pH of each soil sample was determined using a digital pH meter.
Carbon and nitrogen concentration were determined using CHNS auto analyzer, phosphorous by spectrophotometry and potassium by flame photometry (Jackson 1958). Forest floor biomass, litterfall and soil attributes were analysed in one-way analysis of variance. The significant differences
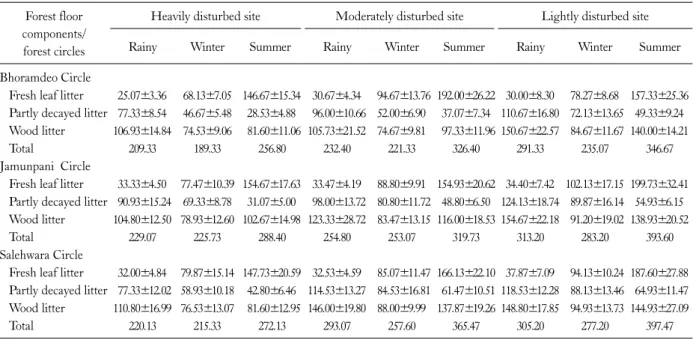
Table 1. Seasonal variation in forest floor biomass (g m-2) on different sites Forest floor
components/
forest circles
Heavily disturbed site Moderately disturbed site Lightly disturbed site
Rainy Winter Summer Rainy Winter Summer Rainy Winter Summer
Bhoramdeo Circle
Fresh leaf litter 25.07±3.36 68.13±7.05 146.67±15.34 30.67±4.34 94.67±13.76 192.00±26.22 30.00±8.30 78.27±8.68 157.33±25.36 Partly decayed litter 77.33±8.54 46.67±5.48 28.53±4.88 96.00±10.66 52.00±6.90 37.07±7.34 110.67±16.80 72.13±13.65 49.33±9.24 Wood litter 106.93±14.84 74.53±9.06 81.60±11.06 105.73±21.52 74.67±9.81 97.33±11.96 150.67±22.57 84.67±11.67 140.00±14.21
Total 209.33 189.33 256.80 232.40 221.33 326.40 291.33 235.07 346.67
Jamunpani Circle
Fresh leaf litter 33.33±4.50 77.47±10.39 154.67±17.63 33.47±4.19 88.80±9.91 154.93±20.62 34.40±7.42 102.13±17.15 199.73±32.41 Partly decayed litter 90.93±15.24 69.33±8.78 31.07±5.00 98.00±13.72 80.80±11.72 48.80±6.50 124.13±18.74 89.87±16.14 54.93±6.15 Wood litter 104.80±12.50 78.93±12.60 102.67±14.98 123.33±28.72 83.47±13.15 116.00±18.53 154.67±22.18 91.20±19.02 138.93±20.52
Total 229.07 225.73 288.40 254.80 253.07 319.73 313.20 283.20 393.60
Salehwara Circle
Fresh leaf litter 32.00±4.84 79.87±15.14 147.73±20.59 32.53±4.59 85.07±11.47 166.13±22.10 37.87±7.09 94.13±10.24 187.60±27.88 Partly decayed litter 77.33±12.02 58.93±10.18 42.80±6.46 114.53±13.27 84.53±16.81 61.47±10.51 118.53±12.28 88.13±13.46 64.93±11.47 Wood litter 110.80±16.99 76.53±13.07 81.60±12.95 146.00±19.80 88.00±9.99 137.87±19.26 148.80±17.85 94.93±13.73 144.93±27.09
Total 220.13 215.33 272.13 293.07 257.60 365.47 305.20 277.20 397.47
between treatment means of all parameters were tested for their significance at 5% or 1% levels following Snedecor and Cochran (1967).
Results
Forest floor biomass
The seasonal standing crop of forest floor biomass of three forest circles of Bhoramdeo wildlife sanctuary viz., Bhoramdeo, Jamunpani and Salehwara along the dis- turbance gradient i.e. heavily disturbed site, moderately disturbed site and lightly disturbed site are given in Table 1.
In Bhoramdeo circle the seasonal mass of fresh leaf litter on heavily disturbed site was 25.07 g m-2 in rainy, 68.13 g m-2 in winter and 146.67 g m-2 in summer season. In mod- erately disturbed site it was 30.67 g m-2, 94.67 g m-2 and 192 g m-2 in rainy, winter and summer season, respectively.
Whereas in lightly disturbed site fresh leaf litter was 30.00 g m-2 in rainy, 78.27 g m-2 in winter and 157.33 g m-2 in summer season. It was highest during summer season on all the three sites. The standing crop of partly decayed litter in different sites varied from 77.33 to 110.67 g m-2, 46.67 to 72.13 g m-2 and 28.53 to 49.33 g m-2 in rainy, winter and summer season, respectively. It was highest in lightly dis- turbed site and lowest in heavily disturbed site in different
season. It was more during rainy and minimum during summer season. The standing crop of wood litter mass on different site varied from 105.73 g m-2 to 150.67 g m-2, 74.53 to 84.67 g m-2 and 81 to 140 g m-2 in rainy, winter and summer seasons, respectively. The wood litter was higher during rainy season followed by summer and winter season.
It was highest in lightly disturbed site and lowest in heavily disturbed site (Table 1).
Jamunpani circle revealed that the seasonal mass of fresh leaf litter on heavily disturbed site was 33.33 g m-2 in rainy, 77.47 g m-2 in winter and 154.67 g m-2 in summer season.
In moderately disturbed site it was 33.47 g m-2 in rainy, 88.80 g m-2 in winter and 154.93 g m-2 in summer seasons.
Whereas in lightly disturbed site fresh leaf litter was 34.40 g m-2 in rainy, 102.13 g m-2 in winter and 199.73 g m-2 in summer season. It was highest during summer season and lowest in rainy season on all the sites. The standing crop of partly decayed litter in different sites varied from 90.93 to 124.13 g, 69.33 to 89.87 g and 31.07 to 54.93 g m-2 in rainy, winter and summer season, respectively. It was highest in lightly disturbed site and lowest in heavily disturbed site in different season. It was maximum during rainy season and minimum during summer season. The seasonal wood litter mass ranged between 78.93-104.80 g, 83.47-123.33 g and 91.20-154.67 g m-2, respectively on heavily, moderately and
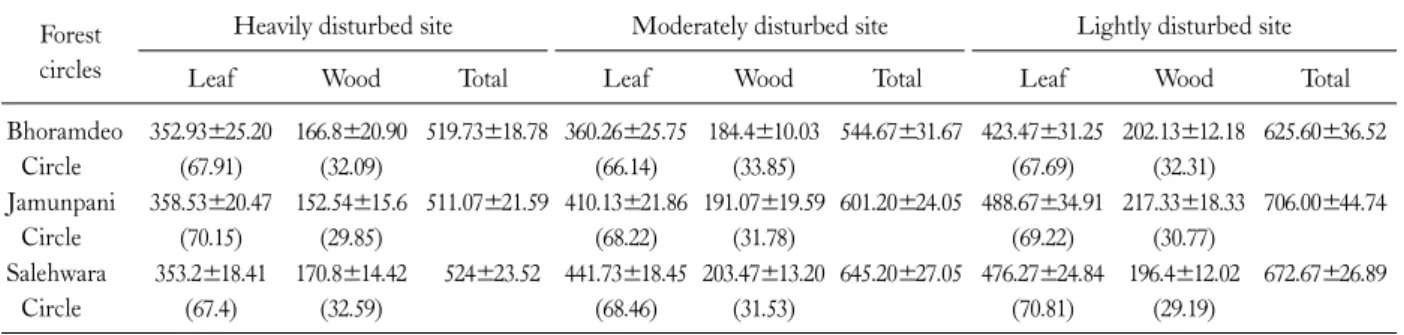
Table 2. Annual litterfall (g m-2) on different sites (values in parenthesis are the percentage of total litterfall) Forest
circles
Heavily disturbed site Moderately disturbed site Lightly disturbed site
Leaf Wood Total Leaf Wood Total Leaf Wood Total
Bhoramdeo Circle
352.93±25.20 (67.91)
166.8±20.90 (32.09)
519.73±18.78 360.26±25.75 (66.14)
184.4±10.03 (33.85)
544.67±31.67 423.47±31.25 (67.69)
202.13±12.18 (32.31)
625.60±36.52 Jamunpani
Circle
358.53±20.47 (70.15)
152.54±15.6 (29.85)
511.07±21.59 410.13±21.86 (68.22)
191.07±19.59 (31.78)
601.20±24.05 488.67±34.91 (69.22)
217.33±18.33 (30.77)
706.00±44.74 Salehwara
Circle
353.2±18.41 (67.4)
170.8±14.42 (32.59)
524±23.52 441.73±18.45 (68.46)
203.47±13.20 (31.53)
645.20±27.05 476.27±24.84 (70.81)
196.4±12.02 (29.19)
672.67±26.89 lightly disturbed site. Maximum seasonal wood litter mass
observed during rainy season and minimum during winter season on all the sites (Table 1).
In the Salehwara the seasonal mass of fresh leaf litter on heavily disturbed site was 32.00 g in rainy, 79.87 g in winter and 147.73 g m-2 in summer season (Table 1). In moder- ately disturbed site it was 32.53 g in rainy, 85.07 g in winter and 166.13 g m-2 in summer season. Whereas in lightly dis- turbed site it was 37.87 g, 94.13 g and 187.60 g m-2 in rainy, winter and summer season, respectively. It was highest dur- ing summer and lowest during rainy season. The standing crop of partly decayed litter in different sites varied from 77.33 to 118.53 g, 58.93 to 88.13 g and 42.80 to 64.93 g m-2 in rainy, winter and summer season, respectively. It was highest on lightly disturbed site and lowest on heavily dis- turbed site in different season. It was found peak during rainy and minimum during summer season. In heavily dis- turbed site the mass of wood litter during rainy, winter and summer seasons was 110.80 g, 76.53 g and 81.60 g m-2, respectively. For moderately disturbed site the highest value was recorded during rainy season (146.00 g m-2), followed by summer (137.87 g m-2) and winter season (88.00 g m-2).
Similarly, in lightly disturbed site the highest value was re- corded during rainy (148.80 g m-2), followed by summer (144.93 g m-2) and winter season (94.93 g m-2). Maximum wood litter was observed during rainy season on all the sites.
Litterfall
The total annual litterfall in Bhoramdeo circle (Table 2) ranged between 519.73 and 625.60 g m-2. The highest leaf litterfall were recorded for lightly disturbed site (423.47 g m-2yr-1) followed by moderately (360.26 g m-2 yr-1) and heavily disturbed site (352.93 g m-2 yr-1). Wood litterfall
followed the order lightly>moderately>heavily disturbed site. The percentage contribution of leaf fall to the total lit- terfall was 67.91, 66.14 and 67.69, respectively, on heavily, moderately and lightly disturbed site. The wood litterfall accounted for 32-34% of the total litterfall. Analysis of var- iance indicated that site to site differences were significant at p<0.05 for total litterfall and leaf litterfall. Wood litter- fall was not significantly different among the sites.
In Jamunpani circle the total annual litterfall for heavily, moderately and lightly disturbed sites were 511.07 g, 601.20 g and 706.00 g m-2yr-1, respectively. The highest leaf litterfall (488.67 g m-2yr-1) values were recorded for lightly disturbed site followed by moderately (410.13 g m-2yr-1) and heavily disturbed site (358.53 g m-2yr-1). Wood litterfall followed the order lightly>moderately>heavily disturbed site. Contribution of leaf fall to the total litterfall was 70.15%, 68.22% and 69.22% respectively, on heavily, moderately and lightly disturbed site. The wood litterfall accounted 29.85% on heavily disturbed site, 31.78% on moderately disturbed site and 30.77% on lightly disturbed site of the total litterfall (Table 2). Analysis of variance in- dicated that site to site differences were significant at p<0.05 for total litter fall and leaf litter fall. Wood litterfall was not significantly different among the sites.
The total annual litterfall in Salehwara (Table 2) varied from 524 g m-2yr-1 to 672.67 g m-2yr-1. The highest leaf lit- terfall was observed on lightly disturbed site followed by moderately and heavily disturbed site i.e., 353.20, 441.73 and 476.27 g m-2yr-1, respectively. The highest wood litter- fall was recorded in moderately disturbed site (203.47 g m-2yr-1) followed by lightly (196.40 g m-2yr-1) and heavily disturbed site (170.80 g m-2yr-1). The percentage con- tribution of leaf fall to the total litterfall was 67.40, 68.46
and 70.81, respectively on heavily, moderately and lightly disturbed site. The wood litterfall accounted for 29.19-32.59% of the total litterfall. Analysis of variance in- dicated that site to site differences were significant at p<0.05 for total litterfall, leaf litterfall and wood litterfall.
Seasonal pattern of litterfall
The seasonal pattern of litterfall is given in Table 3. The seasonal pattern of leaf litterfall on all the three sites of dif- ferent forest circles was found to be at par to each other.
In Bhoramdeo circle, the seasonal pattern of leaf litterfall on all the three sites was similar. The highest value occurred during winter followed by summer and the lowest in rainy season. The maximum seasonal leaf fall, among the sites ranged between 273.2-322.4 g m-2 and minimum 7.6-10.90 g m-2. The summer season ranged between 72.1-90.13 g m-2. The pattern of wood litterfall was similar among the sites and followed the order: summer > winter > rainy.
The wood litterfall ranged between 54-61.9 g m-2 in winter, 66.2-82 g m-2 in summer and 46.5-58.3 g m-2 in rainy season.
The seasonal pattern of leaf litterfall on heavily disturbed site of Jamunpani circle was 262.8 g m-2 in winter, 88.9 g m-2 in summer and 6.8 g m-2 in rainy season. On moder- ately disturbed site it was 293.0 g m-2 in winter, 111.0 g m-2 in summer and 6.8 g m-2 in rainy season. Whereas, in light- ly disturbed site leaf litter was 363.0 g m-2 in winter, 120.7 g m-2 in summer and 4.53 g m-2 in rainy season. The pattern of wood litter in different sites varied from 48.5 to 72.5 g m-2, 58.9 to 79.5 g m-2 and 45.1 to 65.3 g m-2 in winter, summer and rainy season, respectively. The highest value occurred during summer followed by winter and the lowest in rainy season.
The seasonal pattern of leaf litterfall on all the three sites of Salehwara circle was similar. The highest value occurred during winter followed by summer and lowest in rainy season. The seasonal leaf fall on heavily disturbed site was 212.7 g m-2 in winter, 130 g m-2 in summer and 10.7 g m-2 in rainy season. In moderately disturbed site it was 269 g m-2 in winter, 165 g m-2 in summer and 8.3 g m-2 in rainy seasons. Whereas, in lightly disturbed site leaf litterfall was 319 g m-2, 146.5 g m-2 and 10.4 g m-2 in winter, summer and rainy season, respectively. The pattern of wood litter in
different sites varied from 51.1 to 62.9 g m-2, 71.5 to 74.5 g Table 3
. Seasonal pattern of litterfall (g m-2 ) on different sites Heavily disturbed siteModerately disturbed siteLightly disturbed site WinterSummerRainyWinterSummerRainyWinterSummerRainy Forest CirclesLeafWoodLeafWoodLeafWoodLeafWoodLeafWoodLeafWoodLeafWoodLeafWoodLeafWood Bhoramdeo Circle273.2± 15.62 54±9.2272.1±6.2466.2±8.40 7.6±1.7546.5±4.96269±24.1556.3±6.6282.7±6.6077.2±9.698.5±1.3750.9±9.31322.4±4.2161.9±5.3690.13±7.0982±7.5210.9±2.6858.3±5.42 Jamunpani Circle262.8±12.2548.5±4.7688.9±12.0958.9±9.20 6.8±1.0545.1±4.42293±36.1961.7±8.20 111±17.8474.4±5.616.8± 0.7058.9±10.66 363±6.7372.5±13.33120.7±36.6679.5±4.044.53±0.7065.3±11.26 Salehwara Circle212.7±11.1251.1±9.48130±5.1071.5±3.5810.7±2.2748.3±4.27269±15.3764.4±3.81 165±10.5677.7±7.288.3±1.1961.7±4.40 319±15.7362.9±9.98146.5±12.9474.5±5.0610.4±1.2858.9±6.24
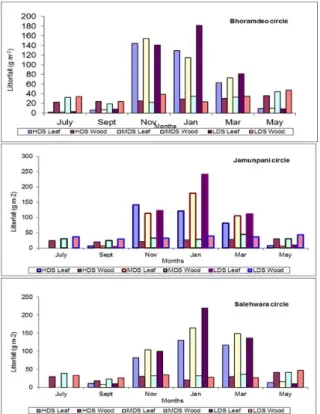
Fig. 2. Bimonthly pattern of litterfall under different disturbance regimes.
m-2 and 48.3 to 58.9 g m-2 in winter, summer and rainy sea- son, respectively.
Temporal Pattern of litterfall
In Bhoramdeo circle bimonthly leaf litterfall were ranged between 1.47 and 144.0 g m-2 on heavily disturbed site (Fig. 2). The minimum leaf litterfall recorded in the month of July, while peak was observed in the month of November.
The leaf shedding was concentrated between November to March and not occurred or negligible during June to July.
Wood litter consisted of twigs, branches, bark, fruits and seeds. The fall of wood litter among different months ranged between 22.40-36.13 g m-2. The wood litter shed- ding was recorded throughout the year with irregular pattern. The peak total litterfall (leaf + wood) occurred in November and bimonthly values ranged between 23.87-169.20 g m-2. On moderately disturbed site the pat- tern of litterfall deposition was more or less similar to that on heavily disturbed site. The peak leaf litterfall occurred in November. The bimonthly leaf fall ranged between 1.60 and 154.40 g m-2. The wood fall among different months
ranged between 18.93 and 44.13 g m-2. The wood fall pat- tern was irregular throughout the year however; there was a peak in May. The total litterfall ranged between 25.86 and 176.12 g m-2 and was highest in the month of November and lowest in September. In lightly disturbed site the pat- tern of litter fall shedding was broadly similar to the pattern on heavily and moderately disturbed site. The peak leaf fall occurred in January. The bimonthly leaf fall ranged be- tween 3.07 and 181.73 g m-2. The fall of wood litter among different months ranged between 23.33 and 47.33 g m-2. The pattern of wood litterfall was irregular. The total litter- fall ranged between 32.00 and 205.06 g m-2 and was highest in the month of January and lowest in September. Analysis of variance indicated that the difference in the quantity of litterfall due to months and category (leaf, wood) were sig- nificant at p<0.05.
In Jamunpani circle the temporal pattern of litterfall in heavily disturbed site the leaf litterfall ranged between 0 to 140.93 g m-2 (Fig. 2). The minimum leaf litterfall recorded in the month of July, while it was more in the month of November. The leaf shedding was concentrated between November to March and not occurred or negligible during June to July. The leaf fall was completed by the month of May. The fall of wood litter among different months ranged between 20.27 and 30.40 g m-2. The wood litterfall shedding was recorded throughout the year with irregular pattern. The peak total litterfall (leaf + wood) occurred in November and bimonthly values ranged between 24.80-162.53 g m-2. In moderately disturbed site the pat- tern of litterfall deposition was more or less similar to that on heavily disturbed site. The peak leaf litterfall occurred in January. The bimonthly leaf fall ranged between 0-179.07 g m-2. The wood fall among different months ranged between 24.27-44.27 g m-2. The wood fall pattern was irregular though there was a peak in March. The total litterfall ranged between 30.67 and 207.87 g m-2 and was highest in the month of January and lowest in the July. In lightly dis- turbed site the pattern of litterfall shedding was broadly similar to the pattern on heavily and moderately disturbed site. The peak leaf fall occurred in January. The bimonthly leaf fall ranged between 0 and 241.20 g m-2. The fall of wood litter among different months ranged between 29.20- 43.33 g m-2. The pattern of wood litter was irregular. The total litterfall ranged between 36.13 to 281.07 g m-2 and was
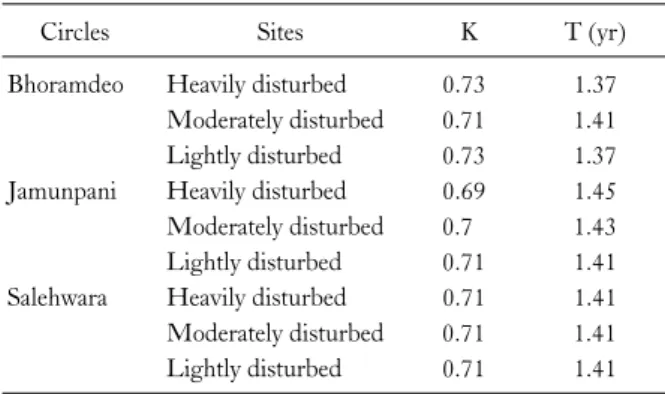
Table 4. Turnover rate (K) and turnover time (t) of litter on the for- est floor
Circles Sites K T (yr)
Bhoramdeo Heavily disturbed 0.73 1.37
Moderately disturbed 0.71 1.41
Lightly disturbed 0.73 1.37
Jamunpani Heavily disturbed 0.69 1.45
Moderately disturbed 0.7 1.43
Lightly disturbed 0.71 1.41
Salehwara Heavily disturbed 0.71 1.41
Moderately disturbed 0.71 1.41
Lightly disturbed 0.71 1.41
highest in the month of January and lowest in September.
The litterfall data were analysed through analysis of variance. The difference in the quantity of litterfall due to months and category were significant at p<0.05 in leaf lit- ter but not significant in wood litter.
Salehwara circle revealed that in heavily disturbed site the bimonthly leaf litterfall were ranged between 0 and 130.27 g m-2 (Fig. 2). The minimum leaf litterfall recorded in the month of July, while peak was observed in the month of January. The leaf fall was completed by the month of May. The wood litter fall among different months ranged between 18.53 and 41.87 g m-2. The wood litter shedding was recorded throughout the year with irregular pattern.
The peak total litterfall (leaf + wood) occurred in January and bimonthly values ranged between 29.73-150.67 g m-2. In moderately disturbed site the pattern of litterfall deposi- tion was more or less similar to that on heavily disturbed site. The peak leaf litterfall occurred in January. The bi- monthly leaf fall ranged between 0 and 164.53 g m-2. The wood litter among different months ranged between 22.53 and 41.47 g m-2. The wood litter fall pattern was irregular though there was a peak in May. The total litterfall ranged between 30.80-196.40 g m-2 and was highest in the month of January and lowest in September. In lightly disturbed site the peak leaf fall occurred in the month of January and minimum in the month of July. The bimonthly leaf fall ranged between 0 and 219.07 g m-2. The wood litter fall among different months ranged between 26.00 and 47.60 g m-2. The pattern of wood litterfall was irregular. The total litterfall ranged between 32.93-247.20 g m-2 and was highest in the month of January and lowest in July. Analysis of variance indicated that difference in the quantity of litterfall due to months and category (leaf, wood) were significant at p<0.05.
Turnover of litter
The values for turnover rate and turnover time for the litter on each site are given in Table 4. The turnover rate on these sites ranged between 0.69-0.73 indicating about 69-73% turnover of the litter each year. The turnover time of the litter on these sites ranged between 1.37-1.45.
Physico-chemical properties of soil
The physico-chemical properties of soil in different cir- cle i.e. Bhoramdeo Jamunpani and Salehwara circle is given
in Table 5.
In Bhoramdeo circle, heavily, moderately and lightly dis- turbed sites are characterized by sandy loam texture. The soil of heavily disturbed site contained 54.0% sand, 32.67%
silt, and 13.33% clay and in moderately disturbed site 52.67% sand, 32.67% silt and 14.67% clay particles, where- as lightly disturbed site contained 52.0% sand, 34.0% silt and 14.0% clay. The bulk density was 1.34, 1.33 and 1.31 g cm-3, respectively on heavily, moderately and lightly dis- turbed site. The soil pH under heavily disturbed site, mod- erately disturbed site and lightly disturbed site was 5.57, 5.63 and 6.52 respectively. The moisture percent showed maximum (6.52%) in lightly disturbed site and minimum (4.04%) in heavily disturbed site in the month of April.
Total soil nitrogen estimated for different sites ranged from 0.12-0.19%. Among the sites lightly disturbed site con- tained maximum nitrogen as compared to the other sites.
The concentration of phosphorus under heavily, moderately and lightly disturbed site was 11.03, 14.90 and 16.85 kg ha-1, respectively. Available potassium was 142.19, 154.14 and 252.51 kg ha-1 under heavily, moderately and lightly disturbed site, respectively. The organic carbon content in the soil of heavily disturbed site was 1.83%, which revealed lower percent of organic carbon as compare to other site.
Soil C under moderately disturbed site and lightly dis- turbed site was 1.91% and 2.62% respectively.
The soil texture in the entire three sites was sandy loam to clayey soil. The soil of heavily disturbed site contained 48.67% sand, 34.0% silt and 17.33% clay. Soil under mod- erately disturbed site comprised of 48.0% sand, 26.67% silt
Table 5. Physico-chemical properties of soil of Bhoramdeo Wildlife Sanctuary
Forest Circle Properties Heavily disturbed site Moderately disturbed site Lightly disturbed site Bhoramdeo circle
Mechanical composition Sand (%) 54.00 52.67 52.00
Silt (%) 32.67 32.67 34.00
Clay (%) 13.33 14.67 14.00
Bulk density (gm-3) 0-20 (cm) 1.34 1.33 1.31
Soil moisture (%) 0-20 (cm) 4.04 5.36 6.52
Chemical properties pH 5.57 5.63 6.51
Total (N%) 0.12 0.14 0.19
P kg (ha-1) 11.03 14.90 16.85
K kg (ha-1) 142.19 154.14 252.51
Organic carbon (%) 1.38 1.91 2.62
Jamunpani circle Heavily disturbed site Moderately disturbed site Lightly disturbed site
Mechanical composition Sand (%) 48.67 48.00 40.00
Silt (%) 34.00 26.67 20.67
Clay (%) 17.33 25.33 39.33
Bulk density (gm-3) 0-20 (cm) 1.22 1.20 1.18
Soil moisture (%) 0-20 (Cm) 4.66 5.86 7.38
Chemical properties pH 5.78 6.04 6.15
Total (N%) 0.12 0.17 0.21
P kg (ha-1) 12.96 20.1 24.00
K kg (ha-1) 294.25 390.66 448.35
Organic carbon (%) 1.73 2.43 2.56
Salehwara circle Heavily disturbed site Moderately disturbed site Lightly disturbed site
Mechanical composition Sand (%) 48.00 46.00 48.67
Silt (%) 33.33 20.00 17.33
Clay (%) 18.67 34.00 34.00
Bulk density (gm-3) 0-20 (cm) 1.38 1.15 1.11
Soil moisture (%) 0-20 (cm) 4.73 5.96 7.04
Chemical properties pH 5.75 6.23 6.89
Total (N%) 0.13 0.14 0.18
P kg (ha-1) 19.96 19.31 21.78
K kg(ha-1) 139.88 150.65 238.24
Organic carbon (%) 1.85 1.87 2.70
and 25.33% clay. The soil of lightly disturbed site contained 40.0% sand, 20.67% silt and 39.33% clay. The bulk density was 1.22 g cm-3 in heavily disturbed site, 1.20 g cm-3 in moderately disturbed site and 1.18 g cm-3 in lightly dis- turbed site. Maximum (7.38%) soil moisture percent was observed in lightly disturbed site and minimum (4.66%) in heavily disturbed site. The pH value of soil under heavily, moderately and lightly disturbed site was recorded 5.78, 6.04 and 6.15, respectively. Total soil nitrogen observed un- der soil of different sites ranged from 0.12% to 0.21%. It was highest in lightly disturbed site and lowest in heavily
disturbed site. Available phosphorus for the soil of heavily disturbed site was 12.69 kg ha-1, for moderately disturbed site 20.10 kg ha-1 and for lightly disturbed site 24.0 kg ha-1, respectively. The result of available poassium varied be- tween 294.25-448.35 kg ha-1. In the study sites potassium content was low in heavily disturbed site while it was higher under the soil of lightly disturbed site. Organic carbon for the heavily, moderately and lightly disturbed site was 1.73%, 2.43% and 2.56%, respectively.
The soil texture in the three sites comprised of sandy loam to sandy clay loam. The soil of heavily disturbed site
contained 48.0% sand, 33.33% silt and 18.67% clay. Soil under moderately disturbed site comprised of 46.0% sand, 20.0% silt and 34.0% clay, whereas the soil of lightly dis- turbed site contained 48.67% sand, 17.33% silt and 34.0%
clay. Bulk density ranged between 1.11-1.38 g cm-3, being more on heavily disturbed site and minimum on lightly dis- turbed site. Soil moisture percent ranged from 4.73-7.04%.
It was highest in lightly disturbed site and lowest in heavily disturbed site. The soil pH under heavily disturbed site, moderately disturbed site and lightly disturbed site was 5.75, 6.23 and 6.89, respectively. Total soil nitrogen ranged from 0.13-0.18% with the maximum on lightly disturbed site and minimum on heavily disturbed site. Available phos- phorus for the soil of heavily disturbed site was 19.96 kg ha-1 for moderately disturbed site was 19.31 kg ha-1 and for lightly disturbed site was 21.78 kg ha-1. Available potassium was 139.88 kg ha-1, 150.65 kg ha-1 and 238.24 kg ha-1 un- der heavily disturbed site, moderately disturbed site and lightly disturbed site, respectively. Soil organic carbon con- tents for the heavily, moderately and lightly disturbed site was 1.85%, 1.87% and 2.70%, respectively.
Discussion
It reflected in the sanctuary area and its proximity the farming by the tribals is at subsistence level and depend- ency of forest villagers on forest based resources are sub- stantial in the entire circle. It also experienced that human settlement was mostly dependent on more or less similar types of resources in the three circles. The key source of en- ergy in addition to most used resources in three studied cir- cles is fuelwood which collected from forest year round, though the collection intensity is least during rainy period.
Besides this, animal grazing is additional heavy pressures which mostly alter ground vegetation along with tree spe- cies in the sanctuary area. Timber was also another crucial material needed for construction work. Collection of non-timber forest products, medicinal plants and other mi- nor forest produces of high economic values by villagers is the regular process in the sanctuary. Traditionally it ex- tracted through lopping or chopping or by uprooting the whole plant and sometimes picking out. Intentional fire also applied to facilitate collection of various forest products (Jhariya 2010, 2014, 2017a,b).
The forest floor biomass, litterfall and soil properties of a stand interrelated with each other. The higher senescence of litter gradually builds up the organic matter and increase the soil health and quality. The disturbances of any kind in natural ecosystem may alter the various process and func- tion in a great extent. The quality of stand can be judge through vegetation dynamics, forest floor biomass, litter production and associated soil dynamics.
Forest floor biomass
Forest floor biomass is a chief source of nutrient cycling in forest ecosystem (Sundarapandian and Swamy 1999).
Nutrient cycling rates in forests are usually inferred from a comparison of nutrient concentrations and amounts in for- est floor material, litterfall and stem flow (Vitousek and Sanford 1986; Proctor 1987). However, due to biotic inter- ferences which resulted alteration in stand, canopy archi- tecture, species admixture, forest floor and litterfall, and its subsequent decomposition and nutrients release showed spatial variation considerably in addition to spatial hetero- geneity which contributes to niche differentiation (Burghouts et al. 1998).
In the present investigation the lowest value of standing crop on heavily disturbed site was occurred which may be due to least population dynamics of vegetation as compared to least disturbed site. The highest mass of forest floor bio- mass was recorded during summer and least during winter season due to wide variation in the decomposition rate in said period. Similar findings were also reported by Jhariya (2017a). He reported that the littermass was occurred to be peak during summer followed by winter and least in rainy season in different sites. The standing litter material and its seasonality in tropics regulated or altered by various seg- ments of environment and ecological attributes and process (Jhariya 2014, 2017a). In monsoonal climatic region the partitioning and breakdown rate of litter down lowered con- siderably during the summer spell (Swift et al. 1981;
Jhariya 2017a). The present finding were well comparable with Madge (1965), who has reported litter accumulation ranged from 1.7-14.7 t ha-1 in tropical zone while it was 3.6-39.9 t ha-1 in temperate zone. In the present forest it re- flected that disturbances caused reduction of forest floor mass as compared to no or least disturbed sites, which were found in the line agreement, stated by Simard et al. (2001)
and Sun et al. (2011). The higher value of forest floor bio- mass (2.07-54.0 t ha-1) for tropics were reported by Vogt et al. (1986), while the present estimated value were found to be within the range of various earlier reports (Singh 1995;
Swamy et al. 2010). Hopkins (1966) reported yearly ranges of 50-480 g m-2 and 180-550 g m-2, respectively, for dry and moist Nigerian forests. Bernhard (1970) revealed strong seasonal variation in Ivory Coast forests and found that standing crop of litter ranged from less than 100 g to more than 350 g m-2. In the present study seasonal crop of litter (fresh + partly decayed + woody litter) ranged between 189.33 and 397.47 g m-2 which were found to be well in the range of 169.92-394.82 g m-2 and 246-335 g m-2, re- spectively reported by Jhariya (2017a) and Singh (1995).
Litterfall
Litterfall is the major pathway for the return of organic matter and nutrients to the soil (Rajendraprasad et al. 2000;
Odiwe and Muoghalu 2003). The vegetation types, its composition and site conditions alter the litter input rates in forest ecosystem (Polyakova and Billor 2007; Jhariya 2017a). Various reports are available on strong seasonality of total litterfall pattern in forest ecosystem (Liu et al. 2012;
Jhariya 2017a). Liu et al. (2012) reported the peak flux of litterfall observed in the month of September and least in- put occurred during dry spell. Furthermore, they reported that total annual litterfall were 713, 614 and 617 g m-2 yr-1 in the old growth forest, mixed forest and pine forest, respectively. Rawat (2012) reported the total annual litter- fall across the sites ranged between 5.12-7.47 t ha-1. The mean value of litterfall was found to be highest during summer season followed by rainy and winter season.
The present estimated values of litterfall are within the range reported by Raikwal (2008) and Singh (2009), for the central Himalayan forests of India (5.8-7.7 t ha-1 and 1.3-6.2 t ha-1, respectively). Such pattern of litterfall peak during summer may be due to dry and warm conditions prevailing during the summer period. The seasonal litter fall pattern was mainly controlled by community character- istics and environmental factors (Kavvadias et al. 2001).
Such a pattern with peak leaffall in summer has also been observed for other central Himalayan forest (Raikwal 2008; Singh 2009). Zhou et al. (2006) reported 3.56-10.56 t ha-1 yr-1 litterfall production in subtropical forest of China.
Kumar et al. (2011) measured 2.97-4.61 t ha-1 yr-1 litterfall in three different aged Butea forest ecosystems in western Rajasthan in India. Singh and Singh (1991) reported the values of annual litterfall ranged from 4.88-6.71 t ha-1 for tropical deciduous forest of India which found to be com- parable with the present estimated values of litterfall. The present findings were supported by various earlier reports available for the tropical forests (Murphy and Lugo 1986;
Clark et al. 2001; Singh 2004; Glumphabuter and Kaitpraneet 2007; Swamy et al. 2010; Jhariya 2017a).
Dantas and Phillipson (1989) have reported 5.04-8.04 t ha-1 yr-1 litterfall for different forest types of Amazon.
Proctor (1983) reported very wide ranges of litterfall for tropical forest of Africa (3.1-15.3 t ha-1), South America (4.8-21.9 t ha-1), Central America (1.7-27 t ha-1), India and Sri Lanka (1.5-7.8 t ha-1), and South east Asia (2.8-23.3 t ha-1) which are well within the range of present findings.
The present estimated finding of litterfall were found to be lesser as reported by Sanches et al. (2008), Odiwe and Muoghalu (2003) and Singh et al. (2011) for tropical semi deciduous forest of Brazil, Nigerian rainforest and re- habilitated sub-tropical forest of India (8-10.5 t ha-1yr-1, 9.9-12.5 t ha-1yr-1 and 8.21-8.81 t ha-1yr-1, respectively).
The leaf litterfall in the present study accounted for 66-71% of the total annual litterfall. Similar to this very closer range like 69-86% by Brown and Lugo (1982), 70%
by Meentemeyer et al. (1982), 65-72% by Singh (2004) were reported for different forests types. Pragasan and Parthasarthy (2005) estimated the contribution of leaf litter varied from 67.9-71.4% to total litter production. Sanches et al. (2008) estimated the leaf fall between 65-83% in trop- ical forest of Brazil. Glumphabuter and Kaitpraneet (2007) reported 58-67% leaf litterfall of the total litterfall in natural evergreen forest of Thailand. Zhou et al. (2006) found 56-76% leaf litterfall in subtropical forest of China. Odiwe and Muoghalu (2003) observed 64-68% leaf litterfall of the total litterfall in secondary lowland rainforest in Nigeria.
Martinez-Yrizar and SaruKhan (1990) have measured 69-73% leaf fall in tropical deciduous forest on the pacific cost of Mexico. Kumar et al. (2011) found 71-80% leaf lit- terfall to the total litterfall in an age series of Butea forest ecosystems in India. Singh et al. (2011) reported that leaf litterfall contributed nearly 68% to total litterfall in a re- habilitated subtropical forest in north India.
The average annual wood litterfall across the circle was between 1.63-2.05 t ha-1 yr-1. The contribution of wood lit- terfall in the present study was 29.19-33.85%. Singh and Singh (1991) measured 28-35% wood litterfall of total lit- terfall in India which found to be comparable with present findings. These values were closer to the value of reported by Bray and Gorham (1964), Martinez-Yrizar and SaruKhan (1990), and Odiwe and Muoghalu (2003) for share of wood litterfall to total litterfall (33%, 30% and 26.7-31.2%, respectively for tropical forest, rainforest and tropical deciduous forest). The lower values for wood litter i.e., 12-16% and 19-25%, respectively have been reported by Zhou et al. (2006) and Gaur and Pandey (1978).
Brown and Lugo (1982) have given predictive statement for litter production and T/P ratio i.e., Y=16.0+16.7 logx-6.5x (where Y represent total litterfall and x represent T/P, T and P depicted respectively mean annual temper- ature and total rainfall). Using this model the expected total litterfall for the present forest type (T/P = 2.30) is about 7.10 t ha-1 yr-1, whereas the actual litterfall (5.94 t ha-1 yr-1) is 0.84 times of the predictive value. Using this equation Jhariya (2017a) found the reverse pattern between expected total litterfall and actual litterfall for the same forest types as compared to present findings.
Turnover of litter
The litter biomass is needed to quantify the annual re- turn of elements and organic matter to the soil. Tiwari and Joshi (2013) reported the turnover rate values between 0.61-0.74 and turnover time from 1.35-1.64. Similarly Jhariya (2017a) reported very close values of turnover rate between 0.70-0.74 and turnover time of the litter between 1.35-1.43 which are comparable with the present estimated values. In the present study the value of turnover rate (K) lie within the range of values given by Olsen (1963) for tropical forests. Lugo et al. (1978) reported annual turn- over rate of 0.34 for subtropical dry forest of Puerto Rico.
Singh and Singh (1991) reported annual turnover rate ranged from 0.72-0.77 while the turnover time varied from 1.30-1.39 for tropics which supports the present findings.
Brown and Lugo (1982) reported shorter turnover times in the tropical zone (0.57-0.88 yr) as compared to the sub-tropical zone (0.70-1.86 yr).
Physico-chemical properties of soil
The account of nutrient status of soils of different forests varied greatly. The differences in the total nutrient contents are due to the disturbances which regulate the nutrient con- centration and soil health, etc. The climatic conditions un- der which the soil develop and other factors including pa- rent material have a substantial effect on the nutrient con- tent of the soil and on the other soil physico-chemical properties. The findings of the present investigation were found to be consistence with values reported by Barbhuiya et al. (2012). They reported that in the highly and moder- ately disturbed site soil texture was sandy loam and in the undisturbed site was sandy clay loam, and soil pH ranged from 5.09-6.12 across the three disturbed site.
Organic carbon is altered by vegetation, climate, pedon and other attributes (Brady 1984). Furthermore, temper- ature and precipitation also exert considerable impact on the magnitude of soil organic matter and organic C (Jenny 1941). Coleman and Elliott (1988) reported soil function is outcome of complex combination of physical, chemical and biological processes which regulated through complex envi- ronmental functions. The soil organic matter contributes to the soil fertility in a number of ways which includes incre- ment in ion exchange (Johnston 1986), water holding (Salter and Williams 1969) and nutrients availability (Schnitzer and Khan 1978). Both quantity and quality of organic matter interact with soil microclimate and thus in- fluence biogeochemical cycling particularly in relatively dry ecosystem and its functioning (Burke 1989).
The soil quality and health in terms of nutrient status is dependent upon the pedon materials, litter quantity and quality which transfer and regulates the nutrients to the for- est soils (Dawoe et al. 2010; Tandon et al. 2012; Jhariya 2014). Disturbances may affects the rate of organic matter accumulation and subsequently pattern of nutrient cycling due to alteration in litter production, decomposition and other ecological processes (Sizer et al. 2000; Xuluc-Tolosa et al. 2003; Dezzeo et al. 2004; Yadav et al. 2008; Aquiar et al. 2010). Quantification of litterfall is pivotal for under- standing nutrient cycling, growth, succession, bio-geo- logical properties of top soil and interactions with environ- mental segments in vegetation stand (Zhou et al. 2007).
The uppermost (0-20 cm) pedon in general is rich in mi-
crobial activity in addition to nutrient content and organic C. The present findings found to be consistent with re- search reports of Janmahasatien and Phopinit (2001).
Singh et al. (2000) reported that temporal variation and in- creased in soil organic C coincided with the amount of lit- terfall and forest floor biomass. The deforestation in present enhanced and rendering the forest stand vulnerable to nu- trients leakage. The soil nutrient dynamics are intimately associated with seasonal variability of temperature, rainfall and moisture regimes (Burke 1989; Takahashi et al. 2009).
Furthermore, the higher nutrients concentration in forest stands due to organic matter return through litter addition.
The topographic position had direct effect on pH, concen- tration of total C, total N and extractable P (Paul et al.
2003). Sahu et al. (2013) observed the total soil N in differ- ent site ranged from 0.083-0.143% for surface soil (0-10 cm) and 0.064-0.091% for lower layer soil (10-20 cm) while total C ranged from 1.124-1.736% for surface soil and 0.703-1.312% for lower soil. The concentration of available phosphorus (0-20 cm) was 8.55-15.72 kg ha-1 across the sites and the available potassium were varied from 249.54-382.21 kg ha-1.
Rawat (2012) reported that soil bulk density (g cm-3) varied from 0.97-1.42, soil carbon from 1-2.97%, soil mois- ture annual range from 6.52-29.72%, N 0.09-0.42%, P 0.0001-0.0018, K 0.0026- 0.0108. The soil carbon percent- age in top 20 cm soil depth is 50% of that in the first meter which are more important from nutrients point of view (Jobbagy and Jáckson 2000). Generally the surface layer soil is more affected by climate, litter type, while clay con- tent seems to control deep soil carbon. However, in the top layers soil organic carbon was higher and declined with depths. Kumar et al. (2010) reported organic carbon ranged between 2.23-2.81%, while N concentration from 0.16-0.21% and P from 0.021-0.03% in different sites, which were found to be corresponding with present findings. Tangsinmankong et al. (2007) revealed that soil organic carbon decreased generally with the increasing depth from the surface soil to the downward soil column.
Similar observations were measured in the present investigation. The present findings on soil properties were comparable with Chauhan et al. (2010), reported the soil organic carbon ranged from 1.5-2.2%, whereas the avail- able phosphorus varied from 8.4-10.7 kg ha-1 in natural and
plantation stand. Moreover the value of N was found be- tween 170-209.2 kg ha-1, whereas the available K ranged from 294.5-331 kg ha-1.
Pawar et al. (2014) reported that the highest soil N (0.081%), C (1.638%) concentration and K (369.03 kg ha-1) content were recorded for surface soil samples (0-10 cm), whereas soil P content (35.57 kg ha-1) for deep soil samples (10-20 cm). Soil pH was lower down upto 5.34 in high disturbed area for surface soil. The lower soil bulk density (1.273 Mg/m3) was observed for deep soil under highly disturbed sites. Sand, silt and clay content were non-significantly affected by soil depths. However, the highest silt (11.27%) and clay (19.13%) content were re- corded for deep soil samples at moderately disturbed and highest sand (80.13%) content for surface soil samples at least disturbed sites. The regular removal of litter reduced the level of organic matter and nutrient status in soil. The confirmative findings were also reported by Sapkota et al.
(2009) for sal dominated forest. Biotic disturbances pose significant impact on soil quality and make the sites poor in nutrient and reduced soil fertility status (Khurana 2007).
Conclusion
Forest floor biomass and litterfall is the key source of or- ganic matter and nutrients. Leaf litter makes the group rich and provides diversity in the ecosystem. The more leaves on the ground the more rich and diverse the ecosystem. The litter biomass and their decomposition is an important proc- ess for soil improvement. Disturbances can affect both in- puts and losses of forest floor and litterfall pools. Organic matters in forest soils are important as reservoirs of stored C, as intermediate pools that transfer fluxes. The forest floor and litterfall is not only a C storage pool but also a cen- tral, functional aspect of forest ecosystems. In the forest ecosystem forest floor and litterfall are the major source of nutrients and organic material. Among the different dis- turbance regimes highly disturbed site face much of the deleterious impact on litter biomass, its production and soil physico-chemical properties. Moreover, it revealed that bi- otic interference had substantial effect on the mass of forest floor and litterfall then the least disturbed site. Our experi- ment showed marked differences in temporal variability of litter production and in total litter fall throughout the study