Vol. 29, No. 2, pp. 131-137, May, 2013 http://dx.doi.org/10.7747/JFS.2013.29.2.131
Classifying Forest Species Using Hyperspectral Data in Balah Forest Reserve, Kelantan,
Peninsular Malaysia
Ruhasmizan Mat Zain, Mohd Hasmadi Ismail* and Pakhriazad Hassan Zaki
Department of Forest Production, Faculty of Forestry, Universiti Putra Malaysia, 43400 Serdang, Selangor, Malaysia
Abstract
This study attempts to classify forest species using hyperspectral data for supporting resources management. The primary dataset used was AISA sensor. The sensor was mounted onboard the NOMAD GAF-27 aircraft at 2,000 m altitude creating a 2 m spatial resolution on the ground. Pre-processing was carried out with CALIGEO software, which automatically corrects for both geometric and radiometric distortions of the raw image data. The radiance data set was then converted to at-sensor reflectance derived from the FODIS sensor. Spectral Angle Mapper (SAM) technique was used for image classification. The spectra libraries for tree species were established after confirming the appropriate match between field spectra and pixel spectra. Results showed that the highest spectral signature in NIR range were Kembang Semangkok (Scaphium macropodum), followed by Meranti Sarang Punai (Shorea parvifolia) and Chengal (Neobalanocarpus hemii).
Meanwhile, the lowest spectral response were Kasai (Pometia pinnata), Kelat (Eugenia spp.) and Merawan (Hopea beccariana), respectively. The overall accuracy obtained was 79%. Although the accuracy of SAM techniques is below the expectation level, SAM classifier was able to classify tropical tree species. In future it is believe that the most effective way of ground data collection is to use the ground object that has the strongest response to sensor for more significant tree signatures.
Key Words: Classify tree species, hyperspectral, Spectral Angle Mapper, spectral signature, tropical forest, accuracy assessment
Received: August 3, 2012. Revised: September 19, 2012. Accepted: September 20, 2012.
Corresponding author: Mohd Hasmadi Ismail
Department of Forest Production, Faculty of Forestry, Universiti Putra Malaysia, 43400 Serdang, Selangor, Malaysia Tel: 603-89467220, Fax: 603-89432514, E-mail: [email protected]
Introduction
The concept of sustainability comes from the concept of sustained yield forestry (Pearce et al. 2003). Sayer et al.
(2007) stated that the sustainable forest management is a balance between the forest products and services, and the preservation of forest health and diversity. In Malaysia and other developing countries access to the forest areas are of- ten lacking and vital forest information are often inadequate. Mohd Hasmadi et al. (2009) stated that collec- tion of information and ground measurement are difficult due to terrain condition and ground measurements are ex-
pensive due to poor infrastructure and labour cost is quiet high. For many years remote sensing technology offers quick data capture for forest resources management, plan- ning and development, a task which is be difficult and time consuming using traditional ground surveys.
Satellite remote sensing has proved effective for the pur- pose of mapping land cover types, using either classification of multispectral data at a single point in time for relatively small areas at fine spatial resolution or multitemporal data for large areas at a relatively coarse spatial resolution (Woodcock et al. 1994). The trend in the development of remote sensing in forestry has been increase from the pan-
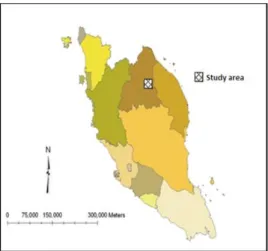
Fig. 1. A map of Peninsular Malaysia showing the location of study area.
Fig. 2. A raw data of hyperspectral data used in this study: band 28-15-2 (R-G-B).
chromatic multispectral to the hyperspectral sensing technology. Forest resources information in Peninsular Malaysia is conducted by the forestry department, where the classification of forest area was based on established cri- teria of forest stratification and supported by ground in- formation of sample locations from global positioning sys- tem (GPS). This system is helping much for capturing for- est information and contributes towards better sustainable forest management at macro level. In micro level monitor- ing and mapping forest resources is critical for successful resource management. In this level the task not only identi- fying and quantifying the amount of resources, but also de- tails classification of forest species by using high resolution of satellite and airborne data.
Traditional remote sensing practice only classify forest in broader type but hyperspectral much detail to individual tree species. This is because hyperspectral remote sensing’s sensor record the large part of the electromagnetic spec- trum simultaneously in a large number of a small bands, providing us a contiguous part of the electromagnetic spec- trum with unique absorption features (Goetz et al. 1985). It is possible to create a spectral profile plot or spectral sig- nature for each pixel and tree species in imagery. Several studies have been developed to use this advantage by im- proving the classification technique of hyperspectral such as cross correlogram spectral matching (Van der Meer 1994), spectral angle mapper (Kruse et al. 1993) and the tricorder algorithm (Crosta et al. 1998). For instance the methods used to determine forest species composition is vary de-
pending to the requirements for a specific application, cost and availability of data. The existing approaches for esti- mating forest resources distribution include field surveys, photographic interpretation, and more recently, digital re- mote sensing. The methods used of remote sensing for for- est monitoring are largely dependent on the characteristics of the satellite from which the image is captured. Therefore, objective of this study was to classifying forest species using hyperspectral data for supporting resources management.
Materials and Methods
Study area
The study area is located in Compartment 60 of Balah Forest Reserve in Gua Musang, Kelantan, Peninsular Malaysia (Fig. 1). The study site lies between latitudes 05o23’3.18’’N to 05o23’3.08’’N and longitudes 101o57’
21.67’’E to 101o57’30.62’’E. The topography of the area is hill land at the east, west and south while lowland at the north. The location of upland from sea level is about 153 meter to 915 meter. The annual rainfalls in this area fluc- tuate from the lowest of 2.993 ml to the highest of 4.002 ml per year. Kuala Krai is generally warm throughout the year with temperatures ranging from 21oC to 32oC respectively (Fig. 1).
Materials and data processing
The primary dataset used was AISA (Airborne Imaging Spectrometer for Applications) imagery (Fig. 2).
The airborne data was captured on June 2005. The air-
borne imaging sensor was mounted onboard the NOMAD GAF-27 aircraft at 2,000 m altitude creating a 2 m spatial resolution on the ground. AISA sensor is capa- ble of collecting data within a spectral range of 430 nm to 900 nm, and collecting up to 286 spectral channels within this range. With a speed of 120 knots during data acquis- ition, the sensor was operated in spatial mode-B which were configured by the user for mapping over the tropical forest landscape (Affendi et al. 2005). The full spectral mode was used to 286 band spectral signatures of specific targets that can be used to generate pure endmembers as well as for band selection purposes. The supporting data used were topographical map of Gunung Stong Tengah Forest Reserve and forest operation map. The maps scale is 1:50,000 and was produced in 1992. These maps were used as reference for supporting airborne data in ground verification. Prior to data analysis, initial processing on the raw data was carried out to correct the distortion occurred in imagery. Pre-processing was carried out with CALIGEO software, which automatically corrects for both geometric and radiometric distortions of the raw im- age data. The radiance data set was then converted to at-sensor reflectance derived from the FODIS sensor (attached to the sensor unit during flight), which collects down welling irradiances (Fig. 2).
The hyperspectral data was geometrically corrected us- ing 1:50,000 scale topographical map and geo-rectified to Malaysia Rectified Skew Orthomorphic (MRSO) projec- tion type (Spheroid name:Modified Everest and Datum name:Kertau 1948). Ground control points (GCP’s) on the satellite image and on the topographic maps were identified and the linear geometric correction functions. Radiometric correction technique is carried out to rescale all of the pixel brightness values in an image by identifying one of the darkest pixels and one of the brightest pixels. The darkest pixel is re-assigned a value of 0, and the lightest a value of 255. The intermediate values are then rescaled to fit evenly in between.
The digital image processing was performed by using ENVI software. The end-to-end processing of hyper- spectral images referred to in the objectives is divided in four steps. The first step is image data acquisition which in- volves topographical map and forest operation map. The next step is pre- processing, includes geometric and radio-
metric correction. From the hyperspectral image two pri- mary results were produced; a spectral library of individual species and a classified image the forest species. Hyper- spectral image classification does not typically use all the spectral bands. Next a subset of the imagery from original band was selected to perform feature extraction and it’s called image enhancement process.
The sobel filtering with False Color Composite (FCC) was used to make the edges clearer and to get a sharper image. Sobel filter with a pre-set 3x3 size was found to be the most suitable filter to be applied to the airborne hyper- spectral imagery especially for visual interpretation of vege- tation on the image. The Sobel filter is a non-linear edge en- hancement, special case filter that uses an approximation of the true Sobel function.
The image classification used in this study is called Spectral Angle Mapper (SAM). SAM is spectral classi- fication process utilizing the n-dimension angle to match pixels to reference data. The angle between the spectra treated as vectors in n-space is the spectral angle. The mag- nitude of this vector can be related to the illumination of the pixel, and the angle of the vector to the spectrum shape.
Thus pixels with similar spectral shapes, but differing illu- mination, should have similar vector angles (Sohn and Rebello 2002). Using an algorithm, the spectral similarity of two (or more) images is calculated using the angle be- tween the spectra, and the smallest angular difference is the correct image. Compares image spectra to known spectra (determined in lab or field). Both images (known and un- known) treated as vectors and calculates spectral angle be- tween them. In SAM, classification is carried out by com- paring image spectra to individual spectra or a spectral li- brary (Kruse et al. 1993). It assumes that the data has been reduced to apparent reflectance (true reflectance multiplied by some unknown gain factor controlled by topography and shadows). The algorithm determines the similarity between two spectra by calculating the “spectral angle” between them, treating them as vectors in a space with dimension- ality equal to the n number of bands. This method is less sensitive to solar illumination factors, because the angle be- tween the two vectors is independent of the vectors length.
Timber volume
Timber volume measurement consists of estimates of cu-
bic-foot volume can be obtained from a tree. In field, the di- ameter of a tree at breast height (dbh), and the height of merchantable log are the two basic component of timber volume estimation. Measurements made for each tree are summed to give volume estimates for an entire stand. Thus, exploration of the role of hyperspectral remote sensing in timber volume estimation is an important task on order to evaluate current and future applications of this technology in forest inventory. Tree volume was calculated by this formula.
Volume (m3)=(ŋ x dbh2 x L x f)/(40,000) Where,
Volume=standing volume in m3 dbh=diameter at breast height (cm) L=merchantable height in m
f=form factor (0.65 for trees>15 cm dbh) Accuracy assessment
Accuracy assessment was performed from two pieces of information, the pixel or polygon in a classified map and ground reference data. The standard form for examining site specific accuracy is to use an error matrix table. The er- ror matrix also referred to as a confusion matrix because it report both overall errors and misclassification (due to con- fusion classes) by class. These results are then expressed in tabular form, often referred to as a confusion or error ma- trix (Congalton and Green 1999). Kappa coefficient (K) is another measurement used in this study. It is calculated by multiplying the total number of pixels in all the ground ver- ification classes (N) by the sum of the confusion matrix di- agonals (Xkk), subtracting the sum of the ground ver- ification pixels in a class time the sum of the classified pixels in that class summed over all classes (∑Xk∑ Yk∑), where Xk∑ is row total and Yk∑ is column total, and dividing by the total number of pixels squared minus the sum of the ground verification pixels in that class times the sum of the classified pixels in that class summed over all classes. The value of Kappa lies between 0 and 1, where 0 represents agreement due to chance only. 1 represents complete agree- ment between the two data sets. Negative values can occur but they are spurious. It is usually expressed as a percentage (%). Kappa statistic can be a more sophisticated measure-
ment to classifier agreement and thus gives better interclass discrimination than overall accuracy. Examining the equa- tion it can be seen that this statistic unlike the overall accu- racy statistic consideration misclassifications (omission and commission errors) by utilizing column and row marginals within its calculations. The possible value for this statistic ranges from 0 and 1, the higher value indicating a more ac- curate classification. A Kappa value of 0.80 can be 41 in- terpreted as the classification avoided 80% of the errors that a totally random classification would have produced. The calculation of Kappa statistic is as follows:
(1)
where,
r=number of row in the error matrix
xij=number of counts in the ijth cell of the confusion matrix
N=total number of counts in the confusion matrix xi+=marginal total of row i
x+i=marginal total of column I
The kappa coefficient of agreement has become a stand- ard accuracy measure should be reported with any pro- duced classification. Equation 2 provides the mean to com- pare KHAT value for significance using the Z-statistic.
This allow for the interpretation of significance at varying confidence interval.
∼ (2)
Where,
The measure of Kappa coefficient is the primary report- ing statistic for accuracy assessment. It determines the use- fulness and validity of any derived classification. Overall ac- curacy, producer’s accuracy and user’s accuracy are val- uable depending on one’s context to the classification and these measures should be reported with any produced clas-
Fig. 3. The spectral reflectance of eight tree species found in the image.
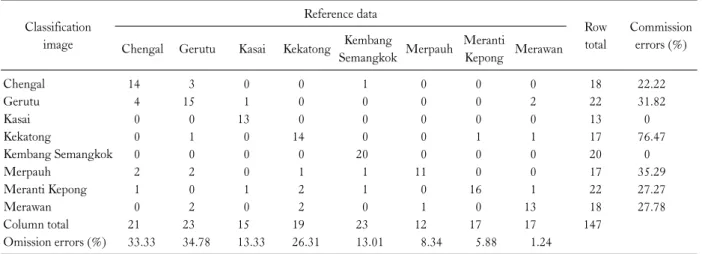
Table 2. Confusion matrix table for species classification on SAM technique
Classification image
Reference data
Row total
Commission errors (%) Chengal Gerutu Kasai Kekatong Kembang
Semangkok Merpauh Meranti
Kepong Merawan Chengal
Gerutu Kasai Kekatong
Kembang Semangkok Merpauh
Meranti Kepong Merawan Column total Omission errors (%)
14 4 0 0 0 2 1 0 21 33.33
3 15 0 1 0 2 0 2 23 34.78
0 1 13 0 0 0 1 0 15 13.33
0 0 0 14 0 1 2 2 19 26.31
1 0 0 0 20 1 1 0 23 13.01
0 0 0 0 0 11 0 1 12 8.34
0 0 0 1 0 0 16 0 17 5.88
0 2 0 1 0 0 1 13 17 1.24
18 22 13 17 20 17 22 18 147
22.22 31.82 0 76.47 0 35.29 27.27 27.78
Overall accuracy=79%, Kappa coefficient=0.75.
Table 1. Distribution of tree species generated from imagery Class name Percentage No. of trees Unclassified*
Chengal (Neobalanocarpus hemii) Gerutu (Parashorea spp.) Kasai (Pometia pinnata)
Kekatong (Cynometra malaccensis) Kembang Semangkok (Scaphium
macropodum)
Merpauh (Swintonia spp.) Meranti Kepong (Shorea ovalis) Merawan (Hopea sp.)
Total
40.51 2.86 2.32 2.10 45.61 1.38 1.13 2.66 1.43 100
139 59 41 38 146 30 27 46 32 558
*No data.
sification (Felix and Binney 1989).
Results and Discussion
The spectral library for tree species
The spectra libraries for tree species were established af- ter confirming the appropriate match between field spectra and pixel spectra. This step was done to confirm the classes that have been mapped out for eight tree species by re- flectance spectra. Fig. 3 shows the spectral reflectance of eight tree species found in the image were unique to the in- dividual species identified. The spectral signature curves of tropical tree species can be separated clearly at the near in- frared (NIR) range covering from 700-850 nm wavel- engths. The highest spectral signature in NIR range were
Kembang Semangkok (Scaphium macropodum), followed by Meranti Sarang Punai (Shorea parvifolia) and Chengal (Neobalanocarpus hemii). This is probably due to factors af- fecting spectral response such as sources of radiance from a target in both the reflectance and emittance of spectrum, at- mospheric attenuation and scattering and chlorophyll concentration. Meanwhile, the lowest spectral response were Kasai (Pometia pinnata), Kelat (Eugenia spp.) and Merawan (Hopea beccariana), respectively (Fig. 3).
Tree classification
The SAM method treats both spectrums as vectors and calculates the spectral angle between them. This method is
insensitive to illumination since the SAM algorithm uses only the vector direction and not the vector length. Thus, the result of the SAM classification is an image showing the best match at each pixel. The endmember tree spectra used by SAM were taken from the image and field spectra li- braries, which measured during the ground verification.
The radian used is 0.5, which is the most suitable radian to discriminate tree species in the forest. Table 1 show dis- tribution of tree species generated from imagery. The spec- tral signatures for each tree species from study area is very important to complete the spectral library and the result of spectral library showed that spectral signatures of each spe- cies can be differentiated in wavelength range of 700-800 nm (Fig. 1).
Timber volume estimation
Volume for each standing tree was calculated using the formula for a cylinder with a form factor of 0.65 for trees 15 cm dbh and above. Thus, average merchantable height (L) was calculated according to the Forest Department of Peninsular Malaysia (FDPM) rules. In the end of calcu- lation process, overall tree volume estimation was 318.37 m3 per hectare.
Accuracy assessment
The accuracy assessment was examined from a total of 147 ground reference pixel and reference spectral (spectral library) for each tree species. Table 2 is a confusion matrix for hyperspectral classification. The overall accuracy ob- tained was 79%, with a Kappa coefficient of 0.75. It is found that nearly all tree species were correctly identified with accuracy more than 75%. However the overall accu- racy and kappa coefficient yielded from this study is quite low, but this result is relatively similar to research done by Bo Zhou (2007) and Helmi et al. (2007); which revealed that SAM technique is not shows a good performance com- pared to supervised Minimum Noise Fraction (MNF) and Artificial Neural Network (ANN) approaches (Table 2).
Conclusion
A study on the hyperspectral data and development of spectral library for tropical forest is important as a baseline for further classification processes. This results can identify
a specific tree species, therefore improved the accuracy of measurement of forests, which is crucial in forest resource management. Although the accuracy of SAM techniques is below the expectation level, SAM classifier was able to clas- sify tropical tree species. As a result, eight species has been identified in study area with a mapping accuracy of 79%
and Kekatong (Cynometra malaccensis) is the highest species distribution in study area with 45.61%, respectively. The average spectrum can be set relatively larger until confusion happen between different vegetation classes. This approach provides a means to detect the individual tree species or functional properties of plants compared to other coarse re- mote sensing technique. In future it is believe that the most effective way of ground data collection is to use the ground object that has the strongest response or prominent vegeta- tion for more significant tree signatures.
References
Affendi S, Ainuddin NA, Awg Noor AG, Faridah Hanum I, Shafri HZM, Manohar M. 2005. Optimized selection of hy- perspectral bandsets for mapping of tropical timber trees using hyperspectral imaging sensors. In proceedings of the 14th Malaysian Forestry Conference, Kota Kinablu, Sabah, Malaysia.
Bo Zhou. 2007. Application of hyperspectral remote sensing in de- tecting and mapping sericea lespedeza in missouri. MS Thesis.
University of Missouri-Columbia.
Congalton RG, Green K. 1999. A Comparison of sampling schemes used in generating error matrices for assessing the ac- curacy of maps generated from remotely sensed data.
Photogramm Eng Remote Sens 54: 593-600.
Crosta AP, Sabine C, Taranik JV. 1998. Hydrothermal alteration mapping at bodie, california, using aviris hyperspectral data.
Remote Sens Environ 65: 309-319.
Felix NA, Binney DL. 1989. Accuracy Assessment of a landsat as- sisted vegetation map of the coastal plain of the artic national wildlife refuge. Photogramm Eng Remote Sens 55: 475-478.
Goetz AF, Vane G, Solomon JE, Rock BN. 1985. Imaging spec- trometry for Earth remote sensing. Science 228: 1147-1153.
Helmi Zulhaidi MS, Affendi S, Shattri M. 2007. The Performance of maximum likelihood, spectral angle mapper, neural network and decision tree classifiers in hyperspectral image analysis. J Computer Sc 3: 419-423.
Kruse FA, Lefkoff AB, Boardman JW, Heidebrecht KB, Shapiro AT, Barloon PJ, Goetz AFH. 1993. The Spectral image proc- essing system (SIPS)-interactive visualization and analysis of imaging spectrometer data. Remote Sens Environ 44: 145-163 Mohd Hasmadi I, Kamaruzaman J, Alias MS, Pakhriaza HZ,
Manohar M. 2009. A review on application of hyperspectral imaging to forest resources in malaysia. J Sustainability Sc and Mgmt 4: 75-84.
Pearce D, Putz FE, Vanclay JK. 2003. Sustainable forestry in the tropics: panacea or folly? Forest Ecology and Management 172:
229-247.
Sayer J, Campbell B, Petheram L, Aldrich M, Ruiz Perez M, Endamana D, Dongmo ZN. 2007. Assessing environment and development outcomes in conservation landscapes. Biodivers Conserv 16: 2677-2694.
Sohn Y, Rebello NS. 2002. Supervised and unsupervised spectral
angle classifiers. Photogramm Eng Remote Sens 68: 1271- 1280.
Van Der Meer FD. 1994. Extraction of mineral absorption features from high-spectral resolution data using non-parametric geo- statistical techniques. International Journal of Remote Sensing 15: 2193-2214.
Woodcock CE, Collins JB, Gopal S, Jakabhazy VD, Li X, Macomber S, Rherd S, Harward VJ, Levitan J, Wu Y, Warbington R.1994. Mapping forest vegetation using landsat tm imagery and A canopy reflectance model. Remote Sensing of Environment 50: 240-254.