* Corresponding author: (E-mail) [email protected], [email protected]
Species Composition and Diversity in Mid-altitudinal Moist Temperate Forests of the Western Himalaya
Sumeet Gairola, C.M. Sharma*, Sarvesh Suyal, and S.K. Ghildiyal
Department of Botany, HNB Garhwal University (A Central University), Post Box No. 51, Srinagar Garhwal- 246 174, Uttarakhand India
ABSTRACT : The present study was undertaken in middle altitudinal (1500 to 2500 masl) moist temperate forest of Mandal-Chopta area in the Garhwal region of Uttarakhand, India. The aim of the present study was to assess the variation in species composition and diversity in different vegetation layers viz. herb, shrub and tree, at different altitudes. Shannon-Wiener diversity index (), Nha-1, total basal cover per hectare (G), Simpson concentration of dominance, Pielou Equitability, species richness (SR), Margalef index, Menheink index of species richness and β-diversity were calculated to understand community composition. Tree G ranged from 84.25 to 35.08 m2ha-1 and total stem density varied from 990 to 1470 Nha-1. Total SR (herb, shrub and trees) among different forest types ranged between 31 and 58. Maximum G of herb and shrub layers was recorded at lower altitudes between 1500 and 1650 masl. β-diversity was higher in herb layers as compared to tree and shrub layers. Dominance-diversity curves were also drawn to ascertain resource apportionment among various species in different forest types. Values of species diversity, , Nha-1 and G were higher in the study area as compared to similar forests growing in other parts of Uttarakhand Himalaya.
Keywords : Density, Diversity, Altitude, Beta diversity, Dominance-diversity, Garhwal Himalaya
INTRODUCTION
Forests are the most extensive, complex and biologically productive entities amongst all the terrestrial ecosystems.
They are one of the major categories of landscapes, and form one of the most important natural resources of the world. Forests are three-dimensional systems, which can be thought of as both a product of forest dynamics and biophysical processes and as a template for biodiversity and ecosystem function. The species in a community grow together in a particular environment because they have a similar requirement for existence in terms of environmental factors (Ter Braak, 1987). A variety of factors contribute to the diversity of plants. Plant species diversity is affected by several topographic gradients and climatic variations. The factors which affect plant species richness and diversity are of crucial importance in ecology and conservation biology.
The number of species in a particular forest type varies markedly along the altitudinal range of its growth, which depends on the complex suit of factors that characterize the
habitat of individual species. The physiographic factors are widely known to show a major impact on plant microh- abitats, especially in hill-slope form (Sharma et al., 2010a).
The physiographic features such as elevation and aspect have a profound influence on the distribution, growth, form and structure of tree species, as a result of which the individual tree species has different values for density and basal cover at various altitudes and aspects (Wikum and Wali, 1974). Slobodkin and Sanders (1969) opined that species richness of any community is a function of severity, variability and predictability of the environment in which it develops. Therefore, diversity tends to increase as the environment becomes more favourable and more predictable (Putman, 1994). Thus it is necessary to understand the dynamics and relationship between various factors which affect richness and diversity of the forests.
Himalayan forests play an important role in tempering the inclemencies of the climate, in cooling and purifying the atmosphere, in protecting the soil, in holding the hill-slopes in position, and in building up huge reserves of soil
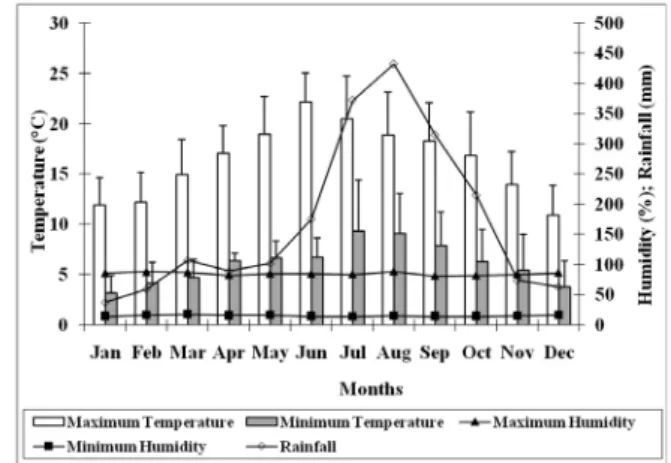
Fig. 1. Map of the study area Fig. 2. Meteorological data of the study area (1998-2007) (Source: Uttarakhand Forest Department)
nutrients. Middle altitudinal forests (between 1500 and 2500) of the western Himalaya are considered to be very productive and rich in biodiversity. It has been realized that for the sound management of Himalayan ecosystem, the knowledge of plant community, diversity, population, distribution, regeneration, utilization, environmental impact assessment, etc are essential to support the conservation and restoration of the environment. This type of ecological knowledge is fundamental for conservation and sustainable utilization, and may provide important information to the policy makers for drafting management plans of fragile mountain ecosystems. Although recently some studies have analyzed the phytosociology and diversity of different forest types of the region (Sharma et al., 2009a, 2009b, 2009c, 2010a, 2010b, 2010c, 2010d; Gairola, 2010), but still there is paucity of studies related to middle altitudinal forests of Garhwal Himalaya. Keeping the aforesaid facts in view, the aim of the present study was to assess the variation in species composition and diversity of different vegetation layers viz. herb, shrub and tree, in middle altitudinal forest types of moist temperate Mandal-Chopta forest area.
MATERIALS AND METHODS Study area
The present study was conducted in Mandal-Chopta forest area, which forms a large (nearly 1100 ha), prestigious,
and botanically valuable reserve complex (Trishula Reserve Forest of Kedarnath Forest Division) in the Garhwal region (Western Himalaya) of Chamoli district of Uttarakhand state, India (Fig. 1). It occurs at 30° 27.560' N latitude and 79° 15.234' E longitude along an altitudinal gradient of 1500 masl to 2500 masl. It is a rich moist temperate forest situated 12 km away from the district headquarter, Gopeshwar. Recently Gairola et al. (2010) have recorded 338 species of vascular plants (334 Angiosperms and 4 Gymnosperms) belonging to 93 families (91 Angiosperms and 2 Gymnosperms) and 249 genera (246 Angiosperms and 3 Gymnosperms) from the study area. The study area is characterized by undulating topography with gentle slopes on Northern, Northeastern and Northwestern faces and somewhat steep slopes on Southern and Southwestern directions. The soil types found in the region are brown and black forest soils and podozolic soils. Soil texture of the study area is predominantly sandy loam and sandy clay loam whereas soil colour varies from yellowish brown to dark brown (Sharma et al., 2010d). Soils are generally gravelly and large boulders are common in the area. Num- erous high ridges, deep gorges and precipitous cliffs, rocky crages and narrow valleys are part of the topography of the region. The topography of the area has also been influenced by landslides, which are common during rainy season.
Geologically, the rocks in the study sites are complex mixture of mainly sedimentary, low grade metamorphosed with sequence capped by crystalline nappe. The study area
Table 1. General details of the studied forest types.
FT Forest Type Altitude
(m asl)
Slope aspect (facing)
FT1 Mixed Abies pindrow 2500-2100 South
FT2 Mixed broad-leaved 2400-2150 North-east
FT3 Mixed broad-leaved 2150-1900 North-east
FT4 Mixed broad-leaved 1900-1600 North
FT5 Mixed Quercus leucotrichophora 1650-1500 North-east
lies in the central axis of the great Himalaya, which consists of belts of metamorphic rocks; includes gneisses, granites and schists, known as the central crystalline groups. Most of the rocks in the study area are fine to coarse-grained schists, all very much interleaved. Meteorological details (1998-2007) of the study are given in Fig. 2. Mean annual maximum and minimum temperature were recorded as 16.41±3.60 °C and 6.14±1.98 °C respectively. Mean annual rainfall was recorded as 2044.47±476.01 mm. Mean relative humidity round the year ranged from 15% to 86%.
Sampling and data analysis
After the reconnaissance survey five forest categories according to altitude, slope aspect and dominant tree species were selected for the study (Table 1). Physiographic factors i.e., altitude, and aspect across different cover types were measured by GPS (Garmin, Rino-130). The composition of the forest types was analyzed by using nested quadrat method as per Kent and Coker (1992). Trees (≥10 cm dbh), shrubs and herbs were analyzed by 10m × 10m, 5m
× 5m and 1m × 1m sized quadrats, respectively as proposed by Curtis and McIntosh (1950) and Phillips (1959). Density (Nha-1) and basal cover (G) were calculated for each species.
Frequency, density and abundance were calculated following Curtis and McIntosh (1950). Species richness (SR) was simply taken as a count of total number of species in that particular forest type. The Importance Value Index (Phillips, 1959), Shannon-Wiener diversity index (Shannon and Weaver, 1963), Simpson concentration of dominance (Simpson, 1949), Pielou equitability (Pielou, 1966), Margalef index of species richness (Margalef, 1958), Menheink index of
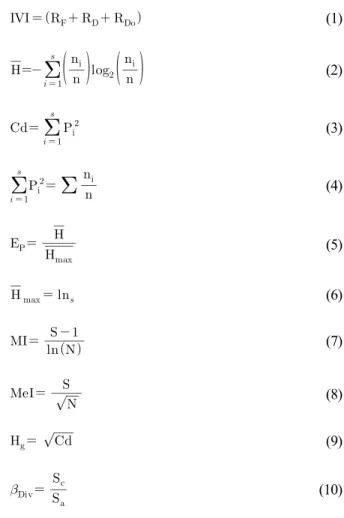
species richness (Whittaker, 1977), species heterogeneity and beta diversity (Whittaker, 1972) were calculated with the following formulae:
(1)
(2)
(3)
(4)
(5)
(6)
(7)
(8)
(9)
(10)
where, Cd is Simpson concentration of dominance, Ep is Pielou equitability, Hg is species heterogeneity, is Shannon-Wiener diversity index, IVI is Importance Value Index, lnS is natural log of S, MeI is Menheink index of species richness, MI is Margalef index of species richness,
n is total IVI values of all species, N is total number of individuals, ni is the IVI value of a species, RD is relative density, RDo is relative dominance, RF is relative frequency, S is total number of species in forest type, Sa is average number of species per stand, Sc is total number of species in all stands, and βDiv is Beta Diversity.
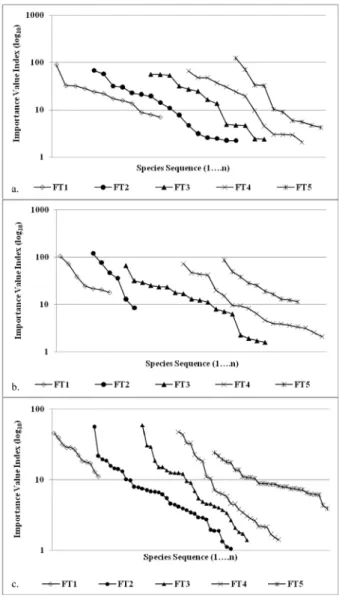
To ascertain the resource apportionment among various species in different forest types, dominance-diversity (d-d) curves were drawn. The relative importance value is an expressive measure of niche of species, thus treated as an expression of the relative niche size. The dominance-diversity curves were drawn by a co-ordinate point of its relative importance index (IVI) on the y-axis and its position in the sequence of species from highest to lowest IVI on the x-axis (Whittaker, 1975) for tree, shrub and herb layers.
RESULTS AND DISCUSSION
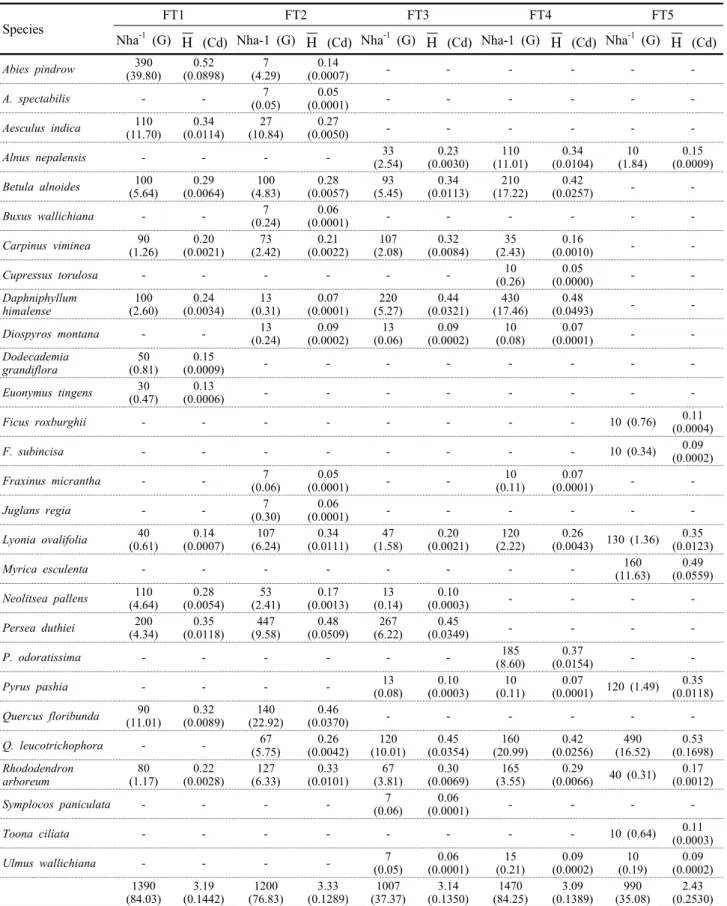
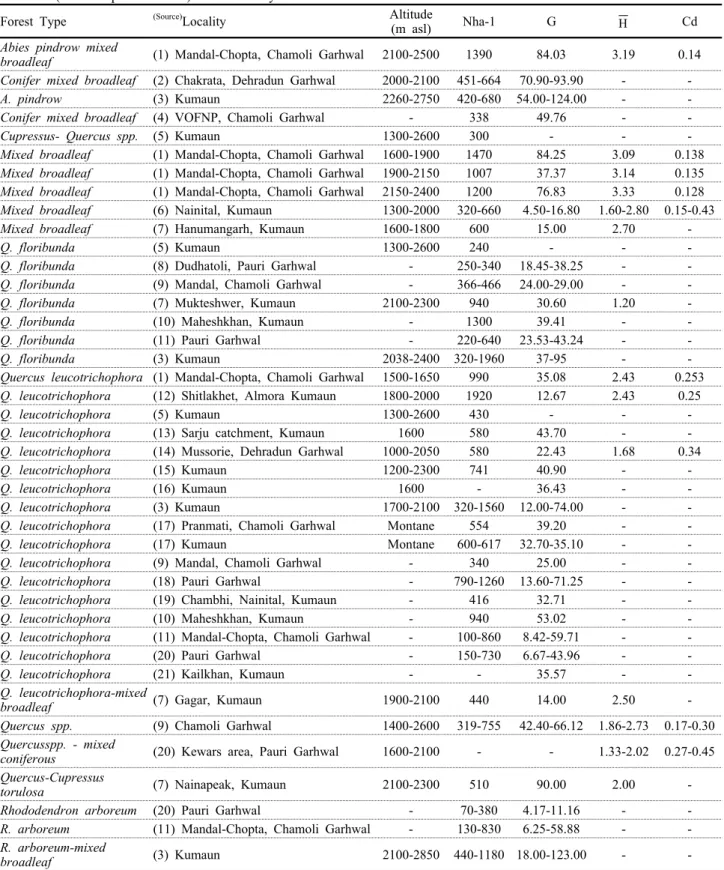
The middle altitudinal zone of western Himalaya is characterized by extensive oak and coniferous forests. The values of Nha-1, G, Shannon-Wiener diversity index () and Simpson concentration of dominance (Cd) for different species in tree, shrub and herb strata are placed in Tables 2, 3 and 4, respectively. These community characters varied markedly among different aspects and altitudes. Total values of phytosociological and diversity indices in different forest types are placed in Table 5. Comparison between phytosociological and diversity indices of tree strata at various altitudes in different parts of the Uttarakhand Himalaya (earlier reported values) and the study area is given in Table 6.
Abies pindrow was dominant tree species between 2100 and 2500 masl on southern aspect (IVI=89.91; G= 39.8 m2ha-1; stem density= 390 Nha-1; = 0.52; Cd= 0.0898). It showed very feeble presence between 2150 and 2400 masl on north-east aspect (IVI= 7.75; G= 4.29 m2ha-1; stem density= 7 Nha-1; = 0.14; Cd= 0.0007). Lower altitudes and moderate slopes constitute suitable habitat conditions for many tree species, but A. pindrow preferred higher altitudes and steeper slopes. Therefore, A. pindrow was not present in the forest types below 2100 masl. The average
Nha-1 and G values of A. pindrow in the present study were comparable to the earlier recorded values for the A.
pindrow forests of the temperate Himalaya (Baduni, 1996;
Dhar et al., 1997; Sharma and Baduni, 2000; Sharma et al., 2001). The stem density of A. pindrow varied from 7 to 390 Nha-1, which were relatively low, when compared with values reported by Sharma and Baduni (2000) for pure A.
pindrow forests (440 to 550 Nha-1) in Garhwal Himalaya.
The G of A. pindrow in the present study ranged from 4.29 to 39.8 m2ha-1, which was slightly higher than the values (35.66 m2ha-1) reported by Sharma et al. (2001). It was because comparatively old growth forests of A. pindrow were present in the study area.
Quercus floribunda was found distributed between 2100 and 2500 masl. It was co-dominant of A. pindrow from 2100 to 2500 masl on southern aspect. With other broadleaved tree species Q. floribunda (IVI= 62.98; G=
13.48 m2ha-1; stem density= 93 Nha-1; = 0.47; Cd=
0.0441) formed good portion of mixed broad-leaf forest type (FT2) between 2150 and 2400 masl on north-east aspect. Q. leucotrichophora was distributed between 1500 and 2400 masl. It was dominant at lower altitudes of the study area between 1500 and 1650 masl on north-east aspect (IVI= 123.61; G= 16.52 m2ha-1; stem density= 490 Nha-1; = 0.53; Cd= 0.170). However, at other altitudes and aspects it was found growing as a co-dominant or associated tree species. Q. leucotrichophora has contributed feebly to total forest composition between 2150 and 2400 masl on north-east aspect (IVI= 19.53; G= 5.75 m2ha-1; stem density= 67 Nha-1; = 0.26; Cd= 0.004). In association with other broadleaved tree species, Q. leucotrichophora formed moderate portions of forests between 1900 and 2150 masl on north-east aspect (IVI= 56.47; G= 10.01 m2ha-1; stem density= 120 Nha-1; = 0.45; Cd= 0.035) and between 1600 and 1900 masl on north aspect (IVI= 48.02; G= 20.99 m2ha-1; stem density= 160 Nha-1; = 0.42; Cd= 0.026). In western Himalaya, the Pinus roxburghii is considered to be an early successional species whereas Quercus spp. and A.
pindrow are considered to be climax species (Champion and Seth, 1968).
Lyonia ovalifolia and Rhododendron arboreum were
Table 2. Community composition and diversity in tree strata
Species FT1 FT2 FT3 FT4 FT5
Nha-1 (G) Η (Cd) Nha-1 (G) Η (Cd) Nha-1 (G) Η (Cd) Nha-1 (G) Η (Cd) Nha-1 (G) Η (Cd)
Abies pindrow 390
(39.80) 0.52
(0.0898) 7
(4.29) 0.14
(0.0007) - - - - - -
A. spectabilis - - 7
(0.05) 0.05
(0.0001) - - - - - -
Aesculus indica 110
(11.70) 0.34
(0.0114) 27
(10.84) 0.27
(0.0050) - - - - - -
Alnus nepalensis - - - - 33
(2.54) 0.23
(0.0030) 110
(11.01) 0.34
(0.0104) 10
(1.84) 0.15 (0.0009) Betula alnoides 100
(5.64) 0.29
(0.0064) 100
(4.83) 0.28
(0.0057) 93
(5.45) 0.34
(0.0113) 210
(17.22) 0.42
(0.0257) - -
Buxus wallichiana - - 7
(0.24)
0.06
(0.0001) - - - - - -
Carpinus viminea 90
(1.26) 0.20
(0.0021) 73
(2.42) 0.21
(0.0022) 107
(2.08) 0.32
(0.0084) 35
(2.43) 0.16
(0.0010) - -
Cupressus torulosa - - - - - - 10
(0.26) 0.05
(0.0000) - -
Daphniphyllum
himalense 100
(2.60) 0.24
(0.0034) 13
(0.31) 0.07
(0.0001) 220
(5.27) 0.44
(0.0321) 430
(17.46) 0.48
(0.0493) - -
Diospyros montana - - 13
(0.24) 0.09
(0.0002) 13
(0.06) 0.09
(0.0002) 10
(0.08) 0.07
(0.0001) - -
Dodecademia
grandiflora 50
(0.81) 0.15
(0.0009) - - - - - - - -
Euonymus tingens 30
(0.47) 0.13
(0.0006) - - - - - - - -
Ficus roxburghii - - - - - - - - 10 (0.76) 0.11
(0.0004)
F. subincisa - - - - - - - - 10 (0.34) 0.09
(0.0002)
Fraxinus micrantha - - 7
(0.06) 0.05
(0.0001) - - 10
(0.11) 0.07
(0.0001) - -
Juglans regia - - 7
(0.30) 0.06
(0.0001) - - - - - -
Lyonia ovalifolia 40
(0.61) 0.14
(0.0007) 107
(6.24) 0.34
(0.0111) 47
(1.58) 0.20
(0.0021) 120
(2.22) 0.26
(0.0043) 130 (1.36) 0.35 (0.0123)
Myrica esculenta - - - - - - - - 160
(11.63) 0.49 (0.0559) Neolitsea pallens 110
(4.64) 0.28
(0.0054) 53
(2.41) 0.17
(0.0013) 13
(0.14) 0.10
(0.0003) - - - -
Persea duthiei 200
(4.34)
0.35 (0.0118)
447 (9.58)
0.48 (0.0509)
267 (6.22)
0.45
(0.0349) - - - -
P. odoratissima - - - - - - 185
(8.60) 0.37
(0.0154) - -
Pyrus pashia - - - - 13
(0.08) 0.10
(0.0003) 10
(0.11) 0.07
(0.0001) 120 (1.49) 0.35 (0.0118) Quercus floribunda 90
(11.01) 0.32
(0.0089) 140
(22.92) 0.46
(0.0370) - - - - - -
Q. leucotrichophora - - 67
(5.75) 0.26
(0.0042) 120
(10.01) 0.45
(0.0354) 160
(20.99) 0.42
(0.0256) 490
(16.52) 0.53 (0.1698) Rhododendron
arboreum 80
(1.17) 0.22
(0.0028) 127
(6.33) 0.33
(0.0101) 67
(3.81) 0.30
(0.0069) 165
(3.55) 0.29
(0.0066) 40 (0.31) 0.17 (0.0012)
Symplocos paniculata - - - - 7
(0.06) 0.06
(0.0001) - - - -
Toona ciliata - - - - - - - - 10 (0.64) 0.11
(0.0003)
Ulmus wallichiana - - - - 7
(0.05) 0.06
(0.0001) 15
(0.21) 0.09
(0.0002) 10
(0.19) 0.09 (0.0002) 1390
(84.03) 3.19
(0.1442) 1200
(76.83) 3.33
(0.1289) 1007
(37.37) 3.14
(0.1350) 1470
(84.25) 3.09
(0.1389) 990
(35.08) 2.43 (0.2530) Abbreviations: Nha-1 = stem density; G= total basal cover (m2ha-1) Η = Shannon-Wiener diversity index; Cd= Simpson concentration of dominance.
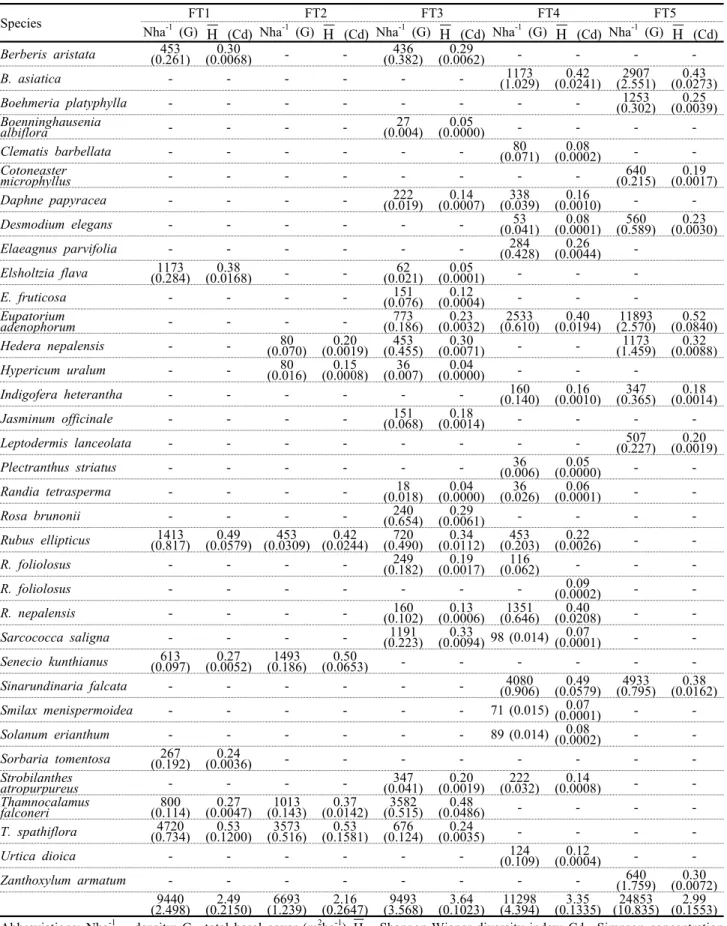
Table 3. Community composition and diversity in shrub strata
Species FT1 FT2 FT3 FT4 FT5
Nha-1 (G) Η (Cd) Nha-1 (G) Η (Cd) Nha-1 (G) Η (Cd) Nha-1 (G) Η (Cd) Nha-1 (G) Η (Cd) Berberis aristata 453
(0.261) 0.30
(0.0068) - - 436
(0.382) 0.29
(0.0062) - - - -
B. asiatica - - - - - - 1173
(1.029) 0.42
(0.0241) 2907
(2.551) 0.43 (0.0273)
Boehmeria platyphylla - - - - - - - - 1253
(0.302) 0.25 (0.0039) Boenninghausenia
albiflora - - - - 27
(0.004) 0.05
(0.0000) - - - -
Clematis barbellata - - - - - - 80
(0.071) 0.08
(0.0002) - -
Cotoneaster
microphyllus - - - - - - - - 640
(0.215) 0.19 (0.0017)
Daphne papyracea - - - - 222
(0.019) 0.14
(0.0007) 338
(0.039) 0.16
(0.0010) - -
Desmodium elegans - - - - - - 53
(0.041) 0.08
(0.0001) 560
(0.589) 0.23 (0.0030)
Elaeagnus parvifolia - - - - - - 284
(0.428) 0.26 (0.0044) - Elsholtzia flava 1173
(0.284) 0.38
(0.0168) - - 62
(0.021) 0.05
(0.0001) - - -
E. fruticosa - - - - 151
(0.076) 0.12
(0.0004) - - -
Eupatorium
adenophorum - - - - 773
(0.186) 0.23
(0.0032) 2533
(0.610) 0.40
(0.0194) 11893
(2.570) 0.52 (0.0840)
Hedera nepalensis - - 80
(0.070) 0.20
(0.0019) 453
(0.455) 0.30
(0.0071) - - 1173
(1.459) 0.32 (0.0088)
Hypericum uralum - - 80
(0.016) 0.15
(0.0008) 36
(0.007) 0.04
(0.0000) - - -
Indigofera heterantha - - - - - - 160
(0.140) 0.16
(0.0010) 347
(0.365) 0.18 (0.0014)
Jasminum officinale - - - - 151
(0.068) 0.18
(0.0014) - - - -
Leptodermis lanceolata - - - - - - - - 507
(0.227) 0.20 (0.0019)
Plectranthus striatus - - - - - - 36
(0.006) 0.05
(0.0000) - -
Randia tetrasperma - - - - 18
(0.018) 0.04
(0.0000) 36
(0.026) 0.06
(0.0001) - -
Rosa brunonii - - - - 240
(0.654) 0.29
(0.0061) - - - -
Rubus ellipticus 1413
(0.817) 0.49
(0.0579) 453
(0.0309) 0.42
(0.0244) 720
(0.490) 0.34
(0.0112) 453
(0.203) 0.22
(0.0026) - -
R. foliolosus - - - - 249
(0.182) 0.19
(0.0017) 116
(0.062) - - -
R. foliolosus - - - - - - - 0.09
(0.0002) - -
R. nepalensis - - - - 160
(0.102) 0.13
(0.0006) 1351
(0.646) 0.40
(0.0208) - -
Sarcococca saligna - - - - 1191
(0.223) 0.33
(0.0094) 98 (0.014) 0.07
(0.0001) - -
Senecio kunthianus 613
(0.097) 0.27
(0.0052) 1493
(0.186) 0.50
(0.0653) - - - - - -
Sinarundinaria falcata - - - - - - 4080
(0.906) 0.49
(0.0579) 4933
(0.795) 0.38 (0.0162)
Smilax menispermoidea - - - - - - 71 (0.015) 0.07
(0.0001) - -
Solanum erianthum - - - - - - 89 (0.014) 0.08
(0.0002) - -
Sorbaria tomentosa 267
(0.192) 0.24
(0.0036) - - - - - - - -
Strobilanthes
atropurpureus - - - - 347
(0.041) 0.20
(0.0019) 222
(0.032) 0.14
(0.0008) - -
Thamnocalamus
falconeri 800
(0.114) 0.27
(0.0047) 1013
(0.143) 0.37
(0.0142) 3582
(0.515) 0.48
(0.0486) - - - -
T. spathiflora 4720
(0.734) 0.53
(0.1200) 3573
(0.516) 0.53
(0.1581) 676
(0.124) 0.24
(0.0035) - - - -
Urtica dioica - - - - - - 124
(0.109) 0.12
(0.0004) - -
Zanthoxylum armatum - - - - - - - - 640
(1.759) 0.30 (0.0072) (2.498)9440 2.49
(0.2150) 6693
(1.239) 2.16
(0.2647) 9493
(3.568) 3.64
(0.1023) 11298
(4.394) 3.35
(0.1335) 24853
(10.835) 2.99 (0.1553) Abbreviations: Nha-1 = density; G= total basal cover (m2ha-1) Η = Shannon-Wiener diversity index; Cd= Simpson concentration of dominance.
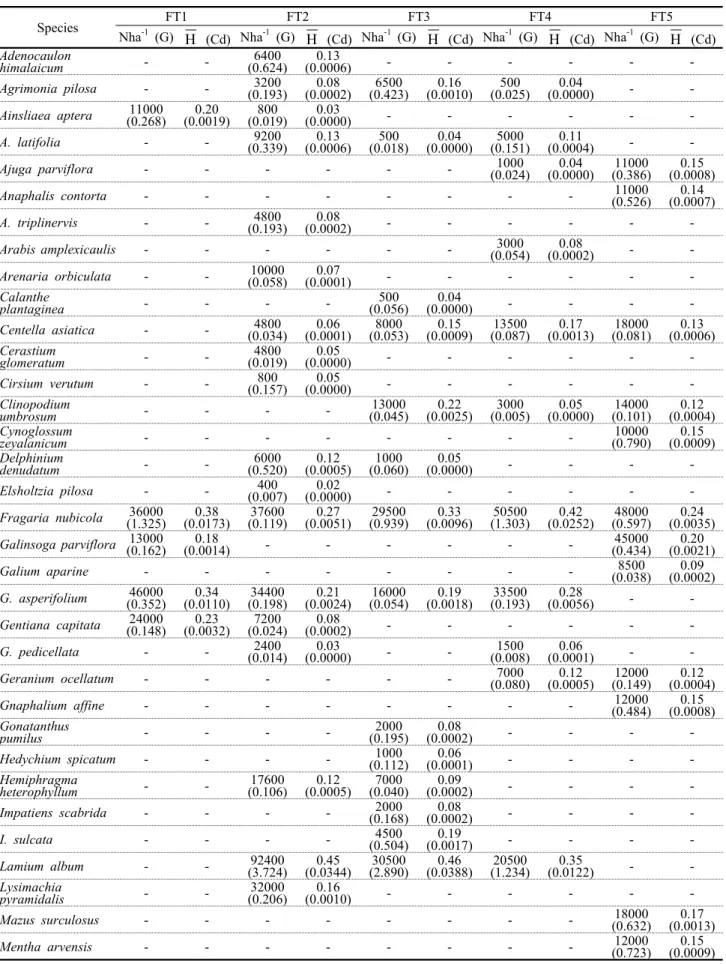
Table 4. Community composition and diversity in herb strata
Species FT1 FT2 FT3 FT4 FT5
Nha-1 (G) Η (Cd) Nha-1 (G) Η (Cd) Nha-1 (G) Η (Cd) Nha-1 (G) Η (Cd) Nha-1 (G) Η (Cd) Adenocaulon
himalaicum - - 6400
(0.624) 0.13
(0.0006) - - - - - -
Agrimonia pilosa - - 3200
(0.193) 0.08
(0.0002) 6500
(0.423) 0.16
(0.0010) 500
(0.025) 0.04
(0.0000) - -
Ainsliaea aptera 11000
(0.268) 0.20
(0.0019) 800
(0.019) 0.03
(0.0000) - - - - - -
A. latifolia - - 9200
(0.339) 0.13
(0.0006) 500
(0.018) 0.04
(0.0000) 5000
(0.151) 0.11
(0.0004) - -
Ajuga parviflora - - - - - - 1000
(0.024) 0.04
(0.0000) 11000
(0.386) 0.15 (0.0008)
Anaphalis contorta - - - - - - - - 11000
(0.526) 0.14 (0.0007)
A. triplinervis - - 4800
(0.193) 0.08
(0.0002) - - - - - -
Arabis amplexicaulis - - - - - - 3000
(0.054) 0.08
(0.0002) - -
Arenaria orbiculata - - 10000
(0.058) 0.07
(0.0001) - - - - - -
Calanthe
plantaginea - - - - 500
(0.056) 0.04
(0.0000) - - - -
Centella asiatica - - 4800
(0.034) 0.06
(0.0001) 8000
(0.053) 0.15
(0.0009) 13500
(0.087) 0.17
(0.0013) 18000
(0.081) 0.13 (0.0006) Cerastium
glomeratum - - 4800
(0.019) 0.05
(0.0000) - - - - - -
Cirsium verutum - - 800
(0.157) 0.05
(0.0000) - - - - - -
Clinopodium
umbrosum - - - - 13000
(0.045) 0.22
(0.0025) 3000
(0.005) 0.05
(0.0000) 14000
(0.101) 0.12 (0.0004) Cynoglossum
zeyalanicum - - - - - - - - 10000
(0.790) 0.15 (0.0009) Delphinium
denudatum - - 6000
(0.520) 0.12
(0.0005) 1000
(0.060) 0.05
(0.0000) - - - -
Elsholtzia pilosa - - 400
(0.007) 0.02
(0.0000) - - - - - -
Fragaria nubicola 36000
(1.325) 0.38
(0.0173) 37600
(0.119) 0.27
(0.0051) 29500
(0.939) 0.33
(0.0096) 50500
(1.303) 0.42
(0.0252) 48000
(0.597) 0.24 (0.0035) Galinsoga parviflora 13000 (0.162) 0.18
(0.0014) - - - - - - 45000
(0.434) 0.20 (0.0021)
Galium aparine - - - - - - - - 8500
(0.038) 0.09 (0.0002) G. asperifolium 46000
(0.352) 0.34
(0.0110) 34400
(0.198) 0.21
(0.0024) 16000
(0.054) 0.19
(0.0018) 33500
(0.193) 0.28
(0.0056) - -
Gentiana capitata 24000
(0.148) 0.23
(0.0032) 7200
(0.024) 0.08
(0.0002) - - - - - -
G. pedicellata - - 2400
(0.014) 0.03
(0.0000) - - 1500
(0.008) 0.06
(0.0001) - -
Geranium ocellatum - - - - - - 7000
(0.080) 0.12
(0.0005) 12000
(0.149) 0.12 (0.0004)
Gnaphalium affine - - - - - - - - 12000
(0.484) 0.15 (0.0008) Gonatanthus
pumilus - - - - 2000
(0.195) 0.08
(0.0002) - - - -
Hedychium spicatum - - - - 1000
(0.112) 0.06
(0.0001) - - - -
Hemiphragma
heterophyllum - - 17600
(0.106) 0.12
(0.0005) 7000
(0.040) 0.09
(0.0002) - - - -
Impatiens scabrida - - - - 2000
(0.168) 0.08
(0.0002) - - - -
I. sulcata - - - - 4500
(0.504) 0.19
(0.0017) - - - -
Lamium album - - 92400
(3.724) 0.45
(0.0344) 30500
(2.890) 0.46
(0.0388) 20500
(1.234) 0.35
(0.0122) - -
Lysimachia
pyramidalis - - 32000
(0.206) 0.16
(0.0010) - - - - - -
Mazus surculosus - - - - - - - - 18000
(0.632) 0.17 (0.0013)
Mentha arvensis - - - - - - - - 12000
(0.723) 0.15 (0.0009)
Table 4. Continued
Micromeria biflora - - - - - - - - 18000
(0.070) 0.13 (0.0006) Origanum vulgare 35000
(0.234) 0.41
(0.0232) 11600
(0.624) 0.14
(0.0007) - - 2000
(0.125) 0.07
(0.0001) 36000
(2.328) 0.29 (0.0065)
Oxalis corniculata - - 4800
(0.059) 0.06
(0.0001) 5000
(0.062) 0.10
(0.0003) 5000
(0.057) 0.09
(0.0002) 60500
(0.583) 0.25 (0.0042)
Paris polyphylla - - 14800
(1.657) 0.26
(0.0042) 5500
(0.521) 0.22
(0.0025) 2500
(0.244) 0.12
(0.0004) - -
Parochetus
communis 37000
(0.356) 0.28
(0.0055) 32800
(0.147) 0.20
(0.0019) 9000
(0.087) 0.13
(0.0005) 6000
(0.027) 0.09
(0.0002) - -
Pedicularis bifida - - 7200
(0.176) 0.07
(0.0001) - - - - - -
Peperomia
tetraphylla - - - - 20000
(0.048) 0.19
(0.0017) 8000
(0.023) 0.13
(0.0006) - -
Peristrophe
paniculata - - - - - - - - 7500
(0.461) 0.12 (0.0005)
P. speciosa - - - - - - - - 9500
(0.531) 0.14 (0.0007)
Persicaria capitata - - - - - - - - 17000
(1.301) 0.20 (0.0021) P. hydropiper 31000
(0.632) 0.32
(0.0091) 8800
(0.355) 0.14
(0.0007) - - 3000
(0.073) 0.07
(0.0001) 14000
(0.492) 0.14 (0.0007)
Pilea umbrosa - - 4800
(0.468) 0.10
(0.0003) - - - - - -
Plantago depressa - - 3600
(0.351) 0.09
(0.0002) - - 1000
(0.060) 0.05
(0.0001) 11000
(1.042) 0.18 (0.0014)
Potentilla fulgens - - 2800
(0.273) 0.09
(0.0002) - - - - - -
Pouzolzia zeylanica - - - - - - - - 9500
(0.400) 0.13 (0.0006) Prunella vulgaris 41000
(0.686) 0.32
(0.0091) 13600
(0.677 ) 0.16
(0.0011) - - - - - -
Rubia manjith - - 6800
(0.274) 0.11
(0.0004) 2500
(0.101) 0.09
(0.0002) 500
(0.018) 0.04
(0.0000) - -
Rumex hastatus - - - - - - 1000
(0.060) 0.05
(0.0001) 11500
(0.909) 0.17 (0.0012)
R. nepalensis - - 2400
(0.269) 0.07
(0.0001) - - - - - -
Salvia nubicola 7000
(0.683) 0.24
(0.0035) - - 500
(0.047) 0.04
(0.0000) - - - -
Scutellaria scandens - - - - 16500
(1.388) 0.33
(0.0103) 17500
(1.339) 0.35
(0.0117) 9500
(0.658) 0.15 (0.0008)
Senecio nudicaulis - - 1600
(0.135) 0.05
(0.0000) 1000
(0.089) 0.07
(0.0001) - - - -
Solanum nigrum - - - - - - - - 6000
(0.058) 0.08 (0.0002)
Sonchus brachyotus - - - - - - - - 6000
(0.416) 0.13 (0.0006)
Stellaria media - - 24000
(0.585) 0.21
(0.0022) 12000
(0.215) 0.20
(0.0020) 57000
(0.994) 0.40
(0.0212) 30000
(0.373) 0.17 (0.0013)
Swertia chirayita - - 800
(0.032) 0.03
(0.0000) - - - - - -
Taraxacum
officinale - - - - 4000
(0.154) 0.10
(0.0003) 2000
(0.081) 0.06
(0.0001) 26000
(2.187) 0.27 (0.0052) Thalictrum
foliolosum - - - - 2000
(0.153) 0.09
(0.0002) 10500
(0.632) 0.25 (0.0037) -
Trifolium repens - - 10400
(0.109) 0.12
(0.0005) 7000
(0.282) 0.19
(0.0016) 8000
(0.195) 0.17
(0.0012) 48500
(0.704) 0.24 (0.0033) Viola betonicifolia 13000
(0.456) 0.25
(0.0037) - - - - - - - -
V. canescens - - 25200
(0.687) 0.25
(0.0038) - - - - - -
V. pilosa - - - - 17000
(0.368) 0.25
(0.0038) 19500
(0.205) 0.26
(0.0043) 10500
(0.176) 0.11 (0.0004) 315000
(8.723) 3.47
(0.0968) 464800
(16.079) 4.53
(0.0653) 224000
(90748.4) 4.14
(0.0806) 282500
(7.297) 3.92
(0.0895) 550500
(17.627) 4.70 (0.0426) Abbreviations: Nha-1 = stem density; G= total basal cover (m2ha-1) Η = Shannon-Wiener diversity index; Cd= Simpson concentration of dominance.
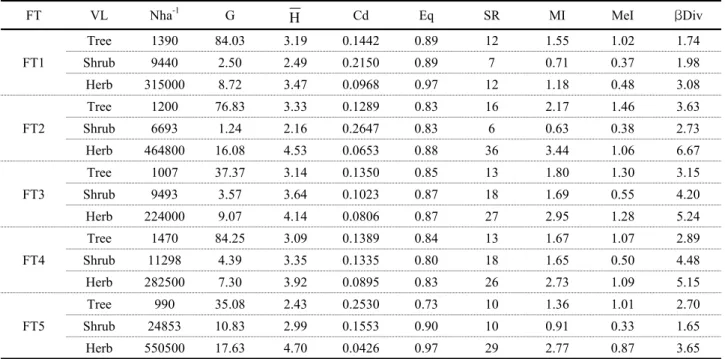
Table 5. Total values of phytosociological and diversity indices
FT VL Nha-1 G Η Cd Eq SR MI MeI βDiv
FT1
Tree 1390 84.03 3.19 0.1442 0.89 12 1.55 1.02 1.74
Shrub 9440 2.50 2.49 0.2150 0.89 7 0.71 0.37 1.98
Herb 315000 8.72 3.47 0.0968 0.97 12 1.18 0.48 3.08
FT2
Tree 1200 76.83 3.33 0.1289 0.83 16 2.17 1.46 3.63
Shrub 6693 1.24 2.16 0.2647 0.83 6 0.63 0.38 2.73
Herb 464800 16.08 4.53 0.0653 0.88 36 3.44 1.06 6.67
FT3
Tree 1007 37.37 3.14 0.1350 0.85 13 1.80 1.30 3.15
Shrub 9493 3.57 3.64 0.1023 0.87 18 1.69 0.55 4.20
Herb 224000 9.07 4.14 0.0806 0.87 27 2.95 1.28 5.24
FT4
Tree 1470 84.25 3.09 0.1389 0.84 13 1.67 1.07 2.89
Shrub 11298 4.39 3.35 0.1335 0.80 18 1.65 0.50 4.48
Herb 282500 7.30 3.92 0.0895 0.83 26 2.73 1.09 5.15
FT5
Tree 990 35.08 2.43 0.2530 0.73 10 1.36 1.01 2.70
Shrub 24853 10.83 2.99 0.1553 0.90 10 0.91 0.33 1.65
Herb 550500 17.63 4.70 0.0426 0.97 29 2.77 0.87 3.65
Abbreviations: VL= Vegetation layer; Nha-1= stem density; G= total basal cover (m2ha-1) Η = Shannon-Wiener diversity index;
Cd= Simpson concentration of dominance; Eq= Pielou equitability; SR= Species richness; MI= Margalef index of species richness; MeI= Menheink index of species richness; βDiv= Beta diversity.
distributed throughout the study area but showed varied values for phytosociological and diversity indices at different altitudes. Both species acted as associates of different tree species at various altitudes. Stem density, G, and Cd values of L. ovalifolia in the study area ranged from 40 to 130 Nha-1, 0.61 to 6.24 m2ha-1, 0.14 to 0.35 and 0.0007 to 0.0123, respectively. Whereas stem density, G, and Cd values of R. arboreum in the study area ranged from 40 to 165 Nha-1, 0.31 to 6.33 m2ha-1, 0.17 to 0.33 and 0.0012 to 0.0101, respectively. The results showed that both L.
ovalifolia and R. arboreum were well adapted to various altitudes and aspects, which helped them to flourish throughout the study area. Persea duthiei, Neolitsea pallens, Betula alnoides, Carpinus viminea, Daphniphyllum himalense, Pyrus pashia, and Persea odoratissima formed co-dominant flora at various altitudes in different proportions. Occurrence of these species almost in each forest type suggested their wider ecological amplitude.
There is wide variation in the range of Gof the tree species and values of G in the present study are best fitted with the earlier reported values for Uttarakhand Himalaya
(Table 6). The highest G (84.25 m2ha-1) was recorded between 1600 and 1900 masl, whereas lowest G (35.08 m2ha-1) was recorded between 1500 and 1650 masl.
However value of G for oak dominated forests of the study area were higher than the values recorded by Saxena and Singh (1982), Singh et al. (1994) and Kumar and Ram (2005) from Kumaun Himalaya and Ghildiyal et al. (1998), Baduni and Sharma (1999) and Sharma et al. (2001) from Garhwal Himalaya (Table 6). Generally in Quercus spp.
dominated forests of Uttarakhand Himalaya lots of anthro- pogenic disturbances like lopping, stem cutting, grazing, fuel wood collection, etc are prevalent. But in our study area these forests were protected and mature, which seems to have reached their higher limit of productivity. These could be the possible reasons for high G values in this forest. According to Saxena et al. (1978) the trees with higher G indicate the best performance of the species in a particular set of environmental conditions and lower G either demarcate the chance occurrence of the species or presence of the biotic disturbances in the past.
In the present investigation total stem density ranged