Vol. 29, No. 2, pp. 116-124, May, 2013 http://dx.doi.org/10.7747/JFS.2013.29.2.116
Stable Nitrogen Isotopes in a Forested Watershed in Taiwan
Jeffrey S. Owen*
Department of Biology, Kyung Hee University, Seoul 130-701, Republic of Korea
Abstract
Differences in rates and patterns of nitrogen cycling have been correlated with nitrogen stable isotope measurements in forest ecosystems of tropical and temperate regions, but limited similar work has been conducted in sub-tropical forests. This study investigated patterns in stable N isotopic composition in a subtropical forest in Taiwan by sampling three soil profiles and overstory and understory foliage. Soil δ15N in the forest floor ranged from -1.8 to 1.8‰. Mineral soils had higher δ15N (4.1 to 6.0‰). Foliage δ15N in overstory trees ranged from -6.6 to -2.0‰, and understory foliage δ15N ranged from -5.0 to -1.2‰. There was a weak correlation between foliar % N and δ15N (r2=0.214). Compared to results from similar surveys in tropical and temperate forests, foliar δ15N values were generally lower. These results help highlight the need for improved knowledge regarding the relationships between patterns in N stable isotopes and processes affecting rates of N cycling, especially as related to wider scale patterns in forest ecosystems within the east-Asia region.
Key Words: foliar 15N, forest soils, nitrogen, stable isotopes, Taiwan
Received: August 3, 2012. Revised: September 24, 2012. Accepted: October 9, 2012.
Corresponding author: Jeffrey S. Owen
Department of Biology, Kyung Hee University, Seoul 130-701, Republic of Korea Tel: 82-2-961-0666, Fax: 82-2-961-0244, E-mail: [email protected]
Introduction
Nitrogen is often a limiting nutrient in terrestrial ecosystems. In tropical forests, however, nitrogen is gen- erally considered to be relatively more available then in tem- perate forests (Vitousek 1984; Vitousek and Sanford 1986).
Interest in improving our understanding of the factors af- fecting rates of ecosystem N cycling among different eco- system types has become intensified by the recognition of possible deleterious effects of elevated N inputs to many types of ecosystems, including forests. Much attention has been focused on the possibility of “nitrogen saturation” in forested ecosystems, especially in North America (Aber et al. 1989; Stoddard 1994) and Europe (Skeffington 1990;
Gundersen et al. 1998). Some early studies indicated that
differences in hydrology and patterns in N cycling from those in watersheds in North America and Europe were re- sponsible for the differences in temporal patterns in stream chemistry found in several watersheds in Japan (Mitchell et al. 1997). Much more information about rates of N cycling from regions other than North America and Europe is still needed to increase our understanding of the variation in forest ecosystem nitrogen cycling processes among differ- ent forest types and regions.
An approach increasingly being used to help interpret patterns of N cycling in forest ecosystems is stable isotope analysis. Investigating forest soil profiles (changes with soil depth) is a simple method that has been used to compare among forest types or environments to provide some funda- mental insights into N cycling (Hogberg et al. 1996).
Surveys of soil and plant tissue 15N natural abundance can also be used to help understand nitrogen dynamics in forest ecosystems. Although some 15N data from tropical and sub-tropical forests are available (Yoneyama et al. 1993;
Piccolo et al. 1996; Kuang et al. 2010; Fang et al. 2011), most studies of this kind have been conducted in temperate regions. In this study I investigated patterns in δ15N natural abundance in soils and vegetation in a forested watershed in northeastern Taiwan. The objective of this study was to conduct a survey of 15N natural abundance of soils and veg- etation collected along a hillslope in a forested watershed in Taiwan.
Leaf nitrogen concentrations may vary based on either changes in nitrogen availability or intrinsic differences among growth forms (e.g. evergreen versus deciduous;
Aerts and Chapin 2000). Leaf nitrogen concentrations in turn are directly related to carbon assimilation rates (Evans 1989). As a result, leaf nitrogen concentration can indicate plant strategies for carbon acquisition and tissue turnover, with nitrogen concentration generally increasing in this or- der: evergreen species < forbs and graminoids < decid- uous species (Aerts and Chapin 2000).
Foliar δ15N values are known to be influenced by climate and moisture (Handley et al. 1999; Amundson et al. 2003).
Stable isotopes are a useful tool for evaluating soil nitrogen dynamics because isotope ratios record the net effect of iso- tope fractionation processes on a particular ecosystem pool.
Natural abundance nitrogen stable isotope measurements have been used to evaluate N cycling patterns (Nadelhoffer and Fry 1994; Emmett et al. 1998), to examine potential N sources to vegetation (Schmidt and Stewart 1997) and to determine types of plant and mycorrhizal associations (Michelsen et al. 1998). In a few studies, natural abun- dance of 15N of soil and foliage has been used to identify areas with higher rates of nitrification (Garten 1993;
Garten and Van Miegroet 1994; Emmett et al. 1998).
Several studies have suggested that among non-mycor- rhizal plants, VA (vesicular-arbuscular) plants are generally higher than in 15N than ectomycorrhizal plants (Michelsen et al. 1996; 1998; Schimdt and Stewart 1997). Hobbie et al.
(2000) reported that foliar N concentration and δ15N were correlated at nitrogen limited sites, and attributed this pat- tern to differences in plant and mycorrhizal interactions.
Using a modeling approach combined with a seedling ex-
periment, Hobbie and Colpaert (2003) showed that and the varying fraction of N retention through mycorrhizal activity can explain patterns between N availability and foliar δ15N.
Studies of nitrogen transformations in tropical forest soils have indicated that, generally, rates of nitrification and nitrogen mineralization are higher in tropical soils com- pared to temperate soils (Matson et al. 1987; Neill et al.
1995). One early study of nitrogen cycling in a subtropical rainforest identified a pattern of more rapid rates of ni- trification and nitrogen mineralization compared to tem- perate forests (Chandler and Goosem 1982). Later, Hiroto and Haibara (1994) used a laboratory incubation method to compare mineralization potentials at two slope positions in forest soils in Japan. They found that soil from lower ele- vation had higher mineralization rates and were positively correlated with total N concentration. Ohrui and Mitchell (1998) used a similar approach to compare amounts of in- organic N released from mineral soils in two Japanese forests. Their results indicated that higher nitrification rates occurred in near-stream areas compared to soils at a higher elevation.
Since there are fewer studies using stable isotopes in for- ests within the east-Asia region relative to the number of studies in tropical and temperate forests, I used data from tropical and temperate forests in other regions to compare with results from this study site. Overall, there is much evi- dence that there are differences in rates and patterns in N cy- cling between tropical and temperate forests. Because many N cycling processes result in isotopic fractionation, some predictable patterns in δ15N among components of forest ecosystem occur (Nadelhoffer and Fry 1994). Martinelli et al. (1999) used this approach to test the hypothesis that tropical forests, in general, contain N that is more enriched in 15N. This should occur because tropical forests are often characterized by comparatively open N cycles (larger inputs and outputs relative to internal N cycling). The mecha- nisms for N losses in forests leave the N remaining in the forest (soil and vegetation N pools) enriched in 15N. This hypothesis was supported using a broad survey of δ15N val- ues for vegetation and soils collected from many parts of the world. The results from Martinelli et al. (1999) offer addi- tional evidence regarding some fundamental differences between tropical and temperate forests. For this study, I was interested in whether a similar pattern could be found in a
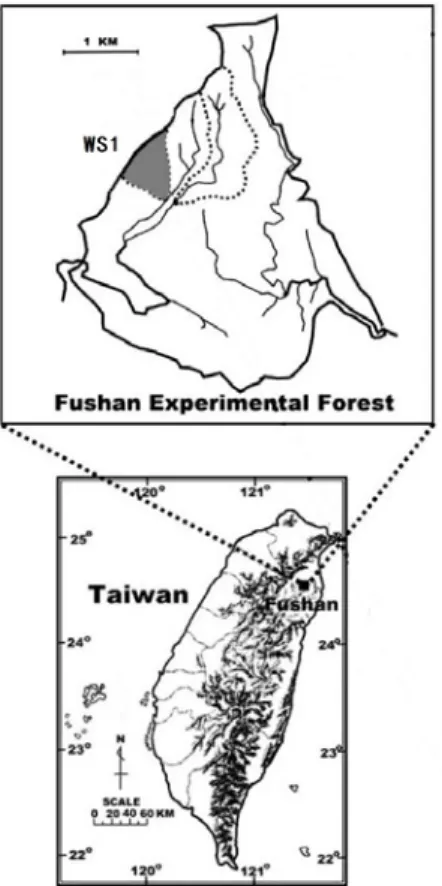
Fig. 1. Map showing the location of the Fushan Experimental Forest and the study watershed (WS1).
subtropical forest in Taiwan. This survey is among the first surveys of δ15N values for soil and vegetation for this sub- tropical forested watershed in northern Taiwan.
Materials and Methods
Study site
The Fushan Experimental Forest is located about 40 km southeast of Taipei, Taiwan (24o34'N 121o34'E; Fig. 1).
Fushan is a moist, subtropical, evergreen forest with a rich flora of over 500 species (Mabry et al. 1998). Soil and vege- tation samples for this study were collected from ex- perimental watershed 1 (WS1; area 37 ha). The underlying geology in WS1 is metamorphosed sedimentary rocks such as argillite and slate (Tang and Yang 1976). WS1 has a SE fac- ing aspect and elevation ranges from about 670 to 1,100 m.
Dominant tree species in the study area include Castanopsis carlesii (Helmsl.) Hayata, Litsea acuminata (Blume) Kurata, and Diospyros morrisiana Hance. Common understory
plants are Lasianthus microstachys Hayata, Helicia formosana Lour, Alsophila podophylla Hook, and Blastus cochinchinensis Lour. Mean annual precipitation is about 4,000 mm and mean annual temperature is 18.2oC (Hsia and Hwong 1999). Soil surveys have indicated that Ultisols and Inceptisols are the most common soil types within the wa- tershed (Lin et al. 1996).
Sampling and analysis
Three hillslope locations were selected and soil pits were excavated by hand to a depth approaching 100 cm. Mineral horizons were sampled at 10 cm intervals, sieved (2 mm), and oven-dried (60oC) prior to analysis. Two rock speci- mens were also collected from the lower mineral soil, cleaned with deionized water, dried, and pulverized for iso- tope analysis. At each location, a 10x10 cm sample of the lit- ter layer was also collected. Foliage samples were collected from the middle third of the tree canopy in dominant tree species in the immediate area adjacent to each soil pit.
Leaves from two or three twigs containing green foliage without visible insect damage were combined for each sample. Understory foliage was sampled in a similar man- ner from two to four randomly clipped branches or bracts and composited. Foliage samples were oven-dried (60oC) and pulverized to a fine mesh with a dental amalgamator device prior to analysis.
Elemental and stable isotopic composition was de- termined using a Finnigan Delta-Plus isotope ratio mass spectrometer interfaced to an elemental analyzer. Typical precision for duplicate isotopic analyses was 0.2‰. The iso- topic composition of a sample is expressed using the stand- ard notation as a difference from a standard: δ15N (‰)=[Rsample/Rstandard-1]x1,000. R refers to the ratio of the heavy to the light isotope. Linear regression and correlation were used to examine relationships between N concen- tration and stable isotope composition. All statistical analy- ses were conducted using SAS v9 (SAS Institute, Cary, NC, USA).
Results
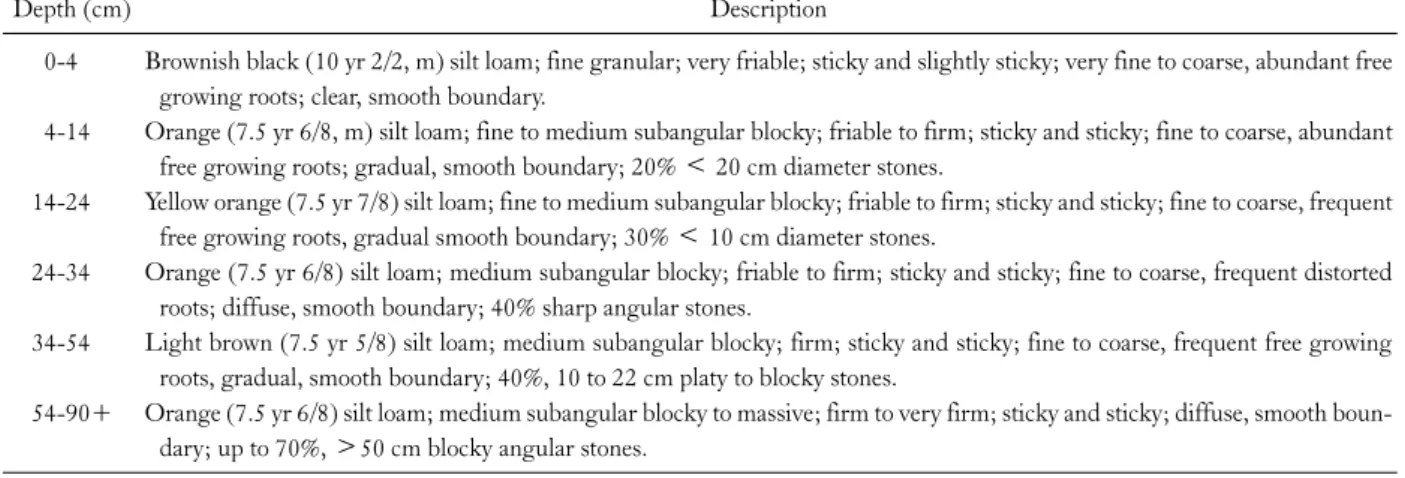
Descriptive soil characteristics for WS1 are shown in Table 1. Some additional information on soils in WS1 is given in Lin et al. (1996) and Owen et al. (2003). Soil N
Table 1. Soil description in WS1 at the Fushan Experimental Forest
Depth (cm) Description
0-4
4-14
14-24
24-34
34-54
54-90+
Brownish black (10 yr 2/2, m) silt loam; fine granular; very friable; sticky and slightly sticky; very fine to coarse, abundant free growing roots; clear, smooth boundary.
Orange (7.5 yr 6/8, m) silt loam; fine to medium subangular blocky; friable to firm; sticky and sticky; fine to coarse, abundant free growing roots; gradual, smooth boundary; 20% < 20 cm diameter stones.
Yellow orange (7.5 yr 7/8) silt loam; fine to medium subangular blocky; friable to firm; sticky and sticky; fine to coarse, frequent free growing roots, gradual smooth boundary; 30% < 10 cm diameter stones.
Orange (7.5 yr 6/8) silt loam; medium subangular blocky; friable to firm; sticky and sticky; fine to coarse, frequent distorted roots; diffuse, smooth boundary; 40% sharp angular stones.
Light brown (7.5 yr 5/8) silt loam; medium subangular blocky; firm; sticky and sticky; fine to coarse, frequent free growing roots, gradual, smooth boundary; 40%, 10 to 22 cm platy to blocky stones.
Orange (7.5 yr 6/8) silt loam; medium subangular blocky to massive; firm to very firm; sticky and sticky; diffuse, smooth boun- dary; up to 70%, >50 cm blocky angular stones.
Fig. 2. Soil δ15N and N concentration profiles at 3 sampling locations in Fushan Experimental Forest WS1.
concentration in the forest floor was lowest at the middle hillslope location and ranged from 0.80 to 1.86% N (Fig.
2). In mineral soil horizons, soil N concentrations did not change notably with depth or among the three soil profiles and ranged from 0.11 to 0.83% N. Soil δ15N profiles showed a sharp increase below the litter horizon at each location (Fig.
2). δ15N of the two rock samples were similar (2.5 and 2.
4‰). The range for δ15N values in the litter horizon was from -1.8 to 1.8‰. For mineral soils, higher δ15N values were found (4.2 to 6.0‰). Below the litter horizon, δ15N values changed little with depth at all sampling locations.
There was a significant relationship between soil N con-
centration and soil δ15N value at each of the hillslope locations. The best fit regression lines for the three soil pro- files were δ15Nsoil=-4.275 [% Nsoil]+6.668 (r2=0.8592, p
<0.001); δ15Nsoil=-5.858 [% Nsoil]+6.445 (r2=0.8512, p
<0.001); and δ15Nsoil=-4.345 [% Nsoil]+6.559 (r2= 0.9819, p<0.001) for the upper, middle, and lower loca- tions, respectively.
Overall, foliar % N and δ15N were weakly correlated (r2=0.214, p=0.0347; Fig. 3). If non-mycorrhizal H. for- mosana was not considered, the correlation for all plants in- creased (r2=0.360, p=0.0052). For understory and sub- canopy plants, the relationship was non-significant (r2=0.315, p=0.116; Fig. 3). Foliar N concentration in overstory plants varied from 1.3% to 1.7% N and foliar N concentrations in understory plants ranged from 1.7 to 3.4% N. However, the N concentration in one non- mycorrhizal understory plant (H. formosana) in the Proteaceae showed the lowest N concentration (1.3% N).
Understory plants in the Urticaceae had foliar N concen- trations over 3% N (Table 2).
Foliage δ15N values for overstory trees ranged from -6.6 to -2.0‰, and understory foliage δ15N values ranged from -5.0 to -1.9‰ (Table 2). Foliar δ15N values of both groups were not significantly different at the three hillslope locations. Interestingly, understory plants near the lowest and highest foliar N concentrations all showed high δ15N values, with plants in the Urticaceae having high N concen- trations and the Proteaceae specimen having low foliar N concentration.
Fig. 3. Relationship between foliar δ15N and N concentration in Fushan Experimental Forest WS1. The equation for the best-fit line is δ15N=
1.3025 (%N)- 6.169 (r2=0.214, n=20).
Table 2. Plant δ15N, %N and mycorrhizal type by hillslope location in WS1
Location Strata Species Family Type δ15Nplant %N
Lower
Middle
Upper
Understory Understory Overstory Overstory Overstory Overstory Overstory Understory Subcanopy Subcanopy Subcanopy Overstory Overstory Understory Understory Understory Subcanopy Overstory Overstory Overstory Overstory
Pellionia radicans Pellionia radicans Meliosma squamulata Tutcheria shinkoensis Cyclobalanopsis glauca Tutcheria shinkoensis Engelhardtia roxburghiana Lasianthus microstachys Helicia formosana Blastus cochinchinensis Stauntonia hexaphylla Tutcheria shinkoensis Listea acuminata Lasianthus microstachys Astronia ferruginea Lasianthus japonicus Blastus cochinchinensis Listea acuminata Listea acuminata Litsea acuminata Cryptocarya chinenisis
Urticaceae Urticaceae Sabiaceae Theasceae Fagaceae Theasceae Juglandaceae Rubiaceae Proteaceae Melastomataceae Lardizabalaceae Theasceae Lauraceae Rubiaceae Melastomataceae Rubiaceae Melastomataceae Lauraceae Lauraceae Lauraceae Lauraceae
VA/Non VA/Non
VA Ecto/VA
Ecto Ecto/VA
VA VA Non
VA VA Ecto/VA
VA VA Ecto/VA
VA Ecto/VA
VA VA VA VA
-2.6 -1.9 -4.3 -4.8 -3.4 -4.6 -2.0 -2.4 -1.2 -3.5 -5.0 -3.2 -6.0 -3.9 -3.7 -2.7 -2.6 -6.6 -6.2 -6.6 -4.0
3.40 3.06 1.25 1.48 1.72 1.55 1.67 1.91 1.27 1.92 1.71 1.25 1.34 2.15 1.61 2.15 1.84 1.28 1.40 1.45 1.71
Discussion
Forest soil profiles often show a general trend of increas- ing δ15N with depth; this trend has been observed in many forest soils throughout the world (Hogberg et al. 1996).
This pattern results from several processes involving iso-
topic fractionation during nitrogen cycling, leading to plant uptake of N that is depleted in 15N, and because of internal N cycling through mycorrhizal fungi that also results in the transfer of N that is depleted in 15N to host plants (Hobbie et al. 2000; Hobbie and Ouimette 2009). Both of these mechanisms results in the transfer of N which is depleted in
15N to the soil surface via litterfall. Thus, for nitrogen, plants are nearly always isotopically lighter than the soil supporting their growth (Nadelhoffer and Fry 1994).
Isotopic fractionation during decomposition, soil food web processing, and denitrification also contribute to this pat- tern (Hobbie and Ouimette 2009).
The results for WS1 showed that N concentration in one non-mycorrhizal understory plant (H. formosana) in the Proteaceae had the lowest N concentration (1.3% N).
Understory plants (Urticaceae) had foliar N concentrations over 3% N (Table 2). Members of the Proteaceae are gen- erally non-mycorrhizal and adapted to nutrient poor hab- itats (Diaz 1996). For example, Schimdt and Stewart (1997) reported that non-mycorrhizal Proteaceae had high- er δ15N values than mycorrhizal species in Australian heathlands.
Table 3. Enrichment factors (EF=δ15Nplant-δ15Nsoil) reported from selected studies on 15N natural abundance in vegetation and soils in North America and Europe
Site Description EF min EF max Reference
GSMNP Sweden NITREX sites Fu-shan WS1 Fu-shan WS1 Fu-shan WS1
Mixed Conifer Mixed Upper Middle Lower
-7.9 -3.6 -8.0 -11.9 -11.9 -9.5
-5.8
0.0
-1.2 -9.3 -9.1 -6.7
Garten, 1993 Näsholm et al. 1997 Emmett et al. 1998 This study This study This study
Several earlier studies of soil and vegetation natural abundance 15N in forests used “enrichment factors” (EF=
δ15Nplant - δ15Nsoil) to help reduce the uncertainty resulting from spatial variability observed for soil and tissue δ15N values (Marrioti et al. 1981; Garten and Van Miegroet 1994; Näsholm et al. 1997). Enrichment factors have been shown to be positively correlated with rates of net N miner- alization and nitrification (Garten and Van Miegroet 1994) and can be useful indicators of N supply (Näsholm et al.
1997). Enrichment factors in WS1 were generally more negative than those reported for temperate forested sites (Table 3). This finding indicates that there is a larger differ- ence between δ15Nplant and δ15Nsoil in WS1 compared to re- sults from studies in several temperate forests (Garten 1993; Näsholm et al. 1997; Emmett et al. 1998). Though additional research will be needed to identify the N cycling mechanisms that result in the larger difference between plant and soil N stable isotope composition, this difference might be related to processes leading to N losses, such as gaseous losses through denitrification or export of dissolved inorganic and organic nitrogen via groundwater and sur- face waters (Houlton et al. 2006). In some watersheds, es- pecially where N-rich sedimentary bedrock occurs, rock- derived N is an important component of N cycling (Holloway and Dahlgren 1999). Some areas of Taiwan con- tain sedimentary bedrock and ascertaining the role of un- derlying geology in watershed N cycling should be a focus of future work. The results included here for rock δ15N in WS1 are some of the first available for rock δ15N in north- ern Taiwan (Yui et al. 2009). Though the number of sam- ples was limited, rock δ15N in WS1 (2.5‰) was higher than mineral soil δ15N (4.2 to 6.0‰), suggesting the possi- bility than loss of N during rock weathering occurs with a systematic trend in N isotopic composition.
Some earlier studies showed that rates of microbial N transformations may be related to stable N isotope compo- sition of soils (Garten 1993; Hogberg et al. 1996).
Topographic position may affect the rates of many microbial processes in soils and thereby affect soil and foliar δ15N values. For example, nitrification rates in soils are influ- enced by temperature, moisture, and nitrate concentration (Binkley and Hart 1989). During nitrification, the remain- ing ammonium should become enriched in 15N and the ni- trate produced depleted in 15N (Hogberg et al. 1996).
Relative to ammonium, nitrate is more easily leached from soils, though NH4 concentrations in soil solution in WS1 are often undetectable (Owen, unpublished data). Average soil solution NO3 concentrations at 15 cm depth were 11 μmol N/L and about 25 μmol N/L at 50 cm depth, rang- ing from 2 to 49 μmol N/L (Owen, unpublished data).
Since the earlier studies mentioned above, more recent approaches to understanding large-scale patterns in plant and soil δ15N and modeling the distribution of N stable iso- topes have utilized a steady state approach (Handley et al.
1999; Amundson et al. 2003). This approach relies on the concept that the soil total N pool is at a steady-state; the iso- topic composition of the inputs and outputs determines the isotopic composition of the soil N pool. In steeply sloping and highly dissected terrain, which is a common landscape feature in Taiwan (Meybeck et al. 2001), further research should be directed towards a better understanding of pat- terns in soil and plant N stable isotope composition to test whether the steady state model applies to steeply sloped wa- tersheds subject to disturbance such as landslides, typhoons and earthquakes.
Where studies have shown net rates of N mineralization and nitrification to vary among hillslope positions in forest soils, higher rates occurred at footslope locations (Hiroto
and Haibara 1994; Koba et al. 1998). In WS1, there is little evidence to suggest that net nitrification rates are different at the higher and lower elevation sites (Owen et al. 2010).
Thus differences in net nitrification and mineralization rates seem unlikely to be related to patterns in foliar δ15N in WS1.
More information about stable isotopic composition of specific forms of N would be useful to better understand patterns in N cycling in forests in east-Asia (Hobbie and Colpaert 2003). The limited data available (Koba et al.
1998; 2010) suggest that measurements of the isotopic composition in both soil extractable pools and soil solution NO3 and NH4 could contribute to understanding regional differences in rates and patterns in N cycling. Currently there are no measurements of the N stable isotope composi- tion of atmospheric inputs, soil solution or denitrification products available for forests in Taiwan. Work by Houlton et al. (2006) used stable N isotope measurements to high- light the magnitude of denitrification losses in affecting the distribution of δ15N in tropical forests. In WS1, the influ- ence of N losses via denitrification is not yet known, but the similarity in foliar and soil δ15N values among the three hillslope locations is consistent with other studies in WS1 indicating that rates of soil microbial processes such as N mineralization and nitrification did not vary greatly be- tween upper and lower locations in the watershed (Owen et al. 2010).
Conclusion
In summary, these results for soil and vegetation stable N isotopic composition from this subtropical forest in Taiwan are consistent with data from other forest ecosystems.
Isotopic patterns in this subtropical forest seem to conform more closely to patterns in temperate forest than to patterns in tropical systems. The results of this study show that δ15N of total soil N in the three hillslope locations did not vary greatly among the profiles. Understory and overstory foli- age δ15N showed generally few differences between the lower and upper hillslope location. Additional research on the relationships between inorganic and organic N avail- ability, mycorrhizal-plant N cycling, and N stable isotope composition will be necessary to increase our under- standing of patterns in N cycling in this watershed in addi-
tion to expand our range of regional patterns in east-Asia.
Processes that deserve intensive study for understanding N cycling in subtropical forests in Taiwan and the east-Asia region include the influence of disturbances such as land- slides, typhoons, and earthquakes, rates of N-fixation, N export to surface and groundwater, and N losses via denitrification.
Acknowledgements
The excellent assistance from the Watershed Manage- ment Division of the Taiwan Forestry Research Institute staff while working at Fushan Experimental Forest is great- ly appreciated. Advice and guidance from E. Hobbie with stable isotope analysis is appreciated. This work was sup- ported by a grant from Kyung Hee University in 2011 (20110682).
References
Aber JD, Nadelhoffer KJ, Steudler PA, Melillo JM. 1989.
Nitrogen saturation in northern forest ecosystems. Bioscience 39: 378-386.
Aerts R, Chapin FS III. 2000. The mineral nutrition of wild plants revisited: A re-evaluation of processes and patterns. Adv Ecol Res 30: 1-67.
Amundson R, Austin AT, Schuur EAG, Yoo K, Matzek V, Kendall C, Uebersax A, Brenner D, Baisden WT. 2003. Global patterns of the isotopic composition of soil and plant nitrogen. Global Biogeochem Cycles 17: 1031.
Binkley D, Hart SC. 1989. The components of nitrogen avail- ability assessments in forest soils. Adv Soil Sci 10: 57-112.
Chandler G, Goosem S. 1982. Aspects of rainforest regeneration.
III. The interaction of phenols, light, and nutrients. New Phytol 92: 369-380.
Diaz S. 1996. Effects of elevated [CO2] at the community level mediated by root symbionts. Plant Soil 187: 309-320.
Emmett BA, Kjonaas OJ, Gundersen P, Koopmans C, Tietema A, Sleep D. 1998. Natural abundance of 15N in forests across a ni- trogen deposition gradient. For Ecol Manage 101: 9-18.
Evans JR. 1989. Photosynthesis and nitrogen relationships in leaves of C3 plants. Oecologia 78: 9-19.
Fang YT, Yoh M, Koba K, Zhu WX, Takebayashi Y, Xiao YH, Mo JM, Zhang W, Lu XK. 2011. Nitrogen deposition and ni- trogen cycling along an urban-rural transect in southern China.
Global Change Biol 17: 872-885.
Garten C. 1993. Variation in foliar 15N abundance and the avail- ability of soil nitrogen on Walker Branch watershed. Ecology 74:
2098-2113.
Garten C, Van Miegroet H. 1994. Relationships between soil nitro- gen dynamics and natural abundance 15N in plant foliage from Great Smoky Mountains National Park. Can J For Res 24:
1636-1645.
Gundersen P, Emmett BA, Kjønaas OJ, Koopmans C, Tietema A.
1998. Impacts of nitrogen deposition of nitrogen cycling in for- ests:a synthesis of NITREX data. For Ecol Manag 101: 37-55.
Handley LL, Austin AT, Robinson D, Scrimgeour CM, Raven JA, Heaton THE, Schmidt S, Stewart GR. 1999. The natural abundance of ecosystem samples reflects measures of water availability. Aust J Plant Physiol 26: 185-199.
Hiroto T, Haibara K. 1994. Kinetics of mineralization of nitrogen in forest soil (I): Characteristics of soil nitrogen mineralization of different aged stands, slope positions, and soil depths. J Jpn For Soc 76: 144-151 (in Japanese).
Hobbie EA, Colpaert JV. 2003. Nitrogen availability and colo- nization by mycorrhizal fungi correlate with nitrogen isotope patterns in plants. New Phytologist 157: 115-126.
Hobbie EA, Ouimette AP. 2009. Controls of nitrogen isotope pat- terns in soil profiles. Biogeochemistry 95: 355-371.
Hobbie EA, Macko SA, Williams MT. 2000. Correlations be- tween foliar δ15N and nitrogen concentrations may indicate plant-mycorrhizal interactions. Oecologia 122: 273-283.
Hogberg P, Hogbom L, Schinkel H, Hogberg M, Johannisson C, Wallmark H. 1996. 15N abundance of surface soils, roots and mycorrhizas in profiles of European forest soils. Oecologia 108:
207-214.
Holloway JM, Dahlgren R. 1999. Geological nitrogen in terrestrial biogeochemical cycling. Geology 27: 567-570.
Houlton BZ, Sigman DM, Hedin LO. 2006. Isotopic evidence for large gaseous nitrogen losses from tropical rainforests. Proc Nat Acad Sci 103: 8745-8750.
Hsia YJ, Hwong JL. 1999. Hydrological characteristics of Fushan Experimental Forest. Quart J Chin For 32: 39-51.
Koba K, Tokuchi N, Yoshioka T, Hobbie EA, Iwatsubo G. 1998.
Natural abundance of nitrogen-15 in a forest soil. Soil Sci Soc Amer J 62: 778-781.
Koba K, Isobe K, Takebayashi Y, Fang YT, Sasaki Y, Saito W, Yoh M, Mo J, Liu L, Lu X, Zhang T, Zhang W, Senoo K. 2010. 15N of soil N and plants in a N-saturated, subtropical forest of south- ern China. Rapid Comm Mass Spectrom 24: 2499-2506.
Kuang YW, Wen DZ, Li J, Sun FF, Hou EQ, Zhou GY, Zhang DQ, Huang LB. 2010. Homogeneity of δ15N in needles of Masson pine (Pinus massoniana L.) was altered by air pollution.
Environ Pollut 158: 1963-1967.
Lin KC, Horng FW, Cheng WE, Chiang HC, Chang UC. 1996.
Soil survey and classification of the Fushan Experimental Forest. Taiwan J For Sci 11: 159-174.
Mabry C, Hamburg SP, Lin TC, Horng FW, King HB, Hsia YJ.
1998. Typhoon disturbance and stand-level damage patterns at a subtropical forest in Taiwan. Biotropica 30: 238-250.
Mariotti A, Germon JC, Hubert P, Kaiser P, Letolle R, Tardieux A,
Tardieux P. 1981. Experimental determination of nitrogen ki- netic isotope fractionation: some principles; illustration for the denitrification and nitrification processes. Plant Soil 62: 423-430.
Martinelli LA, Piccolo MC, Townsend AR, Vitousek PM, Cuevas E, McDowell W, Robertson GP, Santos OC, Treseder K. 1999.
Nitrogen stable isotopic composition of leaves and soil: Tropical versus temperate forests. Biogeochemistry 46: 45-65.
Matson PM, Vitousek PM, Ewel JJ, Mazzarino MJ, Robertson GP. 1987. Nitrogen transformations and nitrous oxide flux in tropical ecosystems. Global Biogeochem Cycl 1: 163-170.
Meybeck M, Green P, Vörösmarty C. 2001. A new typology for mountains and other relief classes. Moun Res Dev 21: 34-45.
Michelsen A, Schmidt IK, Jonasson S, Quarmby C, Sleep D.
1996. Leaf 15N abundance of subarctic plants provides field evi- dence that ericoid, ectomycorrhizal and non- and arbuscular mycorrhizal species access different sources of soil nitrogen.
Oecologia 105: 53-63.
Michelsen A, Quarmby C, Sleep D, Jonasson S. 1998. Vascular plant 15N natural abundance in heath and forest tundra ecosys- tems is closely correlated with presence and type of mycorrhizal fungi in roots. Oceologia 115: 406-418.
Mitchell MJ, Iwatsubo G, Ohrui K, Nakagawa Y. 1997. Nitrogen saturation in Japanese forests: an evaluation. For Ecol Manage 97: 39-51.
Nadelhoffer K, Fry B. 1994. Nitrogen isotope studies in forest ecosystems. In: Stable isotopes in ecology and environmental science (Lajtha K, Michener RH, eds). Blackwell Scientific Publications, Oxford, pp 22-44.
Näsholm T, Nordin A, Edfast AB, Högberg P. 1997. Identification of coniferous forests with incipient nitrogen saturation through analysis of arginine and nitrogen-15 abundance of trees. J Environ Qual 26: 302-309.
Neill CM, Piccolo MC, Steudler PA, Melillo JM, Feigl BJ, Cerri CC. 1995. Nitrogen dynamics in soils of forests and active pas- tures in the western Brazilian Amazon basin. Soil Biol Biochem 27: 1167-1175.
Ohrui K, Mitchell MJ. 1998. Spatial patterns of soil nitrate in Japanese forested watersheds: importance of the near-stream zone as a source of nitrate in stream water. Hydrol Proc 12:
1433-1445.
Owen JS, King HB, Wang MK, Sun HL. 2010. Net nitrogen mineralization and nitrification rates in forest soil in northeast- ern Taiwan. Soil Sci Plant Nutr 56: 177-185.
Owen JS, Wang MK, Wang CH, King HB, Sun HL. 2003. Net N mineralization and nitrification rates in a forested ecosystem in northeastern Taiwan. For Ecol Manage 176: 519-530.
Piccolo MC, Neill C, Melillo JM, Cerri CC, Steudler PA. 1996.
15N natural abundance in forest and pasture soil of the Brazilian Amazon basin. Plant Soil 182: 249-258.
Schimdt S, Stewart GR. 1997. Waterlogging and fire impacts on nitrogen availability and utilization in a subtropical wet heath- land (wallum). Plant Cell Env 20: 1231-1241.
Skeffington RA. 1990. Accelerated nitrogen inputs-A new problem or a new perspective? Plant Soil 128: 1-11.
Stoddard JL. 1994. Long-term changes in watershed retention of nitrogen, its causes and aquatic consequences. In:
Environmental Chemistry of Lakes and Reservoirs (Baker LA, ed). American Chemical Society, Washington, DC, pp 223-284.
Tang CH, Yang CY. 1976. Mid-tertiary stratigraphic break in the northeast Hsuehshan Range of Taiwan. Petroleum Geology of Taiwan 13: 139-147.
Vitousek PM. 1984. Litterfall, nutrient cycling, and nutrient limi-
tation in tropical forests. Ecology 65: 285-298.
Vitousek PM, Sanford R. 1986. Nutrient cycling in moist tropical forest. Ann Rev Ecol Syst 17: 137-167.
Yoneyama T, Muraoka T, Murakami T, Boonkerd N. 1993.
Natural abundance of 15N in tropical plants with an emphasis on tree legumes. Plant Soil 153: 295-304.
Yui FY, Kao SJ, Wu TW. 2009. Nitrogen and N-isotope variation during low-grade metamorphism of the Taiwan mountain belt.
Geochemical J 43: 15-27.