CLINICAL RESEARCH Interventional Cardiology
Comparison of Zotarolimus-Eluting Stents
With Sirolimus- and Paclitaxel-Eluting Stents for Coronary Revascularization
The ZEST (Comparison of the Efficacy and
Safety of Zotarolimus-Eluting Stent with Sirolimus-Eluting and PacliTaxel-Eluting Stent for Coronary Lesions) Randomized Trial
Duk-Woo Park, MD,* Young-Hak Kim, MD,* Sung-Cheol Yun, P H D,*† Soo-Jin Kang, MD,*
Seung-Whan Lee, MD,* Cheol-Whan Lee, MD,* Seong-Wook Park, MD,* In-Whan Seong, MD,‡
Jae-Hwan Lee, MD,‡ Seung-Jea Tahk, MD,§ Myung-Ho Jeong, MD,储 Yangsoo Jang, MD,¶
Sang-Sig Cheong, MD,# Joo-Young Yang, MD,** Do-Sun Lim, MD,†† Ki-Bae Seung, MD,‡‡
Jei-Keon Chae, MD,§§ Seung-Ho Hur, MD,储储 Sang-Gon Lee, MD,¶¶ Junghan Yoon, MD,##
Nae-Hee Lee, MD,*** Young-Jin Choi, MD,††† Hyun-Sook Kim, MD,††† Kee-Sik Kim, MD,‡‡‡
Hyo-Soo Kim, MD,§§§ Taeg-Jong Hong, MD,储储储 Hun-Sik Park, MD,¶¶¶ Seung-Jung Park, MD*
Seoul, Daejeon, Suwon, Gwangju, GangNeung, Ilsan, Jeonju, Daegu, Ulsan, Wonju, Bucheon, Anyang, and Pusan, Korea
Objectives The aim of this study was to evaluate the relative efficacy and safety of zotarolimus-eluting stents (ZES) in com- parison with the established and widely used sirolimus- (SES) and paclitaxel-eluting stents (PES) in routine clinical practice.
Background Whether ZES might provide similar clinical and angiographic outcomes in a broad spectrum of patients com- pared with SES or PES is undetermined.
Methods We performed a single-blind, multicenter, prospectively randomized trial to compare ZES with SES and PES in 2,645 patients undergoing percutaneous coronary intervention. The primary end point was a composite of major adverse cardiac events (MACE) (death, myocardial infarction, and ischemia-driven target vessel revasculariza- tion) at 12 months. A noninferiority comparison (ZES vs. SES) and a superiority comparison (ZES vs. PES) were performed for the primary end point.
Results Baseline clinical and angiographic characteristics were similar in the 3 groups. At 12 months, the ZES group showed noninferior rates of MACE compared with the SES group (10.2% vs. 8.3%, p for noninferiority ⫽ 0.01, p for superiority ⫽ 0.17) and significantly fewer MACE than the PES group (10.2% vs. 14.1%, p for superiority ⫽ 0.01). The incidence of death or myocardial infarction was similar among the groups (ZES vs. SES vs. PES, 5.8%
vs. 6.9% vs. 7.6%, respectively, p ⫽ 0.31). The incidence of stent thrombosis was significantly lower in the SES group (ZES vs. SES vs. PES, 0.7% vs. 0% vs. 0.8%, respectively, p ⫽ 0.02).
Conclusions In this large-scale, practical randomized trial, the use of ZES resulted in similar rates of MACE compared with SES and in fewer MACE compared with PES at 12 months. (Comparison of the Efficacy and the Safety of Zotarolimus-Eluting Stent Versus Sirolimus-Eluting Stent and PacliTaxel-Eluting Stent for Coronary Lesions; NCT00418067) (J Am Coll Cardiol 2010;56:1187–95) © 2010 by the American College of Cardiology Foundation
From the *Department of Cardiology, Center for Medical Research and Information, University of Ulsan College of Medicine, Asan Medical Center, Seoul, Korea;
†Division of Biostatistics, Center for Medical Research and Information, University of Ulsan College of Medicine, Asan Medical Center, Seoul, Korea; ‡Chungnam National University Hospital, Daejeon, Korea; §Ajou University Medical Center,
Suwon, Korea;储Chonnam National University Hospital, Gwangju, Korea; ¶Yonsei University Severance Hospital, Seoul, Korea; #GangNeung Asan Medical Center, GangNeung, Korea; **NHIC Ilsan Hospital, Ilsan, Korea; ††Korea University Medical College, Seoul, Korea; ‡‡Catholic University of Korea, St. Mary’s Hospital, Seoul, Korea; §§Chonbuk National University Hospital, Jeonju, Korea;储 储Keimyung
The 2 polymer-based drug-eluting stents (DES) approved by the U.S.
Food and Drug Administration—
sirolimus-eluting stents (SES) and paclitaxel-eluting stents (PES)—
have reduced angiographic reste- nosis and the need for repeat revascularization compared with bare-metal stents (BMS) (1–3).
On the basis of the results of pivotal clinical trials, these DES have been widely used for percu- taneous coronary intervention (PCI) in daily practice, including more complex clinical and ana- tomic subsets (4). However, the long-term safety of the 2 DES has been questioned by recent studies, which have reported increased rates of late stent thrombosis and late-occurring death or myocardial infarction (MI) compared with BMS (5,6).
The zotarolimus-eluting stent (ZES) is a newer DES using zotarolimus, a synthetic analog of sirolimus with a similar mechanism of action and a biocompatible phospho- rylcholine polymer, coated onto a low-profile, thin-strut, cobalt-alloy stent (7). Despite the marked benefit of ZES compared with BMS (8), there are currently limited data comparing ZES with the established and widely used SES and PES in routine clinical practice. We therefore con- ducted a randomized, controlled trial to compare the relative efficacy and safety of ZES with SES and PES in patients undergoing PCI.
Methods
Study design and population. The ZEST (Comparison of the Efficacy and Safety of Zotarolimus-Eluting Stent with
Sirolimus-Eluting and PacliTaxel-Eluting Stent for Coro- nary Lesions) trial was a prospective, randomized, single- blind, controlled study conducted in 19 centers in Korea between October 2006 and January 2008. The study pro- tocol was approved by the ethics committee at each partic- ipating center and was conducted according to the principles of the Declaration of Helsinki. All patients provided writ- ten, informed consent for participation in this trial. The sponsor of this study contributed to study design but had no role in data collection, monitoring, analysis, interpretation, or in the writing of the manuscript.
We sought to enroll consecutive patients age 18 years or older with either stable angina or acute coronary syndromes who had at least 1 coronary lesion (defined as stenosis of more than 50%) suitable for stent implantation. There were no limitations on the number of lesions or vessels or on the length of the lesions, reflecting routine clinical practice.
Exclusion criteria were ST-segment elevation MI necessi- tating primary PCI; severely compromised ventricular dys- function (ejection fraction ⬍25%) or cardiogenic shock;
allergy to antiplatelet drugs, heparin, stainless steel, contrast agents, zotarolimus, sirolimus, or paclitaxel; left main cor- onary artery disease (defined as stenosis of more than 50%);
in-stent restenosis of drug-eluting stents; terminal illness;
and participation in another coronary-device study.
Randomization, procedures, and adjunct drug therapy.
Randomization was performed after diagnostic angiography and before PCI. Eligible patients were randomly assigned on a 1:1:1 basis to treatment with ZES (Endeavor, Medtronic Vascular, Santa Rosa, California), SES (Cypher select, Cordis, Johnson & Johnson, Miami Lakes, Florida), or PES (Taxus Liberte, Boston Scientific, Natick, Massa- chusetts) by means of an interactive web response system.
The allocation sequence was computer-generated, stratified according to participating center and the presence or ab- sence of diabetes mellitus and diffuse long lesions (lesion length more than 28 mm by visual estimate), and blocked with block sizes of 6 and 9 varying randomly.
The PCI was performed according to standard tech- niques. The same randomly assigned stent had to be implanted in all lesions in patients requiring multi-lesion interventions, except when the assigned stent could not be inserted, in which case crossover to another device was allowed.
Before or during the procedure, all patients received at least 100 mg of aspirin and a 300- to 600-mg loading dose of clopidogrel. Heparin was administered throughout the procedure to maintain an activated clotting time of 250 s or longer. Administration of glycoprotein IIb/IIIa inhibitors was at the discretion of the operator. After the procedure, all patients received 100 mg/day of aspirin indefinitely as well as 75 mg/day clopidogrel for at least 12 months.
Patient follow-up and data management. Adverse events were assessed in the hospital and at 30 days and 4, 9, and 12 months. All eligible patients were asked to return for an
University Dongsan Medical Center, Daegu, Korea; ¶¶Ulsan University Hospital, Ulsan, Korea; ##Yonsei University Wonju Christian Hospital, Wonju, Korea;
***Soonchunhyang University Bucheon Hospital, Bucheon, Korea; †††Hallym Uni- versity Sacred Heart Hospital, Anyang, Korea; ‡‡‡Daegu Catholic University Medical Center, Daegu, Korea; §§§Seoul National University Hospital, Seoul, Korea;
储 储 储Pusan National University Hospital, Pusan, Korea; and the ¶¶¶Kyung Pook National University Hospital, Daegu, Korea. This study was supported by funds from the CardioVascular Research Foundation, Seoul, Korea, and Medtronic Vascular, Santa Rosa, California. Dr. S. J. Park reports receiving consulting fees from Cordis, lecture fees from Cordis, Medtronic, and Boston Scientific, and research grant support from Cordis and Medtronic. Dr. Y. H. Kim reports receiving lecture fees from Cordis. Dr.
C. W. Lee reports receiving lectures fees from Medtronic. Dr. S. W. Park reports receiving research grant support from Medtronic. Dr. Seong reports receiving research grant support from Boston Scientific. Drs. Jeong and Yoon report receiving lecture fees from Cordis, Medtronic, and Boston Scientific. Drs. Yang and Lim report receiving lecture fees from Cordis and Medtronic. Dr. Chae reports receiving research grant support from Cordis. Dr. Choi reports receiving lecture fees from Cordis, Abbott Vascular, Medtronic, and Boston Scientific. Drs. Tahk and K. S. Kim report receiving lecture fees from Boston Scientific. Dr. H. S. Kim reports receiving consulting fees from Abbott Vascular. Drs. N. H. Lee, Cheong, Seung, Hur, Hong, and H. S. Park report receiving lecture fees from Cordis and Boston Scientific.
Manuscript received October 8, 2009; revised manuscript received January 13, 2010, accepted March 2, 2010.
Abbreviations and Acronyms
BMSⴝ bare-metal stent(s) DESⴝ drug-eluting stent(s) MIⴝ myocardial infarction PCIⴝ percutaneous coronary intervention PESⴝ paclitaxel-eluting stent(s)
SESⴝ sirolimus-eluting stent(s)
TLRⴝ target lesion revascularization TVRⴝ target vessel revascularization ZESⴝ zotarolimus-eluting stent(s)
angiographic follow-up between 8 and 10 months after the procedure or earlier if anginal symptoms occurred.
All outcomes of interest were confirmed by source doc- umentation collected at each hospital and were centrally adjudicated by an independent clinical events committee, whose members were blinded as to the assigned stent. An independent data and safety monitoring board reviewed the data periodically to identify potential safety issues, but there were no formal stopping rules.
Quantitative coronary angiography. Coronary angio- grams were digitally recorded at baseline, immediately after the procedure, and at follow-up and were assessed offline in the angiographic core laboratory (Asan Medical Center, Seoul, Korea) with an automated edge-detection system (CAAS V, Pie Medical Imaging, Maastricht, the Nether- lands) by experienced assessors unaware of the allocated stent. Standard qualitative and quantitative analyses and definitions were used for angiographic analysis (9). The reference diameter was determined by interpolation.
All quantitative angiographic measurements were ob- tained within the stented segment (in-stent) and over the entire segment including the stent and its 5-mm proximal and distal margins (in-segment). Measured variables included the diameter of the reference vessel, the minimal luminal diameter, the degree of stenosis (%), and late luminal loss (the difference between the minimal luminal diameter after the post-procedure and at follow-up). Binary restenosis was de- fined as percentage diameter stenosis of 50% or greater on follow-up angiography, and restenosis patterns were qualita- tively assessed with the Mehran classification (10).
Study end points and definitions. The primary end point was a composite of major adverse cardiac events (i.e., death from any cause, MI, and ischemia-driven target vessel revas- cularization [TVR]) within 12 months. Secondary clinical end points included the individual components of the primary outcome, composite of death or MI, ischemia-driven target lesion revascularization (TLR), and stent thrombosis. Second- ary angiographic end points were in-stent and in-segment late loss and binary restenosis at 9 months angiography.
All deaths were considered to have been from cardiac causes unless a noncardiac cause could be identified. The diagnosis of MI was based on the presence of new Q waves in at least 2 contiguous leads or an elevation of creatine kinase or its MB isoenzyme to at least 3 times the upper limit of the normal range. Revascularization was defined as ischemia-driven if there was stenosis of at least 50% of the diameter, as documented by a positive functional study, ischemic changes on an electrocardiogram, or ischemic symptoms or, in the absence of documented ischemia, if there was stenosis of at least 70% as assessed by quantitative coronary analysis. The occurrence of stent thrombosis was assessed by the Academic Research Consortium definition (11). Device success was defined as a final stenosis of ⬍30%
of the vessel diameter after implantation of the assigned stent only, and treatment success was defined as a final
stenosis of ⬍30% of the vessel diameter with the use of any percutaneous intervention.
Statistical analysis. On the basis of previous clinical trials (SIRIUS [Sirolimus-Eluting Balloon-Expandable Stent in the Treatment of Patients with De Novo Native Coronary- Artery Lesions] [2], TAXUS-IV [3], TAXUS-V [12], SIRTAX [Sirolimus-Eluting Versus Paclitaxel-Eluting Stents for Coronary Revascularization] [13], ISAR- DIABETES [Intracoronary Stenting and Angiographic Results: Do Diabetic Patients Derive Similar Benefit From Paclitaxel-Eluting and Sirolimus-Eluting Stents] [14], LONG-DES II [Randomized Comparison of the Efficacy of Sirolimus-Eluting Stent Versus Paclitaxel-Eluting Stent in the Treatment of Long Native Coronary Lesions trial]
[15], and the ENDEAVOR-I [16] and ENDEAVOR-II [8]
studies; the ENDEAVOR-III [17] and ENDEAVOR-VI [7] results were not yet available at the time of our study design), we assumed an incidence of primary end point of 6% in the SES group, 11% in the ZES, and 17% in the PES group. Based on our alternative hypothesis that ZES might be noninferior to SES and superior to PES, the primary analysis was therefore a noninferiority comparison (with a noninferiority margin of 5%) between ZES and SES and a superiority comparison between ZES and PES. The non- inferiority margin was based on historical data, clinically acceptable relevance, and the feasibility of study recruit- ment. We intended to give 90% power to the study and chose an alpha level of 0.025 (corrected by the Bonferroni method for the 2 planned comparisons in the primary analysis). For the noninferiority testing with a noninferiority margin of 5% and a 1-sided 2.5% significance level, 475 patients were needed to have 90% power to reject the null hypothesis if it was false. For the superiority testing, enrollment of 861 patients would provide the study with a statistical power of 90% to detect the difference with a 2-sided significant level of 0.025. To fulfill the assumptions for the 2 primary comparisons with a 2.0% allowance for attrition, a sample size of 2,640 patients (880 patients in each group) was calculated with PASS software (NCSS, Kaysville, Utah).
Noninferiority would be declared if the 1-sided 97.5% upper confidence limit for the difference was not ⬎5%.
All analyses were based on the intention-to-treat princi- ple. Differences among treatment groups were evaluated by analysis of variance for continuous variables and by the chi-square or Fisher exact test for categorical variables.
Cumulative event curves were generated by means of the Kaplan-Meier method. The noninferiority and superiority hypothesis was assessed statistically with Z test, by which 1-sided p values for noninferiority were calculated to com- pare differences between groups with margins of noninferi- ority, and the log-rank test, respectively.
We pre-specified stratified analyses of the primary out- come according to the presence or absence of 3 characteristics:
diabetes, diffuse long lesion (if at least 1 of the treated lesions
was ⱖ28 mm), and bifurcation lesion. We additionally per-
formed post-hoc analyses stratified according to acute coronary
syndromes, lesion in the left anterior descending artery, mul- tivessel disease, and small vessel disease (if at least 1 of the treated lesions had a reference vessel diameter ⱕ2.75 mm).
For angiographic subgroup analyses, we used general linear mixed models and generalized estimation equation logistic models with robust standard errors that allowed for correlation of more than 1 lesion within patients to compare characteristics of lesions between groups at baseline and follow-up.
Analyses were performed with the use of SAS software version 9.1 (SAS Institute, Cary, North Carolina). No adjustments were made for multiple comparisons in second- ary analyses. All p values and confidence intervals are 2-sided, apart from those from noninferiority testing of the primary end point for comparison between ZES and SES.
Results
Baseline characteristics and procedural results. Between October 2006 and January 2008, a total of 2,645 patients (3,613 lesions) were enrolled in the study and randomly assigned to receive ZES (883 patients; 1,190 lesions), SES
(878 patients; 1,218 lesions), or PES (884 patients; 1,205 lesions). Baseline clinical, angiographic, and procedural char- acteristics were similar among the groups (Tables 1 and 2).
The rates of device success and treatment success were similar for the 3 study groups.
Clinical outcomes. Adverse events during follow-up are shown in Table 3. At 1 month, the incidence of clinical events was similar among the groups, except that there was a trend toward a lower incidence of early thrombosis in the SES group compared with the other devices.
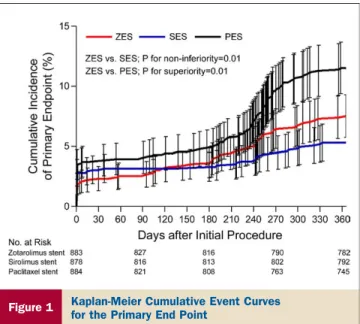
Clinical follow-up at 12 months was completed for 2,603 of the 2,645 patients (98.4%): 870 of 883 (98.5%) in the ZES group, 864 of 878 (98.4%) in the SES group, and 869 of 884 (98.3%) in the PES group (p ⫽ 0.93). At 12 months, the incidence of the primary end point was 10.2% in patients receiving ZES, 8.3% in patients receiving SES, and 14.1% in patients receiving PES, demonstrating that ZES was not inferior to SES (p for noninferiority ⫽ 0.01, p for superiority ⫽ 0.17) and was superior to PES (p for superiority ⫽ 0.01) (Fig. 1, Table 3). The incidence of death or MI was similar
Baseline Clinical Characteristics of the Patients Table 1 Baseline Clinical Characteristics of the Patients
ZES (nⴝ 883) SES (nⴝ 878) PES (nⴝ 884) p Value
Age, yrs 61.7⫾ 9.3 61.9⫾ 9.6 62.0⫾ 9.6 0.80
Male sex 586 (66.4) 591 (67.3) 582 (65.8) 0.80
Body mass index, kg/m2 24.9⫾ 2.9 25.0⫾ 3.1 25.0⫾ 2.9 0.88
Diabetes mellitus
Any diabetes 268 (30.4) 247 (28.1) 245 (27.7) 0.42
Requiring insulin 32 (3.6) 33 (3.8) 36 (4.1) 0.88
Hypertension 552 (62.5) 517 (58.9) 540 (61.1) 0.29
Hyperlipidemia 466 (52.8) 451 (51.4) 446 (50.5) 0.62
Current smoker 236 (26.7) 256 (29.2) 243 (27.5) 0.51
Family history of CAD 48 (5.4) 44 (5.0) 52 (5.9) 0.72
Previous coronary angioplasty 75 (8.5) 82 (9.3) 83 (9.4) 0.76
Previous bypass surgery 6 (0.7) 6 (0.7) 5 (0.6) 0.94
Previous myocardial infarction 30 (3.4) 39 (4.4) 41 (4.6) 0.37
Previous congestive heart failure 9 (1.0) 4 (0.5) 7 (0.8) 0.41
Cerebrovascular disease 65 (7.4) 55 (6.3) 53 (6.0) 0.47
Peripheral vascular disease 15 (1.7) 21 (2.4) 17 (1.9) 0.57
Multivessel disease 414 (46.9) 430 (49.0) 410 (46.4) 0.51
Left ventricular ejection fraction, % 61⫾ 8 61⫾ 8 61⫾ 8 0.59
Clinical indication 0.73
Silent ischemia 48 (5.4) 44 (5.0) 56 (6.3)
Chronic stable angina 348 (39.4) 343 (39.1) 343 (38.8)
Unstable angina 410 (46.4) 424 (48.3) 403 (45.6)
NSTEMI 77 (8.7) 67 (7.6) 82 (9.3)
Discharge medications
Aspirin 882 (99.9) 873 (99.4) 880 (99.5) 0.24
Clopidogrel 876 (99.2) 874 (99.5) 881 (99.7) 0.42
Warfarin 3 (0.3) 7 (0.8) 6 (0.7) 0.45
Statin 698 (79.0) 720 (82.0) 715 (80.9) 0.29
ACE inhibitor 343 (38.8) 312 (35.5) 315 (35.6) 0.26
Angiotensin II-receptor antagonist 235 (26.6) 222 (25.3) 242 (27.4) 0.60
Beta-blocker 581 (65.8) 562 (64.0) 594 (67.2) 0.37
Calcium-channel blocker 460 (52.1) 481 (54.8) 439 (49.7) 0.10
Values given are mean⫾ SD or n (%). Data are given for the intention-to-treat population.
ACE⫽ angiotensin-converting enzyme; CAD ⫽ coronary artery disease; NSTEMI ⫽ non–ST-segment elevation myocardial infarction;
PES⫽ paclitaxel-eluting stent(s); SES ⫽ sirolimus-eluting stent(s); ZES ⫽ zotarolimus-eluting stent(s).
among the groups. There were significant differences among the 3 groups in the rates of TLR and TVR (Table 3).
At 12 months, the cumulative frequency of definite or probable stent thrombosis was 0.7% with ZES and 0.8% with PES, and there was no case with SES. There were 3 cases of late stent thrombosis: 1 patient (121 days after stenting, stopping aspirin and clopidogrel 55 days after the procedure because of patient’s noncompliance) in the ZES group, and 2 patients (54 days after stenting on dual antiplatelet therapy and 190 days after stenting, 5 days after stopping aspirin and clopidogrel because of a tooth extraction) in the PES group.
All of the cases were related to de novo thrombosis and not to repeated procedures. The rates of antithrombotic treatment were similar among the groups during follow-up.
The findings for the primary end point were consistent across the pre-specified stratified analyses for diabetes, diffuse long lesions, and bifurcation lesions as well as in other important post hoc subgroups (acute coronary syndrome, lesions in the left anterior descending artery, multivessel disease, and small vessel disease) (Fig. 2).
Angiographic results. Quantitative angiographic results at baseline, after procedure, and at follow-up are shown in Table 4. Angiographic measurements of lesions before and after the procedure were similar in the groups. Angiographic follow-up at 9 months was completed in 1,849 of 2,645 patients (69.9%): 623 (70.6%) in the ZES group, 599 (68.2%) in the SES group, and 627 (70.9%) in the PES group (p ⫽ 0.41). Patients undergoing angiographic follow-up were younger (p ⬍ 0.001); less likely to have diabetes (p ⫽ 0.001), hypertension (p ⫽ 0.03), previous MI (p ⫽ 0.006), or multivessel disease (p ⫽ 0.004); and more likely to have higher ejection fraction (p ⬍ 0.001) than those who did not return for angiographic follow-up.
Among patients undergoing angiographic follow-up, base- line clinical, angiographic, and procedural characteristics were similar among the groups. The mean (⫾SD) in-stent late luminal loss was 0.53 ⫾ 0.53 mm in the ZES, 0.15 ⫾ 0.35 mm in the SES, and 0.46 ⫾ 0.52 mm in the PES groups (p ⬍ 0.001). The rate of in-segment binary restenosis was 12.1% in the ZES, 2.4% in the SES, and 12.4% in the PES group
Baseline Lesions and Procedural Characteristics Table 2 Baseline Lesions and Procedural Characteristics
ZES (nⴝ 1,190 Lesions)
SES (nⴝ 1,218 Lesions)
PES
(nⴝ 1,205 Lesions) p Value Lesion characteristics
Location 0.39
Left anterior descending 622 (52.3) 645 (53.0) 611 (50.7)
Left circumflex 252 (21.2) 225 (18.5) 253 (21.0)
Right coronary 316 (26.6) 348 (28.6) 340 (28.2)
Coronary graft 0 0 1 (0.1)
ACC-AHA B2 or C type 858 (72.1) 921 (75.6) 895 (74.3) 0.14
Total occlusion 68 (5.7) 76 (6.2) 96 (8.0) 0.07
Thrombus-containing 32 (2.7) 37 (3.0) 38 (3.2) 0.78
Bifurcation lesions 181 (15.2) 151 (12.4) 166 (13.8) 0.14
Ostial lesion 85 (7.1) 72 (5.9) 82 (6.8) 0.45
Restenotic lesion 5 (0.4) 12 (1.0) 13 (1.1) 0.16
Calcification 0.77
None or mild 1,129 (94.9) 1,145 (94.0) 1,132 (93.9)
Moderate 40 (3.4) 43 (3.5) 46 (3.8)
Severe 21 (1.8) 30 (2.5) 27 (2.2)
Lesion length, mm 0.09
⬍10 73 (6.1) 71 (5.8) 61 (5.1)
10–20 466 (39.2) 444 (36.5) 504 (41.8)
⬎20 651 (54.7) 703 (57.7) 640 (53.1)
Procedural characteristics
No. of stents/lesion 1.2⫾ 0.5 1.2⫾ 0.4 1.2⫾ 0.4 0.35
No. of stents/patient 1.6⫾ 0.9 1.6⫾ 0.9 1.6⫾ 0.9 0.92
Length of stents/lesion, mm 27.9⫾ 13.1 28.9⫾ 13.5 28.9⫾ 14.3 0.12
Length of stents/patient, mm 39.7⫾ 26.8 38.3⫾ 24.3 38.9⫾ 25.2 0.48
Maximal stent diameter, mm 3.4⫾ 0.7 3.4⫾ 0.7 3.5⫾ 0.6 0.03
Maximal pressure, atm 16.3⫾ 4.2 16.3⫾ 4.1 16.2⫾ 4.2 0.95
Direct stenting 86 (7.2) 110 (9.0) 89 (7.4) 0.19
Intravascular ultrasound guidance 488 (41.0) 514 (42.2) 491 (40.7) 0.74
Use of glycoprotein IIb/IIIa inhibitors/patient 19 (2.2) 15 (1.7) 14 (1.6) 0.64
Device success 1,164 (97.8) 1,198 (98.4) 1,176 (97.6) 0.40
Treatment success 1,186 (99.7) 1,215 (99.8) 1,200 (99.6) 0.77
Values given are n (%) or mean⫾ SD. Data are given for the intention-to-treat population.
ACC⫽ American College of Cardiology; AHA ⫽ American Heart Association; other abbreviations as inTable 1.
(p ⬍ 0.001). By per-lesion basis analysis, the incidences of TLR were consistent with those for per-patients analysis (ZES vs. SES vs. PES, 4.2% vs.0.6% vs. 5.5%, respectively, p ⬍ 0.001). The incidences of primary end point in the angiographic subgroups were 10.4% for ZES, 8.2% for SES, and 15.3% for PES (p ⬍ 0.001). There was no interaction between treatment effect and the presence or absence of angiographic follow-up (p for interaction ⫽ 0.50). Addi-
tionally, angiographic follow-up did not significantly affect the primary outcome (p ⫽ 0.25).
Discussion
In this large-scale, randomized, multicenter trial, ZES was noninferior to SES and was superior to PES in the composite end point of death, MI, and ischemia-driven TVR at 12 months. Rate of death or MI at 1 year was
Clinical Events at Follow-Up Table 3 Clinical Events at Follow-Up
Clinical Outcomes ZES (nⴝ 883) SES (nⴝ 878) PES (nⴝ 884) p Value
Follow-up at 1 month
Death 3 (0.3) 1 (0.1) 1 (0.1) 0.55
Cardiac 3 (0.3) 1 (0.1) 1 (0.1) 0.55
Noncardiac 0 0 0 —
Myocardial infarction 44 (5.0) 54 (6.2) 60 (6.8) 0.27
Q-wave 3 (0.3) 3 (0.3) 3 (0.3) ⬎0.99
Non–Q-wave 41 (4.6) 51 (5.8) 57 (6.4) 0.25
Death or myocardial infarction 45 (5.1) 54 (6.2) 60 (6.8) 0.32
Ischemia-driven target lesion revascularization 3 (0.3) 0 4 (0.5) 0.17
Percutaneous 3 (0.3) 0 4 (0.5) 0.17
Surgical 0 0 0 —
Ischemia-driven target vessel revascularization 3 (0.3) 0 4 (0.5) 0.17
Percutaneous 3 (0.3) 0 4 (0.5) 0.17
Surgical 0 0 0 —
Stent thrombosis
Definite 3 (0.3) 0 4 (0.5) 0.17
Definite or probable 5 (0.6) 0 5 (0.6) 0.06
Any 5 (0.6) 0 5 (0.6) 0.06
Major adverse cardiac events 45 (5.1) 54 (6.2) 60 (6.8) 0.32
Follow-up at 12 months
Death 6 (0.7) 7 (0.8) 10 (1.1) 0.57
Cardiac 5 (0.6) 3 (0.3) 5 (0.6) 0.83
Noncardiac 1 (0.1) 4 (0.5) 5 (0.6) 0.28
Myocardial infarction 47 (5.3) 55 (6.3) 62 (7.0) 0.34
Q-wave 5 (0.6) 3 (0.3) 5 (0.6) 0.83
Non–Q-wave 42 (4.8) 52 (5.9) 57 (6.4) 0.29
Death or myocardial infarction 51 (5.8) 61 (6.9) 67 (7.6) 0.31
Ischemia-driven target lesion revascularization* 43 (4.9) 12 (1.4) 66 (7.5) ⬍0.001
Percutaneous 43 (4.9) 11 (1.3) 65 (7.4) ⬍0.001
Surgical 0 1 (0.1) 1 (0.1) 0.78
Ischemia-driven target vessel revascularization* 46 (5.2) 16 (1.8) 67 (7.6) ⬍0.001
Percutaneous 46 (5.2) 15 (1.7) 66 (7.5) ⬍0.001
Surgical 0 1 (0.1) 1 (0.1) 0.78
Stent thrombosis
Definite* 4 (0.5) 0 6 (0.7) 0.04
Definite or probable* 6 (0.7) 0 7 (0.8) 0.02
Acute 1 (01) 0 1 (0.1) ⬎0.99
Subacute 4 (0.5) 0 4 (0.5) 0.14
Late 1 (0.1) 0 2 (0.2) 0.78
Any* 7 (0.8) 1 (0.1) 9 (1.0) 0.05
Primary end point† 90 (10.2) 73 (8.3) 125 (14.1) ⬍0.001
Percentages are from the intention-to-treat analysis. The p values were calculated with the chi-square test or Fisher exact test, as appropriate. *The p values of post hoc multiple comparisons for secondary clinical end points. No adjustments were made for multiple comparisons in secondary analyses: for target lesion revascularization (ZES vs. SES: p⬍ 0.001, ZES vs. PES: p ⫽ 0.02, and SES vs. PES: p ⬍ 0.001); for target vessel revascularization (ZES vs. SES: p⬍ 0.001, ZES vs. PES: p ⫽ 0.04, and SES vs. PES: p ⬍ 0.001); for definite stent thrombosis (ZES vs. SES: p ⫽ 0.12, ZES vs. PES: p ⫽ 0.75, and SES vs. PES: p⫽ 0.03); for definite or probable stent thrombosis (ZES vs. SES: p ⫽ 0.03, ZES vs. PES: p ⬎ 0.99, and SES vs. PES: p ⫽ 0.02); and for any stent thrombosis (ZES vs. SES: p ⫽ 0.07, ZES vs.
PES: p⫽ 0.62, and SES vs. PES: p ⫽ 0.02). †For primary end point (defined as composite of death, myocardial infarction, and ischemia-driven target-vessel revascularization), p ⫽ 0.01 from noninferiority test and p⫽ 0.17 from superiority test for comparison of ZES with SES, and p ⫽ 0.01 from superiority test for comparison of ZES with PES.
Abbreviations as inTable 1.
similar among the 3 groups, whereas the rate of stent thrombosis in the ZES group was similar with the PES group but higher than the SES group.
Several clinical studies have compared SES and PES.
Sirolimus was found be more effective as a site-specific agent than paclitaxel in reducing neointimal growth and repeat revascularization (13,14,18). On the basis of these out-
comes, our primary hypothesis was that late-coming ZES might be noninferior to SES and superior to PES. Although several new DES are being developed and used in current practice, there have been limited data comparing these newer stents with the established SES and PES in various types of patients, including those with more complicated lesions and in acute settings. Therefore our study is a well-powered, randomized trial that compared the relative efficacy and safety of ZES simultaneously with well-proven SES and PES. Although subgroup findings should be considered hypothesis-generating, major findings were con- sistent across high-risk subpopulations (i.e., diabetes, long lesions, small vessels, and multivessel disease). Accordingly, our findings can be extended to a broader spectrum of patients and provide a high level of generalizability to routine clinical practice.
Theoretically, an acceptable mild degree of neointimal proliferation of ZES might provide a reasonable compro- mise between safety and efficacy. By contrast, in this trial, the incidence of stent thrombosis during 1 year was higher in the ZES and the PES groups than in the SES group. These findings are similar to recent results from the SORT OUT (The Danish Organization on Random- ized Trials With Clinical Outcome) III (19) and ENDEAVOR-IV trial (7). However, larger studies with longer-term follow-up are needed to provide information for relative long-term safety beyond 1 year, which is indeed the main concern with DES use.
Routine angiographic follow-up is known to increase the rate of repeat revascularization by the ocul-stenotic
Figure 1 Kaplan-Meier Cumulative Event Curves for the Primary End Point
The p value for comparison of zotarolimus-eluting stent (ZES) with sirolimus- eluting stent (SES) is 1-sided from noninferiority test with a Z test, and p value for comparison of ZES with paclitaxel-eluting stent (PES) is 2-sided from superi- ority test with a log-rank test. I bars indicate 95% confidence intervals.
Figure 2 Subgroup Analysis of Primary End Point in Comparing ZES With SES and PES
Probability for interaction represents the likelihood for interaction between the variable and the relative treatment effect.
CI⫽ confidence interval; other abbreviations as inFigure 1.
reflex (20). However, in the current study, we did not find a significant interaction between treatment effect and systematic repeat angiography, suggesting that the rela- tive performance of the study devices was consistent across the angiography follow-up cohort and nonangiog- raphy follow-up cohorts. In addition, repeat angiography did not affect the primary outcome by risk factor analysis.
Although the present study excluded only patients with ST-segment elevation MI and left main disease, both of which might be associated with larger vessel size, the vessel size of the study group was larger than that reported in previous comparative trials (13,21,22). Therefore, there is
the possibility that a larger vessel size might attenuate differences between stents.
In this trial, the use of intravascular ultrasound during the procedure was more common compared with those in Western countries (23). Although the clinical impact of intravascular ultrasound in DES placement is not yet clear, higher usage of intravascular ultrasound might partly con- tribute to the relatively lower incidence of stent thrombosis compared with the rates reported in previous trials (13,19,24).
The most consistent finding of the ZEST trial is that SES is associated with lowest angiographic restenosis, with lowest need for TLR, and with the lowest risk of stent
Quantitative Angiographic Analysis Table 4 Quantitative Angiographic Analysis
ZES (nⴝ 1,190 Lesions)
SES (nⴝ 1,218 Lesions)
PES
(nⴝ 1,205 Lesions) p Value Before procedure
Lesion length, mm 23.7⫾ 12.0 24.3⫾ 12.2 24.4⫾ 12.5 0.38
Reference vessel diameter, mm 2.99⫾ 0.51 3.01⫾ 0.50 3.00⫾ 0.50 0.72
Minimal luminal diameter, mm 0.98⫾ 0.49 0.99⫾ 0.51 0.97⫾ 0.50 0.62
Diameter stenosis, % 67.2⫾ 15.4 66.9⫾ 15.7 67.7⫾ 15.6 0.52
Immediately after procedure Minimal luminal diameter, mm
In stent 2.63⫾ 0.48 2.61⫾ 0.46 2.61⫾ 0.46 0.34
In segment 2.30⫾ 0.51 2.32⫾ 0.51 2.30⫾ 0.52 0.69
Diameter stenosis, %
In stent 9.8⫾ 9.5 10.7⫾ 9.0 11.1⫾ 8.8 0.004
In segment 17.8⫾ 10.1 17.4⫾ 9.5 18.2⫾ 9.8 0.23
Acute gain, mm
In stent 1.65⫾ 0.57 1.61⫾ 0.55 1.63⫾ 0.56 0.40
In segment 1.31⫾ 0.58 1.32⫾ 0.57 1.32⫾ 0.59 0.91
Follow-up at 9 months
No. of lesions with follow-up angiography 841 840 840
Minimal luminal diameter, mm*
In stent 2.12⫾ 0.61 2.48⫾ 0.49 2.17⫾ 0.62 ⬍0.001
In segment 2.00⫾ 0.58 2.23⫾ 0.50 2.00⫾ 0.59 ⬍0.001
Diameter stenosis, %*
In stent 28.3⫾ 17.3 15.7⫾ 12.3 26.5⫾ 17.7 ⬍0.001
In segment 30.6⫾ 17.5 21.5⫾ 12.1 30.3⫾ 17.3 ⬍0.001
Late luminal loss, mm*
In stent 0.53⫾ 0.53 0.15⫾ 0.35 0.46⫾ 0.52 ⬍0.001
In segment 0.30⫾ 0.52 0.11⫾ 0.35 0.32⫾ 0.51 ⬍0.001
Binary restenosis, %*
In stent 9.6 1.8 10.9 ⬍0.001
In segment 12.1 2.4 12.4 ⬍0.001
Restenosis pattern, %
Focal 6.2 2.1 7.7 ⬍0.001
Diffuse 3.9 0.3 4.1 ⬍0.001
Proliferative 1.1 0 0.4 0.01
Total occlusion 0.8 0 0.1 0.02
Values are mean⫾ SD. *The p values of post hoc multiple comparisons for secondary angiographic outcomes. Bonferroni corrections were made for multiple comparisons of continuous variables in secondary angiographic analyses; for in-stent minimal luminal diameter (ZES vs. SES: p⬍ 0.001, ZES vs. PES: p⫽ 0.20, and SES vs. PES: p ⬍ 0.001); for in-segment minimal luminal diameter (ZES vs. SES: p ⬍ 0.001, ZES vs. PES: p ⬎ 0.99, and SES vs. PES: p⬍ 0.001); for in-stent diameter stenosis (ZES vs. SES: p ⬍ 0.001, ZES vs. PES: p ⫽ 0.09, and SES vs. PES: p ⬍ 0.001); for in-segment diameter stenosis (ZES vs. SES: p⬍ 0.001, ZES vs. PES: p ⬎ 0.99, and SES vs. PES: p ⬍ 0.001); for in-stent late loss (ZES vs. SES: p ⬍ 0.001, ZES vs. PES: p⫽ 0.01, and SES vs. PES: p ⬍ 0.001); for in-segment late loss (ZES vs. SES: p ⬍ 0.001, ZES vs. PES: p ⫽ 0.41, and SES vs. PES: p ⬍ 0.001);
for in-stent restenosis (ZES vs. SES: p⬍ 0.001, ZES vs. PES: p ⫽ 0.83, and SES vs. PES: p ⬍ 0.001); and for in-segment restenosis (ZES vs. SES:
p⬍ 0.001, ZES vs. PES: p ⬎ 0.99, and SES vs. PES: p ⬍ 0.001).
Abbreviations as inTable 1.
thrombosis among the 3 tested types of DES. This might suggest that newer DES platforms are not always better than older ones. Given that current evidence for the first 2 approved DES supports a sustained long-term clinical effect in a broad population of patients, new DES must prove clinical efficacy and safety in both long-term follow-up as well as in complex subsets.
Study limitations. Given the relatively infrequent occur- rence of the safety outcomes (death, MI, and stent throm- bosis), substantially larger patient populations are required to detect small differences in event rates. At the inception of the study design, the noninferiority margin was based on historical data, clinically acceptable relevance, and the fea- sibility of recruitment. Given that a relative ratio of effect sizes between 0.8 and 1.25 has been historically reasonable to imply equivalence, we acknowledge that our noninferi- ority margin is too wide, and this noninferiority might have been nonsignificant with a larger cohort of patients. If the upper limit of the 1-sided 95% confidence interval of 1.25 on a relative risk scale might be planned for such an analysis, the necessary sample size would be more than 6,650 patients in each arm. Another limitation of our study was the relatively short follow-up period of 12 months. The ongo- ing, post-approval, large randomized PROTECT (Patient Related OuTcomes with Endeavor versus Cypher stenting Trial)— comparing ZES and SES in 8,800 patients with the primary end point of definite or probable thrombosis at 3 years—will provide a critical appraisal of relative safety (25).
Conclusions
Our practical randomized trial showed that ZES resulted in similar rates of major adverse cardiac events compared with SES and in fewer events compared with PES at 1 year.
Reprint requests and correspondence: Dr. Seung-Jung Park, Department of Cardiology, University of Ulsan College of Med- icine, Cardiac Center, Asan Medical Center, 388-1 Poongnap- dong, Songpa-gu, Seoul 138-736, Korea. E-mail: sjpark@amc.
seoul.kr.
REFERENCES