Print ISSN: 2288-4637 / Online ISSN 2288-4645 doi:10.13106/jafeb.2020.vol7.no5.061
1 First Author and Corresponding Author. Ph.D. Scholar, School of Finance, Zhongnan University of Economics and Law, China [Postal Address: No. 182, Nanhu Avenue, Donghu New Technology Development Zone, Wuhan City, Hubei Province, China, 430073] Email: [email protected]
2 School of Economics and Management, Huanghuai University, Zhumadian, Henan, China. Email: [email protected]
3 Ph.D. Scholar, School of Finance, Zhongnan University of Economics and Law, China. Email: [email protected]
4 Ph.D. Scholar, School of Finance, Zhongnan University of Economics and Law, China. Email: [email protected]
5 Reading Academy, Nanjing University of Information Science and Technology, Nanjing, China. Email: [email protected]
© Copyright: The Author(s)
This is an Open Access article distributed under the terms of the Creative Commons Attribution Non-Commercial License (http://Creativecommons.org/licenses/by-nc/4.0/) which permits unrestricted noncommercial use, distribution, and reproduction in any medium, provided the original work is properly cited.
Do Firm Characteristics Determine Capital Structure of Pakistan Listed Firms? A Quantile Regression Approach
Karamat KHAN
1, Jing QU
2, Muhammad Haroon SHAH
3, Kebba BAH
4, Irfan Ullah KHAN
5Received: February 18, 2020 Revised: March 08, 2020 Accepted: April 10, 2020
Abstract
The purpose of this study is to investigate the determinants of the capital structure of firms operating in a developing economy, Pakistan.
The quantile regression method is applied on a sample of 183 non-financial companies listed on the Pakistan Stock Exchange during the period of 2008-2017. Specifically, the empirical analysis focuses on changes in the coefficients of the determinants according to the leverage ratio quantiles of the examined listed firms. The findings show that the capital structure of Pakistan listed firms differs between firms in different quantiles of leverage. These differences are significant with the sign of explanatory variables changes with the level of leverage.
The research result found tangibility, profitability and age to be positively related to leverage among listed firms in Pakistan. However, size, liquidity and non-debt tax shield (NDTS) are negatively related to leverage. A firm’s growth and risk are found to be insignificant predictors of capital structure in Pakistan listed firms. Moreover, the study also found a significant impact of industry characteristic on leverage. The findings of this study indicate that an individual firm’s finance policy needs to be responsive to the firm’s characteristics and should match with the different borrowing requirements of listed firms.
Keywords : Capital Structure, Firm Characteristics, Leverage Ratio, Quantile Regression, Pakistan.
JEL Classification Code : G30, G32, G34
1. Introduction
Capital structure is considered one of the most important topics that have been studied by theories and literature of finance and accounting. These theories have been used to stipulate not only the best mix, but also to explain the factors that determine the capital structure, as well as guiding firms
to make decisions, which lead to optimal capital structure.
The research regarding the contributing factors influencing the firm’s decision to finance their capital structure, either by debt or equity, instigated since Modigliani and Miller (1958) proposed capital structure irrelevance theory. They concluded that the firm mode of financing does not affect its market value. However, the assumptions that guided the application of this theory were very restrictive in nature, which does not hold in the real world of rational investors, inefficient markets, asymmetric information problems and many taxes. Therefore, Modigliani and Miller (1963) reconsidered their idea and suggested that tax benefits are significant factors, which have an impact on the firm’s capital structure decisions. The discussion continued until Miller (1977) reinstated some of the spirits of capital structure irrelevance proposition by describing three tax rates that affect the firm’s total value. These are, namely, the corporate tax rate, the tax imposed on dividends, and tax rate imposed on the income of interest inflows.
Since the conception of Modigliani and Miller
(1958) irrelevance theory, scholars wrote many papers
to understand the circumstances under which the capital
structure matters. For instance, Koralun-Bereźnicka (2018)
analyzed 11 European Union countries data to establish the relationship between capital structure and its determinants, M’ng, Rahman, and Sannacy (2017) examined the factors which affect the capital structure of firms operating in Malaysia, Singapore and Thailand; Wellalage and Locke (2013)corporate governance and capital structure in New Zealand’s large listed companies. Eight years of data for 40 firms listed on the NZX50 Stock Exchange, are collected and observations are analysed using a conditional quantile regression. This study finds firm-specific characteristics rather than corporate governance variables play a significant role in determining firm leverage levels. The results indicate that finance policies need to vary across firm type and firm characteristics, and should match with the different borrowing requirements of listed firms. © 2013 Copyright © 2013 Vilnius Gediminas Technical University (VGTU explored the determinants of capital structure for New Zealand listed firms; Fattouh, Harris and Scaramozzino (2008) investigated the capital structure of UK firms and Rajan and Zingales (1995) studied the US firms. Therefore, all these researchers came up with a broad set of firm-specific characteristics, namely, size and age of the firm, tangibility, profitability, liquidity, risk, growth and NDTS, which somehow influence the capital structure (Fattouh, Harris, & Scaramozzino, 2008; Saksonova, 2006the author will outline several stages of the process of determining optimal capital structure and will concentrate in particular on the first two stages of this process–analysis of company’s borrowed capital and equity as well as the evaluation of the main factors, which influence capital structure. It is important to stress these preparatory stages, because successful operation of the company is built on properly understanding the relationship between risk and potential reward that is inherent in different alternatives of capital structure. These stages stress the importance of gathering reliable financial information about the company (enabling calculation of the ratios mentioned in the article;
Fattouh, Scaramozzino, & Harris, 2005; McConnell & Pettit, 1984).
This paper contributes to the existing academic literature available on the topic of determinants of capital structure in many ways. First, the focus of most of the prior research was to understand how these factors are significant predictors of capital structure for the firms operating in developed countries. However, very limited research is available to understand that factors that determine the capital structure of firms in developed countries are also valid predictors for firms operating in developing countries. Therefore, Pakistan, for its underdeveloped economy, provides a compelling case for analysis. Second, the methodology used in this study is superior to prior research.
To the best of researcher knowledge, the current study is the first in the context of Pakistan firms, which uses the quantile regression method. Quantile regression analysis
examines the whole distribution of the capital structure, which is a limitation of the ordinary least square method considering only a single measure of central tendency of the capital structure distribution. Besides, the dataset of this study contains not only large outliers, but also violates other critical assumptions like the normality of data and heteroscedasticity, required for multiple regression analysis;
therefore, using quantile regression is a more appropriate and effective approach for this study. Third, the current study aims to empirically explore the relationship between firm characteristics and firm capital structure using a broader set of explanatory variables and with a larger dataset. Finally, this study also assesses the role of industry characteristic in determining the capital structure of Pakistan listed firms.
The next section of this article will review prior research on the topic of interest and then follows the discussion of data, the definition of variables, methodology used in this study, interpretation of results and finally, we will conclude our research on the basis of evidence found in this study.
2. Literature Review
Since after Modigliani and Miller (1958) proposed leverage irrelevance theory, the researchers came across other theories to explain the disparities in debt-to-equity ratio from one firm to another. Though, these four theories, which explain leverage level disparities among firms are, namely, pecking-order theory, trade-off theory, agency theory, and market-timing theory. Pecking-order theory is based on the argument that the cost of financing increases with information asymmetry between investors and managers (Myers, 1984; Ross, 1977). Therefore, the theory suggests that companies prioritize sources of financing through which they can accumulate funds for their capital structure.
Initially, firms utilize their internal resources like retained earnings, and when that is depleted, firms prefer to go for debt financing and, as of last option, equity is issued.
On the other hand, the trade-off theory recommends that companies should maintain an optimal level of capital structure by cost and benefit analysis of debt (DeAngelo &
Masulis, 1980). The firm reaps the benefits of debt financing
by taking advantage of tax benefits and because of fewer
agency problems as debt alleviates the differences between
equity holders and managers. The agency-cost theory, for its
part, suggests that high leverage act as a punitive force to
lessen the managerial cash flow waste (Jensen & Meckling,
1976). Added to this, the agency cost may also arise between
shareholders and debt holders due to default risk. Lastly,
market-timing theory postulates that firms generally do not
care about the debt or equity mode of financing; they just
decide about the form of financing which is more favorable
at that specific point of time (Myers, 1984). Therefore, based
on the above four theories, the current study will analyze both
firm and industry-specific characteristics, which determine the capital structure of Pakistan listed firms. These characteristics are: size, tangibility, liquidity, profitability, NDTS, age, growth and the industry in which the firm operates.
2.1. Firm Size
Firm size is considered an important determinant of capital structure. However, there are conflicting views about the relationship between firm size and debt financing.
Smaller firms face higher bankruptcy costs, lower marginal corporate tax rates, and high asymmetry information.
Therefore, these firms have less incentive to finance their capital structure through debt than larger firms (Michaelas, Chittenden, & Poutziouris, 1999). Cassar (2004) argued that, due to high market access, large firms may prefer a higher level of debts than smaller firms. Add to this, the high cost of external borrowings may discourage smaller firms for a higher proportion of debt. Following this, one may expect a positive relationship between firm size and leverage.
On the other hand, Rajan and Zingales (1995) suggested that larger firms disclose more information to outside investors, therefore, reducing asymmetric information problems. Thus, the chances of undervaluation of the new equity issue reduce which encourages the larger firms to use equity financing. Fattouh, Harris, and Scaramozzino (2008) examined UK-listed firms using the conditional quantile regression method and their result found a large variation in the magnitude and sign of the estimated coefficients for firm size and debt financing. According to their findings, significantly positive coefficients at lower quantile turned into significantly negative coefficients at higher quantiles.
The study concluded that, regardless of their size, when firms become highly leveraged, they might no longer be able to borrow at favorable conditions.
As for the corporate sector of Pakistan, the overall corporate debt as a percentage of GDP has risen from 14.57 percent in 2012 to 15.55 percent in 2017 (State Bank of Pakistan, 2017). The literature generally suggests an inverse relation of firm size and its leverage level; the bigger the size, the lower the leverage (Onofrei, Tudose, Durdureanu,
& Anton, 2015). A similar relationship appears to exist in the corporate sector of Pakistan; the largest listed firms observed the highest asset growth with low leverage by utilizing internal financing options when compared with highly leveraged small firms.
Hypothesis 1: Firm size is a significant predictor of firm leverage level.
2.2. Tangibility
Companies with a large proportion of tangible assets like building, plant and machinery, etc., will be in a better position
to provide more security to the lenders and achieve higher leverage in their capital structure. The banking sector is one of the primary sources of debt financing for the corporate sector of Pakistan. Therefore, in the context of Pakistan’s corporate sector, the collateral requirement of banks is an important element that affects the lender decision to grant a loan. The State Bank of Pakistan (2017) disclosed that banks provide seventy percent of Pakistan corporate debt, and the overall share of Small and Medium-size enterprises is only seven percent in debt financing by banks. Large firms whose total assets are mainly coming from fixed assets, with this high tangibility, offer more security to the lenders in the event of bankruptcy the debt holders can liquidate these collateral assets to recover their loan (M’ng, Rahman, & Sannacy, 2017). This confirmed that total fixed assets and debt to equity ratio appear to have risen during the time period of 2013 to 2017 for Pakistan stock exchange-listed firms (State Bank of Pakistan, 2017). The trade-off theory suggests that a company’s tangible assets can be used as collateral to secure higher leverage in the capital structure (Frank &
Goyal, 2003). Therefore, one can assume a positive relation between firm tangible assets and leverage level (Um, 2001).
Hypothesis 2: Tangibility is a significant predictor of firm leverage level.
2.3. Liquidity
As anticipated by the pecking-order theory, Onofrei, Tudose, Durdureanu, and Anton (2015), Shah and Jam-e- Kausar (2012), Ahmed Sheikh and Wang (2011), Lipson and Mortal (2009) report an inverse relation between firm leverage ratio and firm liquidity, indicating that firm with high liquidity does not bring as much debt in their capital structure. A negative relationship between leverage ratio and liquidity is likely, just because utilizing more debt in capital structure increases liabilities, thus leaving fewer current assets after paying liabilities. A negative relationship between leverage and liquidity suggests that firms finance their capital structure by following the financing hierarchy of the pecking order theory. Ozkan (2001) argued that firms with higher liquidity may have lower leverage in their capital structure because of possible conflicts between equity holders and debt financers. The higher the liquidity level, the higher the affluence with which equity holders can manipulate the liquid assets to the detriment of debt financers. However, as foretold by trade-off theory, Al-Najjar and Taylor (2008) while examining Jordanian firms, proposed a positive relationship between firm leverage level and liquidity. This positive relationship can be explained as the firm with higher liquid assets provides more security and collateral assets to debt financers which positively affect external borrowings.
Hypothesis 3: Liquidity is a significant predictor of firm
leverage level.
2.4. Profitability
Profitability is defined as the proportion of earnings before interest, tax and depreciation to total assets. The pecking-order theory assumes that, because of asymmetric information problems between managers and outsiders, the managers chose to finance their projects internally. Add to this that profitable firms evade raising external equity to avoid the dilution of the firm ownership structure. Therefore, we expect a negative relationship between profitability and the use of leverage in the capital structure. Deesomsak, Paudyal, and Pescetto (2004) study explored the determinants of capital structure for firms operating in four countries of Asia Pacific Region, namely, Thailand, Australia, Singapore and Malaysia. Results suggest a negative, but insignificant relationship between profitability and capital structure.
Besides, M’ng, Rahman, and Sannacy (2017) compiled evidence of significant negative impact of profitability on the firm capital structure for Malaysia, Singapore and Thailand.
Many other researchers, for example, Pratheepan and Weerakon Banda (2016), Pepur, Ćurak, and Poposki (2016), Onofrei, Tudose, Durdureanu, and Anton (2015), Ali (2011) and Ahmed Sheikh and Wang (2011)found a significant inverse association between firm profitability and use of leverage level. However, studies conducted in Pakistan using different estimation methods provided mix results for profitability and capital structure (Jahanzeb, Bajuri, & Ghori, 2015; Shah & Jam-e-Kausar, 2012; Ahmed Sheikh & Wang 2011; Tahir Hijazi & Bin Tariq, 2006).
Hypothesis 4: Profitability is a significant predictor of firm leverage level.
2.5. Age
The firm’s age measured by the number of years since incorporation can play a significant role in determining the capital structure. Older firms have longer track records, therefore, more familiar to the market participants because of their reputation. A firm with a long track record can easily access debt financers and acquire more debt than a new firm with a low reputation which is consistent with trade- off theory implying a positive relationship between firm age and leverage level. Contrary to this, the pecking-order theory suggests that, when firm survives in business for a long time, then it can accumulate more funds for running the operations of the business and subsequently keeps away the firm to go for debt financing (Nivorozhkin, 2002). Therefore, when a firm matures and builds a favorable reputation, it may lead to better and cost-effective access to the equity market. Consistent with the pecking-order theory, many researchers find a negative relationship between age and leverage level (Manos & Ah- Hen, 2003; Hall, Hutchinson, & Michaelas, 2000). Ahmed, Ahmed, and Ahmed (2010) analyzed the determinants
of capital structure for insurance companies in Pakistan using OLS regression. Their study concluded a negative relationship between firm age and leverage level. However, Sbeti and Moosa (2012), Moosa, Li, and Naughton (2011) using extreme bound analysis, concludes that age is a fragile and insignificant predictor in explaining capital structure.
Hypothesis 5: Age is a significant predictor of firm leverage level.
2.6. Non-Debt Tax Shield
Other than interest expense on debt, firms seek to exploit the tax-deductibility of depreciation expense as a tax shield which reduces their dependence on leverage (Onofrei, Tudose, Durdureanu, & Anton, 2015). Depreciation expense is considered an alternative to tax benefits obtained by the use of debt. M’ng, Rahman, and Sannacy (2017) confirm that when a firm uses high depreciation as an NDTS, it achieves lower debt levels in their capital structure. A negative relationship is expected between NDTS and leverage because of a higher NDTS lesser dependence on tax benefits obtained from debt financing (Byoun, 2008). However, Choi, Yoo, Kim, and Kim (2014) using 43 construction companies listed on the South Korea Stock Exchange with the quantile regression approach, concludes that NDTS is an inappropriate measure for determining the capital structure of South Korean construction companies.
Hypothesis 6: NDTS is a significant predictor of firm leverage level.
2.7. Risk
Both the trade-off theory and the pecking-order theory propose a negative relationship between firm earning volatility and debt level, but with different justifications. Firms with high earning volatility can face a risk of a significant drop in earnings which may reduce the ability of borrowers to make debt service payments. This may push firms to arrange funds at a high cost to pay the debt or otherwise bankrupt in extreme cases. However, if a firm’s preferred way of financing is equity, and then at the time of financial distress, they can avoid paying dividends. Thus, this shows that firms with high earnings volatility will be less dependent on debt financing and prefer equity financing when faced with external financing choices. Aligned with that, Pepur, Ćurak, and Poposki (2016), find a significant inverse relationship between Croatian large firm’s risk and leverage levels.
This is consistent with Ahmed Sheikh and Wang (2011),
Zarebski and Dimovski ( 2012)our analysis incorporates the
Global Financial Crisis (GFC findings that earning volatility
makes financial distress more likely; therefore, firms reduce
leverage level in their capital structure to reduce debt service
and reduce the risk of distress. However, few studies find
a significant positive association between firm earning volatility and leverage levels. (Michaelas, Chittenden, &
Poutziouris, 1999; Jordan, Lowe, & Taylor, 1998). This can be explained when firms, due to financial distress, prefer to borrow more funds to avoid bankruptcy instead of reducing the leverage.
Hypothesis 7: Risk is a significant predictor of firm leverage level.
2.8. Growth
Prior studies found mixed results for firm growth prospects and leverage levels. Generally, it is more reasonable to say that a firm with more growth prospects will search for more debt to finance their future investments. However, based on agency theory, Myers (1977) suggests that firms with high growth possibilities will be apt to have lower leverage. The reason is that high growth prospects can create moral hazard effects and leads firms to take more risk. Due to this reason, a firm with high growth prospects but being considered as riskier can face difficulties in securing debt on promising terms. Furthermore, according to the trade-off theory, firms with high growth rates tend to use less external financing because the growth rate is non-collateralized. In different studies, a negative relationship is reported between growth prospects and leverage which supports the proposition of trade-off theory (Koralun-Bereźnicka, 2018; Pepur, Ćurak, & Poposki, 2016; Choi, Yoo, Kim, & Kim, 2014).
However, Shah and Jam-e-Kausar (2012) and Achy (2009) find a positive relationship between growth prospects and firm leverage level, indicating that a firm with high growth prospects will be inclined to look outside the firm to finance which is consistent with the pecking order theory.
Contrary to these theories, some research finds growth prospects as an inappropriate variable for predicting the leverage level of the firm. Wellalage and Locke (2013) explore the relationship between firm characteristics and debt ratio while analyzing eight years of data for 40 firms listed on the NZX50 Stock Exchange. The results of conditional quantile regression revealed that growth is an insignificant predictor of firm leverage. Later on, Wellalage and Locke (2014) conclude the same finding for firms listed on the Colombo Stock Exchange which suggests growth as an insignificant predictor except at mid quantile.
Hypothesis 8: Growth is a significant predictor of firm leverage level.
3. Data and Methodology 3.1. Data
The current study explores the determinants of capital structure for non-financial firms, listed on Pakistan Stock
Exchange during period 2008-2017, using data available on the Osiris database. Osiris database provides useful information on key accounts of the financial statements of firms listed on the Pakistan Stock Exchange. Additionally, it allows for the calculation of many variables that are known to be relevant to the studies of firms in developing countries. Initially, the database provided data on 484 firms listed on the Pakistan Stock Exchange. First, financial institutions have been excluded from this study as they are the primary source of financing. Hence, their capital structure differs from non-financial companies. Secondly, we excluded all firms which do not provide information on variables of interest for period 2008-2017. The final sample consists of a balanced panel of 183 firms, which belongs to eight industries, namely, Automobile, Cement, Chemical, Engineering, Food & Personal Care, Pharmaceutical, and Sugar and Textile.
Prior empirical studies identify firm-specific characteristics such as firm size, tangibility, liquidity, profitability, NDTS, age, risk and growth rate as the main determinants of firm capital structure (Ramlall, 2009; Rajan
& Zingales, 1995). Therefore, all variable used in this study are mainly adopted from the existing literature, to compare our finding with the prior empirical studies in developed and developing countries. The dependent variable in this study is leverage ratio; the predictor variables are size, tangibility, liquidity, profitability, age, NDTS, risk and growth. Dataset consists of firms belongs to eight industries, therefore, to analyze the impact of industries we used eight industry dummy variables. Variables and their proxies are listed in Table 1. All variables in this study are measured on the basis of book values. As we shall discuss next, two of our variables namely, risk and growth required the computation of yearly change and because of that one year had to be dropped for these variables.
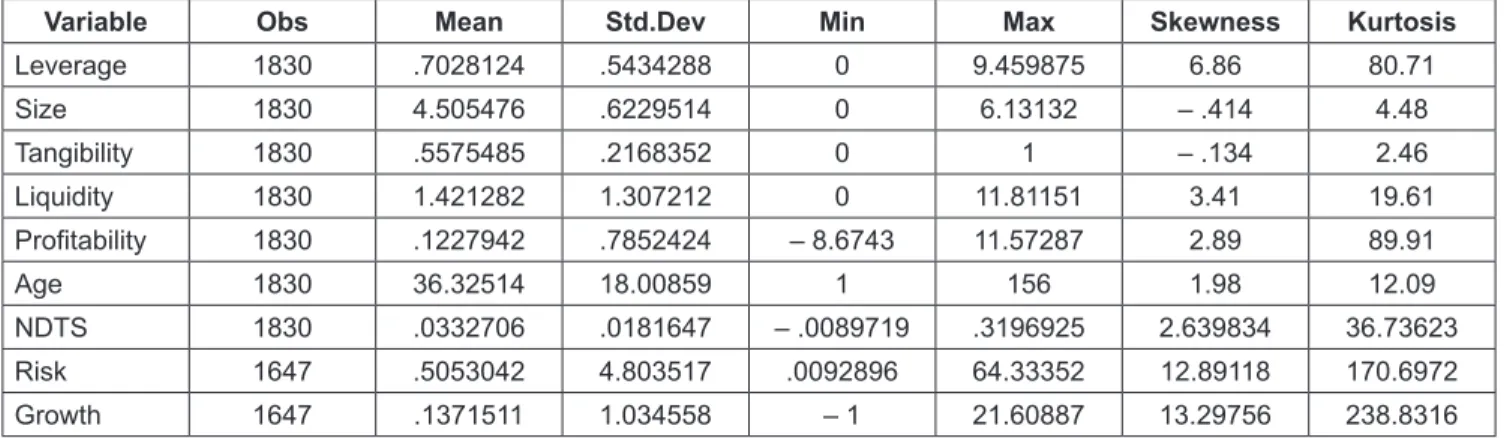
Table 2 reports descriptive statistics for the sample data.
The mean value of leverage variable is 0.70. This leverage proxy shows high use of debt mode of financing in capital structure in Pakistan listed firms. This is in line with the findings of Shah and Jam-e-Kausar (2012) who reported that the average debt to asset ratio for companies in Pakistan is 68% which is close to the statistics of the current study.
These findings indicate that Pakistan listed firms rely on debt as the main source of finance. Table 2 shows that firm size, calculated by the natural logarithm of total assets mean value is 4.5. This value is almost half of 8.42 which is the mean size of firms in developed countries like the UK (Fattouh, Harris,
& Scaramozzino, 2008). Descriptive statistics indicate that
the mean value of firm tangibility is .56. This means that a
large proportion of total assets consists of fixed assets. This
value is significantly close to the results of Ahmed Sheikh
and Wang (2011) who testified that tangibility ratio for firms
in Pakistan is 52%.
The current study found a mean value of 1.42 for liquidity which means that each unit of current liability is backed by 1.42 unit of a current asset. This value is 20% higher than reported by Ahmed Sheikh and Wang (2011). Probably, the companies want to keep high liquid assets for the purpose to seize or avoid any unseen or uncertain event in the near future. The average value for profitability proxy is .12, which is almost similar to the findings of Jahanzeb, Bajuri, and Ghori (2015) who reported a profitability mean of .11 for Pakistani firms. Added to this, the mean age of firms listed on the Pakistan Stock Exchange is 36.33 years. The NDTS and risk variable indicate the average value of .033 and .51.
Again, the current statistics are confirmed by the findings of Ahmed Sheikh and Wang (2011) who investigated the capital structure of Pakistan manufacturing firms. They reported NDTS mean value .038 and Risk 0.55 respectively. Lastly, results indicate that the current study sample firm’s growth rate is .14 which is as close to the 0.15 a growth rate reported by Shah and Jam-e-Kausar (2012). Table 2, shows that except for tangibility and size all other variables skewness values are not close to zero and their kurtosis values are greater than 3, indicating non-normal distribution except for tangibility and size (Mukherjee, White, & Wuyts, 2013). This shows that all variables have extreme values.
Table 1: Definition of variables
Variables Definition Source
Dependent Variable
Leverage Total Debt / Total Asset Koralun-Bereźnicka (2018), M’ng et al. (2017)
Explanatory Variables
Size Natural Logarithm of Total Assets Wellalage & Locke (2013), Choi et al. (2014) Tangibility Total Fixed Assets / Total Assets Koralun-Bereźnicka (2018), Wellalage & Locke
(2013)
Liquidity Current Assets / Current Liabilities Koralun-Bereźnicka (2018), Wellalage & Locke (2013)
Profitability Net profit or loss for the period / Equity Koralun-Bereźnicka (2018), Shah & Jam-e- Kausar (2012)
Age Observation Year – Year of
Incorporation Ahmed et al. (2010)
Non-Debt Tax Shield Total Depreciation/ Total Assets M’ng et al. (2017), Wellalage & Locke (2013) Risk Standard Deviation of the First Difference
of EBITD/Average Total Assets over time Wellalage & Locke (2013), Ahmed Sheikh &
Wang (2011)
Growth (Sales
t– Sales
t−1)/Sales
t−1Wellalage & Locke (2013), Fattouh et al. (2008)
Industry Dummy Variables Wellalage & Locke (2013), Saksonova (2006)
Table 2: Descriptive Statistics
Variable Obs Mean Std.Dev Min Max Skewness Kurtosis
Leverage 1830 .7028124 .5434288 0 9.459875 6.86 80.71
Size 1830 4.505476 .6229514 0 6.13132 – .414 4.48
Tangibility 1830 .5575485 .2168352 0 1 – .134 2.46
Liquidity 1830 1.421282 1.307212 0 11.81151 3.41 19.61
Profitability 1830 .1227942 .7852424 – 8.6743 11.57287 2.89 89.91
Age 1830 36.32514 18.00859 1 156 1.98 12.09
NDTS 1830 .0332706 .0181647 – .0089719 .3196925 2.639834 36.73623
Risk 1647 .5053042 4.803517 .0092896 64.33352 12.89118 170.6972
Growth 1647 .1371511 1.034558 – 1 21.60887 13.29756 238.8316
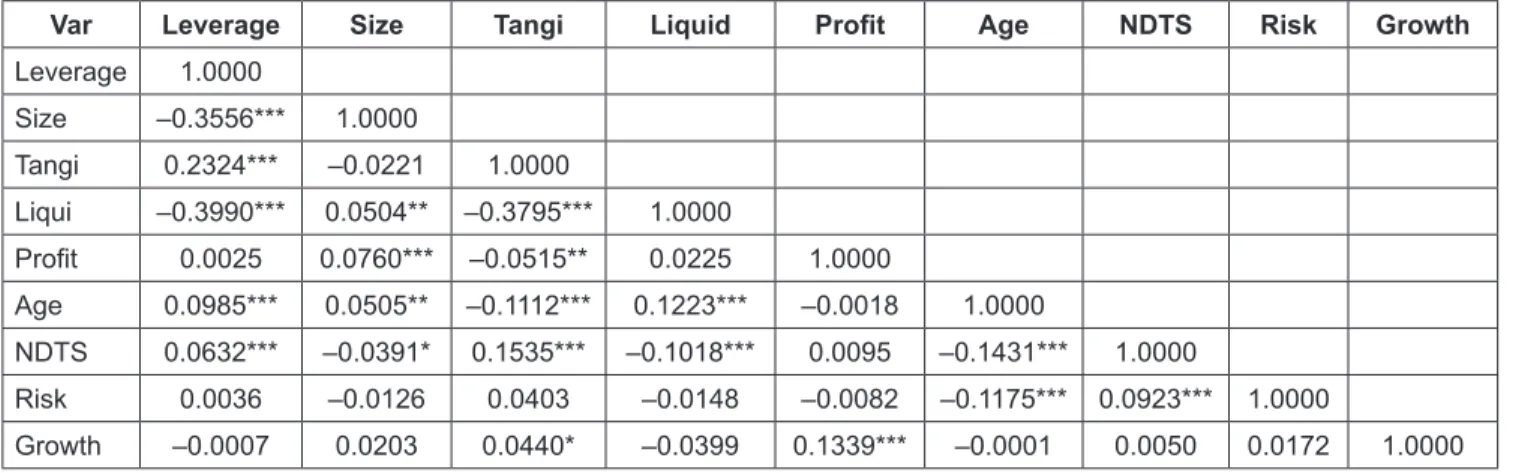
Table 3 shows the results of correlation analysis among all variables. All correlations are weak to moderate, ranging between r = -0.40 and r = .23, thus, the analysis indicates that multicollinearity does not exist among variables.
3.2. Methodology
Analysis of descriptive statistics in Table 2 shows that the sample data contains large outliers and variables violate the normality assumption which is required for regression analysis. To further ensure it, the current study conducted the Jarque Bera normality test. The results show that, except for tangibility, all other variables are significant at the level of p
<0 .05. Therefore, Jarque Bera normality test rejects the null hypothesis except for tangibility that the data are normally distributed. This result confirms that applying conditional mean estimator OLS regression is not an appropriate method because it produces biased and inefficient estimates. On the other hand, quantile regression is more potent and superior to ordinary least square regression, because it produces discrete estimates for all conditional quantiles of a response variable’s distribution (Ramdani & Witteloostuijn, 2010).
Moreover, they argued that quantile regression is more effective than ordinary least square regression, particularly for skewed data, data with unequal variance and when the data contains outliers. Quantile regression as introduced by Koenker and Bassett (1978) seeks to complement classical linear regression analysis. Quantile regression essentially transforms a conditional distribution function into a conditional quantile function by splitting it into segments.
In OLS, modelling a conditional distribution function of a random sample (y1,……yn) with a parametric function m(xi,β) where xi represents the independent variables, β the corresponding estimates and m the conditional mean, can cause the following minimization problem:
( )
( )
1
min
n i i, 2
i
R y x
β µ β
=
∈ ∑ − (1)
Obtains the conditional expectation function E[Y | xi] can proceed in quantile regression. The central feature thereby becomes ρτ, which serves as a check function.
( * 1 * ) x x if x if x 0 0
τ
ρ τ τ
≥
= − < (2)
In quantile regression, one minimizes now the following function.
( )
( )
1
min
n i i,
i
y x
β τ ρ
τβ
=
∈ ∑ −∈ (3)
Hence, in contrast to ordinary least square, the minimization is performed for each subset defined by ρτ, where the coefficient of the τth – quantile is obtained with the parametric function ξ(xi,β) (Koenker & Hallock, 2001).
Furthermore, the current study used matrix bootstrap method to achieve estimates of the standard errors for the quantile regression coefficients under many forms of heterogeneity.
Construction of confidence intervals based on the quantile regression estimator can be greatly simplified by using the bootstrap. Further, based on a Monte Carlo study, Buchinsky (1998)concentrating on cross-section applications.
It summarizes the most important issues in quantile regression applications and fills some gaps in the literature. The paper (a explains that the design matrix bootstrap method performs well with a relatively small sample size and is valid under different forms of heterogeneity.
Table 3: Pearson Correlation
Var Leverage Size Tangi Liquid Profit Age NDTS Risk Growth
Leverage 1.0000
Size –0.3556*** 1.0000
Tangi 0.2324*** –0.0221 1.0000
Liqui –0.3990*** 0.0504** –0.3795*** 1.0000
Profit 0.0025 0.0760*** –0.0515** 0.0225 1.0000
Age 0.0985*** 0.0505** –0.1112*** 0.1223*** –0.0018 1.0000
NDTS 0.0632*** –0.0391* 0.1535*** –0.1018*** 0.0095 –0.1431*** 1.0000
Risk 0.0036 –0.0126 0.0403 –0.0148 –0.0082 –0.1175*** 0.0923*** 1.0000
Growth –0.0007 0.0203 0.0440* –0.0399 0.1339*** –0.0001 0.0050 0.0172 1.0000
Note: Correlation is significant at the *** p<0.01, ** p<0.05, * p<0.1 level (2-tailed)
4. Results and Discussion
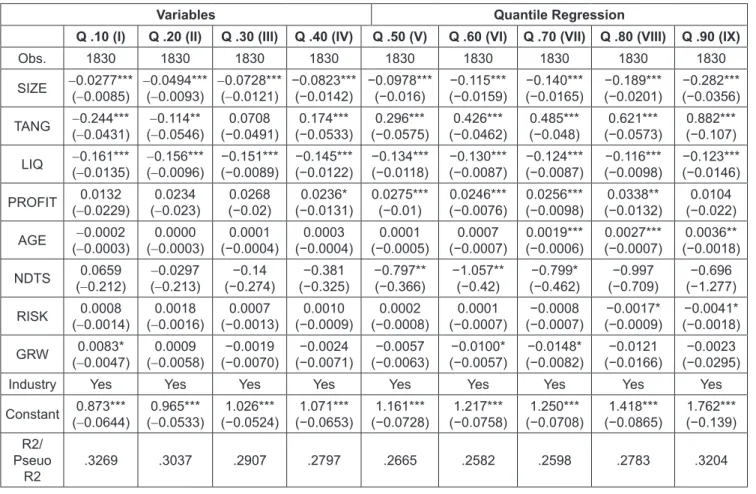
Table 4 shows the quantile regression results for leverage ratio. Column (I) to column (IX) shows quantile regression results for quantile q= .10, q=.20, q=.30, q=.40, q=.50, q=.60,
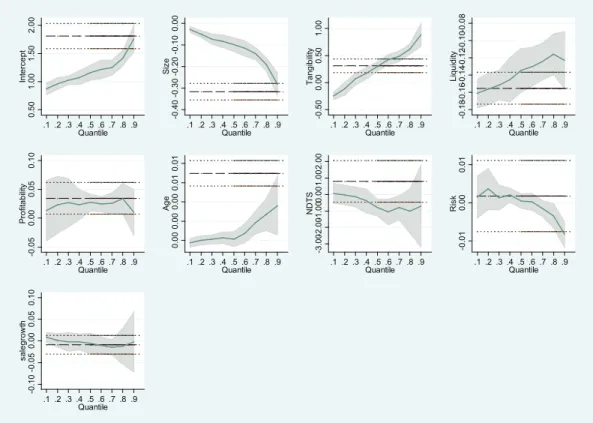
=.70, q=.80, q=.90 respectively. The quantile regression results indicate that the effect of firm size is negative and significant throughout all quantiles. A report about the corporate sector of Pakistan reveals that large firms observe higher asset growth with the lowest leverage level (Financial Stability Report 2017). Therefore, it seems that larger firms in Pakistan follow the pecking-order theory by utilizing equity mode of financing to avoid cost related to debt financing. For further illustration, quantiles are visualized.
In Figure 1, the horizontal lines indicate the ordinary least square point estimates with their confidence intervals. The size plot indicates that the coefficient on size is significantly negative over the complete range of quantile distribution, with a larger effect at the higher quantiles. Tangibility enters with a significantly negative coefficient at lower quantile, however, from .40 quantile the coefficients of tangibility are significantly positive with the highest coefficient of .822 at the 90th quantile.
Overall this finding is consistent with the trade-off theory, which explains that firm tangibility has a positive impact on firm debt capacity. The State Bank of Pakistan report reveals
that in Pakistan corporate sector the overall net fixed asset increased from 2013 to the highest in 2017 with an increase in debt to equity ratio (Financial Stability Review, 2017). Findings of the current study provide support to study of Wellalage and Locke (2014) which explains that an increase in net fixed assets provides security to the debt financers in lending decisions. However, this relationship between tangibility and leverage for different debt to equity quantiles depend upon the market. Fattouh et al. (2005) study concluded that tangibility is significantly positively related to all levels of the distribution of leverage, and the coefficient of tangibility increase in magnitude as it moves up to higher quantiles of debt to equity level.
The coefficients of liquidity are significantly negatively related to the leverage at all parts of the quantile distribution.
The negative coefficient of tangibility at lower quantile indicates that, when firms at lower quantile are involved in liquidation or transformation of their fixed assets, then this higher liquidity results in reductions of firm’s external borrowings (Venkiteshwaran, 2011; Morellec, 2001; Myers
& Rajan 1998). This result is in line with the findings of previous studies indicating that liquidity is negatively related to debt to equity. The study conducted by Wellalage and Locke (2013) and Choi et al. (2014) for New Zealand and South Korean firms, showed that liquidity is significantly negatively related to leverage level at all quantiles.
0.501.001.502.00Intercept
.1 .2 .3 .4 .5 .6 .7 .8 .9 Quantile
-0.40-0.30-0.20-0.100.00Size
.1 .2 .3 .4 .5 .6 .7 .8 .9 Quantile
-0.500.000.501.00Tangibility
.1 .2 .3 .4 .5 .6 .7 .8 .9 Quantile
-0.18-0.16-0.14-0.12-0.10-0.08Liquidity
.1 .2 .3 .4 .5 .6 .7 .8 .9 Quantile
-0.050.000.050.10Profitability
.1 .2 .3 .4 .5 .6 .7 .8 .9 Quantile
0.000.000.000.010.01Age
.1 .2 .3 .4 .5 .6 .7 .8 .9 Quantile
-3.00-2.00-1.000.001.002.00NDTS
.1 .2 .3 .4 .5 .6 .7 .8 .9 Quantile
-0.010.000.01Risk
.1 .2 .3 .4 .5 .6 .7 .8 .9 Quantile
-0.10-0.050.000.050.10salegrowth
.1 .2 .3 .4 .5 .6 .7 .8 .9 Quantile