저작자표시-비영리-변경금지 2.0 대한민국 이용자는 아래의 조건을 따르는 경우에 한하여 자유롭게
l 이 저작물을 복제, 배포, 전송, 전시, 공연 및 방송할 수 있습니다. 다음과 같은 조건을 따라야 합니다:
l 귀하는, 이 저작물의 재이용이나 배포의 경우, 이 저작물에 적용된 이용허락조건 을 명확하게 나타내어야 합니다.
l 저작권자로부터 별도의 허가를 받으면 이러한 조건들은 적용되지 않습니다.
저작권법에 따른 이용자의 권리는 위의 내용에 의하여 영향을 받지 않습니다. 이것은 이용허락규약(Legal Code)을 이해하기 쉽게 요약한 것입니다.
Disclaimer
저작자표시. 귀하는 원저작자를 표시하여야 합니다.
비영리. 귀하는 이 저작물을 영리 목적으로 이용할 수 없습니다.
변경금지. 귀하는 이 저작물을 개작, 변형 또는 가공할 수 없습니다.
이학석사학위논문
Changes in ground-level PM mass concentration and column aerosol optical
depth over East Asia during 2004-2014
동아시아 지역의 에어로졸 광학두께와 지표 입자질량농도 변화 연구
2015년 8월
서울대학교 대학원
지구환경과학부
남 지 현
ABSTRACT
Multi-year records of moderate resolution imaging spectroradiometer (MODIS), ground-based particulate matter mass concentration, cloud-aerosol lidar with orthogonal polarization (CALIOP), and ground-level lidar were analyzed to investigate seasonal and annual change of aerosol optical depth (AOD), Ångström exponent (Å), aerosol extinction coefficient, and particulate matter (PM10, PM2.5) mass concentration over East Asia. Least mean square (LMS) fit method is applied to detect the trends and their magnitudes for each selected regions and stations. Eleven-year MODIS measurements show mostly increasing AOD trend as well as Å trend, especially over the east coastal industrialized region in China, of 1.18 % yr-1 and 0.98 % yr-1, respectively. Seasonal and monthly variation of AOD show maximum value at April-July over East Asia, which were related to progress of summer monsoon rain band and stationary continental air mass on the northeast of Asia. Increasing trends of AOD were found for eight China stations (0.80 % yr-1), Seoul, Korea (0.40 % yr-1), but no trend were shown in Gosan station and decreasing trend was shown in Japan (-0.42 % yr-1). Decreasing PM10 mass concentration trend were shown in China, Korea, and Japan of -1.28 % yr-1, -2.77 % yr-1, and -2.03 % yr-1, respectively. Also, PM2.5 mass concentration show significant decreasing trend of about -1.16 % yr-1 over East Asia. Interestingly, significant decreasing trend in surface PM10 and PM2.5 mass concentration over China stations (- 1.28 % yr-1) do not agreed well with the trends of MODIS-derived AOD (0.80 % yr-1).
AOD estimated for planetary boundary layer (PBL-AOD) from CALIOP measurements over East China show decreasing trend of -1.71 % yr-1, wherever AOD estimated for
free troposphere (FT-AOD) show increasing trend of 2.92 % yr-1. In addition, ground- level lidar in Seoul (SNU-L) show decreasing PBL-AOD trend of -2.57 % yr-1 and increasing FT-AOD trend of -0.40 % yr-1. This significant decreasing PBL-AOD and increasing FT-AOD trend is attributable to the relative contribution of complex processes that possibly include change in surface wind speed, total rainy days, atmospheric and hydrological cycle, and East Asian summer monsoon over East Asia.
Keyword: Particulate matter (PM) mass concentration, Aerosol optical depth (AOD), MODIS, lidar, East Asia
Student number: 2013-22972
TABLE OF CONTENTS
ABSTRACT ··· i
TABLE OF CONTENTS ··· iii
LIST OF TABLES ··· v
LIST OF FIGURES ··· vi
CHAPTER 1. INTRODUCTION ··· 1
1.1 Background and motivation ··· 1
1.2 Objectives of this study ··· 2
CHAPTER 2. METHODOLOGY ··· 4
2.1 Data ··· 4
2.1.1 Moderate resolution imaging spectroradiometer (MODIS) ·· 4
2.1.2 Lidar ··· 5
2.1.3 Ground-level particulate matter (PM) mass concentration ··· 6
2.2 Least mean square (LMS) fit method ··· 7
CHAPTER 3. RESULTS AND DISCUSSION ··· 9
3.1 Variations of columnar aerosol optical properties in East Asia
over the past decade ··· 9
3.2 Comparison of trends in columnar aerosol optical depth and ground-level particulate matter mass concentration ··· 13
3.3 Changes of vertically resolved columnar aerosol optical depth from lidar measurements at East China and Seoul ··· 20
3.4 Discussion ··· 23
CHAPTER 4. SUMMARY AND CONCLUSION ··· 26
REFERENCES ··· 28
SUPPLIMENTARY ··· 35
국문초록 ··· 41
LIST OF TABLES
Table 1. List of regions and stations included in this study. ··· 11 Table 2. Slope of the trends of the AOD and Å calculated with LMS method for
2004-2014. Changes in slope in % over the entire data period where calculated from the LMS slope in order to allow comparison between two aerosol optical properties. ··· 13 Table 3. LMS trends of PM2.5 mass concentration measured by surface observation
over stations Beijing, Seoul, Rishiri, and Oki. ··· 20 Table 4. LMS trend of Lidar derived AOD for layers, surface to 5 km (TC), free
troposphere (FT-AOD), and planetary boundary layer (PBL-AOD) by space borne CALIOP lidar(2007-2014), MODIS column AOD (2007-2014), and ground based SNU-L (2006-2014). ··· 21
LIST OF FIGURES
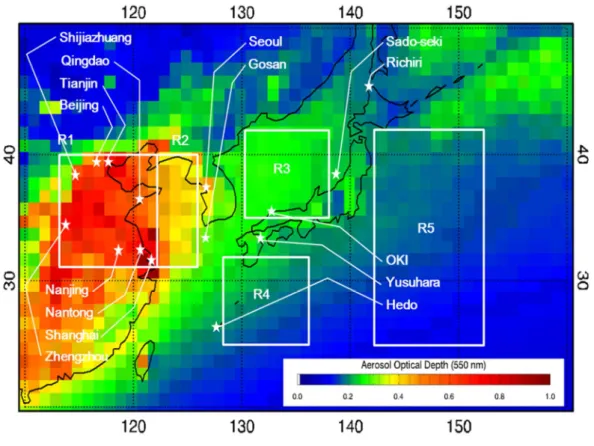
Figure 1. MODIS-derived AOD at wavelength of 550 nm in East Asia averaged during 2004-2014 with selected regions and stations in white box and star shape, respectively. ··· 10 Figure 2. Monthly variation of MODIS-derived AOD at wavelength of 550 nm and
Å at wavelength of 470 nm and 660 nm for region 1 (Top) to 5 (Bottom), during 2004-2014. ··· 12 Figure 3. Seasonal variation of MODIS-derived AOD at wavelength of 550 nm
(closed circle) and PM10 mass concentration (open square) with one standard deviation error bar over selected stations. ··· 15 Figure 4. LMS trend results for AOD during 2004-2014 and PM10 mass
concentration over 2004-2012 (China), 2004-2014 (Korea), and 2003-2013 (Japan). Filled bar correspond to statistically significant trends within 95%
confidence level. ··· 18 Figure 5. Monthly mean of PM2.5 mass concentration in China (Beijing), Korea
(Seoul), and Japan (Rishiri and Oki) in data period 2009-2014, 2006-2014, and 2004-2014, respectively. ··· 19 Figure 6. Time series of lidar-derived monthly mean AOD from (a) CALIOP of each
layer with MODIS-derived column AOD of region 1 in open square over 2006-2014, and (b) SNU-L (Seoul) of each layer in closed circle. Upper figure indicates total AOD (TC), middle is AOD estimated for free
troposphere (FT-AOD), and bottom is AOD estimated for planetary boundary layer (PBL-AOD) with dotted linear fit line during 2007-2014. ··· 22 Figure 7. Spatial distribution of China Meteorological Administration (CMA)
surface wind speed trends during 2002-2009. The positive and negative trends are marked by regular triangles and invertes triangles, respectively.
The filled triangle indicates that the trend at this station is statistically
significant (P<0.05). [Source : Lin et al. (2013)] ··· 24
CHAPTER 1. INTRODUCTION
1.1 Background and motivation
The anthropogenic aerosol impact on climate and human health has become an issue along with economic growth in Asian continent, where emission of aerosols continues to increase (Charlson et al., 1992; Pope et al., 1995; Richter et al., 2005; Tie et al., 2009).
The IEA Energy statistics (IEA, 2010) and GAINS model from Klimont et al. (2009) and Lu et al. (2011) have shown the increasing emission in East Asia with strong correlation to increase in energy consumption. Especially in the urban regions, pollution is affecting surface air quality. According to the results from Wang et al. (2009), visibility that are mostly affected by haze is led to worsening for the past few decades by the presence of aerosols that could have a large impact on the amount of total solar radiation budget. Therefore, observing the distribution of atmospheric aerosols is one of the most important factors to understand how and what kinds of aerosols that impacts regional and temporal air quality as well as human health. Since the atmospheric aerosols have lifetime of days to weeks, aerosols are highly dependent on regional scale.
Given relationship of aerosols and location, aerosol properties vary by aerosol sources and chemical types. The number of papers has provided an overview of long term trends of aerosol optical properties that are observed from space-borne satellites and ground- based measurements (Wang et al., 2009; Coen et al., 2013; Liu et al., 2005, 2007).
Despite the importance of regional aerosols, only few investigations on aerosol optical properties over small regions in East Asia were conducted.
Furthermore, resent research in deriving particulate matter (PM) mass concentration from satellite aerosol optical depth (AOD) observations are in interest (Seo et al., 2015;
Choi et al., 2009; Liu et al., 2004; Wang et al., 2010; Yap and Hashim, 2013; Zheng et al., 2011). Overcoming such limited data availability of ground-level measurements will provide long-term data set of air pollution in regional scales. However, understanding the relationship between aerosol optical properties and PM mass concentration is an important step priori to developing accurate methods for calculating PM mass concentration from satellite aerosol optical properties.
1.2 Objectives of this study
The objectives of this study are:
(1) To investigate the changes in ground-level particulate matter mass concentration and column aerosol optical properties in East Asia by using ground-based and space-borne measurements during 2004-2014.
(2) Discuss the relationship between column AOD and ground-level particulate matter mass concentrations over selected urban/background stations.
(3) To investigate the contribution of free troposphere (FT) and planetary boundary layer (PBL) aerosols to total AOD from space-borne and ground-based lidar measurement.
Descriptions of data and method deployed in this study are given in Chapter 2.
Chapter 3.1 gives the trend of regional AOD and Ångström exponent in East Asia during 2004-2014. Chapter 3.2 describes the seasonal and annual variation of AOD and ground- level PM10 mass concentration. Trends of AOD in layers PBL and FT are given in chapter 3.3 for selected regions, as well as, comparison of AOD variations with PM10
results. Chapter 3.4 will discuss some possible factors that influence the relationships between AOD and PM10. Finally, a conclusion is given in chapter 4.
CHAPTER 2. METHODOLOGY
2.1 Data
Aerosol optical properties such as, aerosol optical depth (AOD), Ångström exponent (Å), aerosol extinction coefficient, and particulate matter (PM) mass concentration are used in this study. These variables are gathered by various instruments such as moderate resolution imaging spectroradiometer (MODIS), cloud-aerosol lidar with orthogonal polarization (CALIOP), and ground-based light detection and ranging (LIDAR). Also, PM10 mass concentration data are gathered by air pollution index (API) in China, National Institute of Environmental Research (NIER) and Korea Meteorological Administration (KMA) in Korea, and acid deposition monitoring network (EANET) in Japan. The following are the information of these instruments.
2.1.1. Moderate Resolution Imaging Spectroradiometer (MODIS)
MODIS/Aqua collection 6 (C6) aerosol products were employed in this study to analyze the annual and seasonal variations of aerosols over East Asia. Monthly MODIS/Aqua global aerosol products (MYD08_M3) of AOD and Å, is distributed with 1°x1° grid at wavelength of 550 nm. MODIS C6 aerosol products are derived by the most recently updated land (algorithm; dark-target and deep blue) and ocean aerosol algorithms, where one is designed to retrieve aerosol over land and ocean and the other retrieves aerosol properties over brighter surfaces. A detailed description of products,
retrieval algorithms, accuracy, validation, and changes in the corresponding satellite sensors can be found in Remer et al. (2005) and Levy et al. (2013). In this study, a complete 11-year data set of AOD and Å retrieved from MODIS land and ocean algorithm are analyzed in order to evaluate the annual and seasonal changes of aerosol loadings over East Asia.
2.1.2. Lidar
CALIOP onboard the CALIPSO satellite is widely used in aerosol studies. Level 1B CALIOP data with horizontal resolution of 333 m provides profiles of the total attenuated backscatter coefficient at wavelength of 532 and 1064 nm. CALIOP AOD is derived by vertical aerosol profile products of aerosol extinction coefficient at 532 nm.
In the case of optically thick aerosol layers, the emitted laser from the space cannot penetrate the layers, which completely attenuates back to space.
“Lidar_Surface_Elevation” of CALIOP level 1B products are used to include the layers in the atmosphere with an integrated attenuated backscatter above CALIOP detection threshold in the column AOD calculation. Cloud-aerosol discrimination (CAD) score is also considered, which indicates confidence score of layer feature type that ranges between -100 (definitely aerosol) and 100 (definitely cloud). CAD scores less than -80 (i.e., high confidence aerosol layers) are used for this study. The detailed CALIOP retrieval descriptions and validations are beyond the scope of this study and can be found in pervious papers (Winker et al., 2009; Omar et al., 2013; Young et al., 2013).
The column AOD for each layer (FT, PBL, and TC) is derived from aerosol backscatter
coefficient in East China during 2004-2014.
Vertical profiles of the aerosol extinction coefficient were measured by ground-based SNU lidar (SNU-L), which is a two-wavelength Mie scattering lidar equipped with depolarization measurement capability (Kim et al., 2006; Shimizu et al., 2004; Sugimoto et al., 2002, 2005, 2006). SNU-L have employed an Nd:YAG laser as a light source that generate fundamental laser pulse at a wavelength of 1064 nm and a second pulse at a wavelength of 532 nm. In this study, aerosol optical depth was calculated by integrating aerosol extinction coefficient in three intervals, surface to 1.5 km (PBL), 1.5 km to 5 km (FT), and surface to 5 km above ground (total column; TC). The column AOD for each layers are derived from aerosol extinction coefficient in Seoul during 2004-2014.
2.1.3. Ground-level particulate matter (PM) mass concentration
The measure of broad air quality in the 8-China mega city stations are reported in the form of the air pollution index (API). API is a semi-quantitative measurement for air quality and is based on a set of corresponding pollutants (PM10, SO2, NO2, CO, and O3) that have impacts on human health. For days when PM10 mass concentration is the leading pollutant, daily PM10 mass concentration is derived from the APIs by using the following formula:
C = + ( − )( − ) ⁄ − , (1)
Where CPM10 is daily mean PM10 mass concentration along with the lower ( ) and
upper ( ) standard PM10 mass concentration values and is reported API along with the lower ( ) and upper ( ) limits representing API grading. Further information about the API and PM10 mass concentration validity may be found in Qu et al. (2010) and more detailed method for calculating PM10 mass concentrations from APIs may be found in Zhang et al. (2003).
Hourly PM10 mass concentrations during 2004-2014 were measured using the β-ray attenuation method at 27 of ministry of environment (MOE) stations in Seoul, and Gosan station from Korea Meteorological Administration (http://www.kma.go.kr). PM10
mass concentration is measured from increased absorption of β-ray method due to the particles collected on the filter by using the relationship of β-ray attenuation to particle mass. The sampling stations are located away from major roadways, on the roofs of two or three-story public buildings. Also, an hour average concentration is calculated based on measurements taken every 5 min. PM10 mass concentration data at 5 stations in Japan were measured within the framework of Acid DepositionMonitoring Network (EANET;
http://www.eanet.asia/product/index.html).
2.2 Least mean square (LMS) fit method
Weatherhead’s statistical trend analysis model (Weatherhead et al., 1998, 2000) is frequently been used for detecting long-term trend of aerosol characteristics. The least mean squares (LMS) fit model assumes:
= + · + + , = 1 … , (2)
Where is monthly aerosol variables, t is time (in months), m is a constant term, ρ is the magnitude of the trend per year, and = t/12 represents the linear trend function.
= ∑ [ , (2 /12) + , (2 /12)] is the seasonal component, where
, and , are seasonal variation parameter. The unexplained noise term is modeled as autoregressive of the order of 1 [AR(1)] = · + , where is the autocorrelation coefficient of the data noise and is independent random variables with mean zero and common variance . I adopt the commonly used decision rule (Tiao et al., 1990) that indicates 5 % significance level or 95 % confidence level of a real trend when / > 2 , where is the standard deviation of the slope.
≅ (1 − ) 1
. = . 1 +
1 − , (3)
Where is standard deviation of , is standard deviation of , and is number of years.
LMS fit was applied directly to the monthly means of aerosol variables that are used in this study. Note that for trends that are discussed in further results and discussions, the term “significant” or “significance” has equivalent meaning for “statistically significant at the 95 % confidence level”.
CHAPTER 3. RESULTS AND DISCUSSION
3.1. Variations of columnar aerosol optical properties in East Asia over the past decade
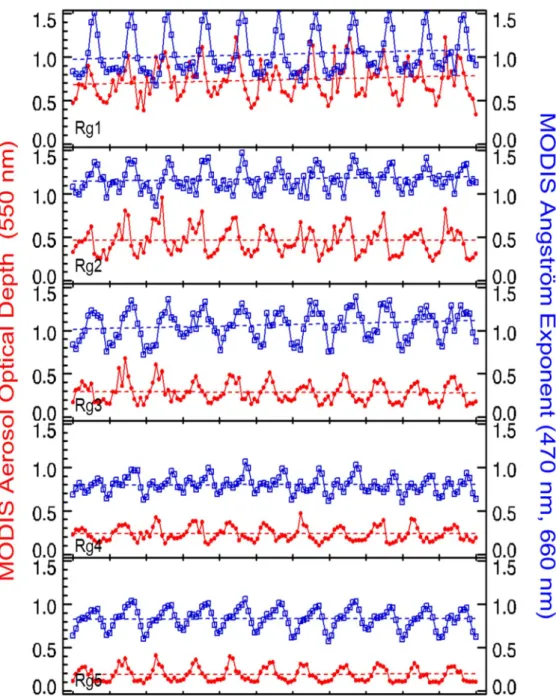
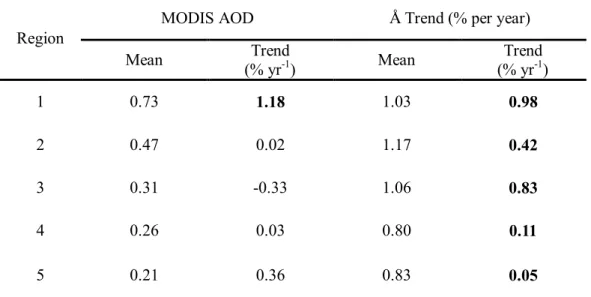
Aerosol have short lifetime and are highly dependent on regional scale. Regions are divided in this study for more detailed investigation on regional aerosol trends. Fig.1 shows the eleven year (2004-2014) averaged MODIS C6 aerosol optical depth (AOD) at wavelength of 550 nm over East Asia, including main source regions of anthropogenic and mineral dust aerosols, and selected ground stations in China (8-station), Korea (2-station), and Japan (5-station). Detailed information on the region and stations are listed in Table 1 and station AOD data comparison with AERONET AOD are given in Fig. S3. For the purposes of analyzing the changes on the East Asia column AOD and changes in aerosol size distribution AOD and Ångström exponent (Å) are shown in Fig.2. Regionally averaged AOD and Å values appear to show each regions degree to which aerosols prevent the transmission of light by absorption or scattering of light and dependency of the AOD with the wavelength of incident light, respectively. Highest AOD is observed at region 1 of0.7, where most dominant aerosols are industrial pollutants, and lowest AOD of 0.2 is featured at region 3 ~ 5 where transported anthropogenic aerosols as well as sea salt aerosols are dominant. Annual mean AOD variations of region 2 tend to follow the variation of region 1 with slightly lower value, due to its geographical location under prevailed westerly winds. In particular, region 1 has lower Å than for region 2 due to the influence of desert with coarse mode aerosols
typically being the most dominant chemical compositions. Generally, all the regions show positive trend of MODIS-derived AOD and Å trend during 2004-2014 (Table 2) except for region 3 with decreasing trend. For regions heavily influenced by anthropogenic aerosols, a positive trend in Å is observed with maximum trend of about +0.98 % yr-1. In general, increasing trend of Å can be explained by an increasing proportion of fine mode particles emitted mainly from industrialized areas of the Asian continent. Further analysis of aerosol size distribution and types is needed to confirm the Å trends and their causes.
Figure 1. MODIS-derived AOD at wavelength of 550 nm in East Asia averaged during 2004-2014 with selected regions and stations in white box and star shape, respectively.
Table 1. List of regions and stations included in this study.
Regions / Stations Description Latitude [°] Longitude [°]
Region 1 E. China 31-40 113-122
Region 2 Yellow sea 31-40 122-126
Region 3 East sea 36-42 130-138
Region 4 South of Japan 26-32 128-136
Region 5 Pacific ocean 26-42 142-152
China
Beijing Urban 39.6 116.2
Tianjin Urban 39.1 117.2
Shijiazhuang Urban 38.0 114.5
Zhengzhou Urban 34.8 113.7
Qingdao Urban 36.1 120.4
Nanjing Urban 32.1 118.8
Nantong Urban 32.0 120.9
Shanghai Urban 31.2 121.5
Korea
Seoul Urban 37.6 126.9
Gosan Background 33.3 126.2
Japan
Rishiri Background 45.2 141.2
Sado-seki Background 38.0 138.4
Oki Background 36.3 133.3
Yusuhara Background 33.4 132.9
Hedo Background 26.9 128.3
Figure 2. Monthly variation of MODIS-derived AOD at wavelength of 550 nm and Å at wavelength of 470 nm and 660 nm for region 1 (Top) to 5 (Bottom), during 2004-2014.
Table 2. Slope of the trends of the AOD and Å calculated with LMS method for 2004-2014.
Changes in slope in % over the entire data period where calculated from the LMS slope in order to allow comparison between two aerosol optical properties.
3.2 Comparison of trends in columnar aerosol optical depth and ground-level particulate matter mass concentration
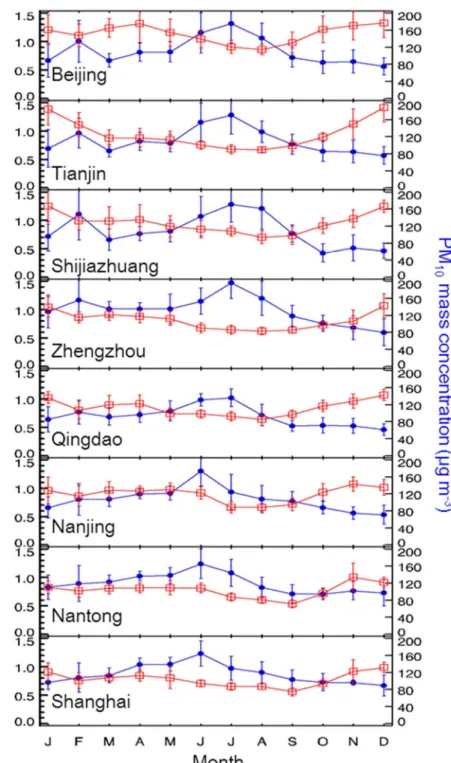
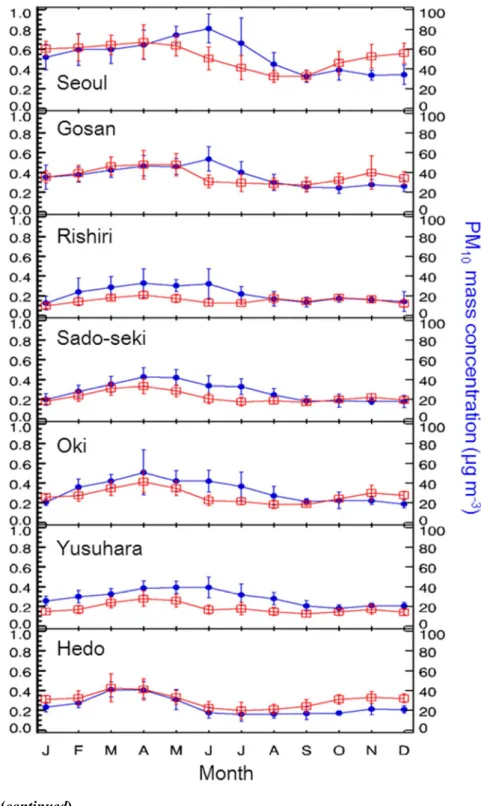
Fig. 3 shows the monthly mean MODIS C6 AOD and PM10 mass concentrations observations for 15 stations, with one standard deviation error bars of each aerosol property. MODIS AOD and PM10 mass concentrations for stations in China, especially Beijing, Tianjin, and Shijiazhuang, were approximately 37 % higher than those for stations in Korea and Japan. Background stations, however, show the lowest AOD and PM10 mass concentration of about 0.3 and 25 μg m-3, respectively. In general, the
Region
MODIS AOD Å Trend (% per year)
Mean Trend
(% yr-1) Mean Trend
(% yr-1)
1 0.73 1.18 1.03 0.98
2 0.47 0.02 1.17 0.42
3 0.31 -0.33 1.06 0.83
4 0.26 0.03 0.80 0.11
5 0.21 0.36 0.83 0.05
* Trends within 95 % confidence level are expressed in bold type.
maximum value of AOD appeared around June, which is explained by a complex combination of various processes such as stationary continental air mass over China, increase in solar flux that form secondary fine aerosol particles, enhanced hygroscopic growth of fine hydrophilic aerosols, and increase in biomass burning (Kim et al., 2007).
The peak of AOD in Japan tends to be slightly offset from main land in East Asia due to the expansion of north polar high pressure around April in Pacific Ocean east of Japan.
PM10 mass concentration reached maximum during winter season due to combinations of fossil fuel usage for domestic heating, frequently occurring stagnant weather, and intensive temperature inversion (Li et al., 2008; He et al., 2001; Xia et al., 2006; Chan and Yao, 2008). High PM10 mass concentration as well as AOD was also shown at spring season due to dust events (Wang et al., 2004).
Figure 3. Seasonal variation of MODIS-derived AOD at wavelength of 550 nm (closed circle) and PM10 mass concentration (open square) with one standard deviation error bar over selected stations.
Figure 3. (continued)
Figure 3. (continued)
Trends of AOD and PM10 mass concentration have been calculated on 15 stations in East China, Korea, and Japan and are confirmed by LMS method and decision rule (Fig.
4). Overall time series of AOD and PM10 mass concentration for each station is presented in Figs. S1 and S2. In the East China, AOD trends are derived for 8-station.
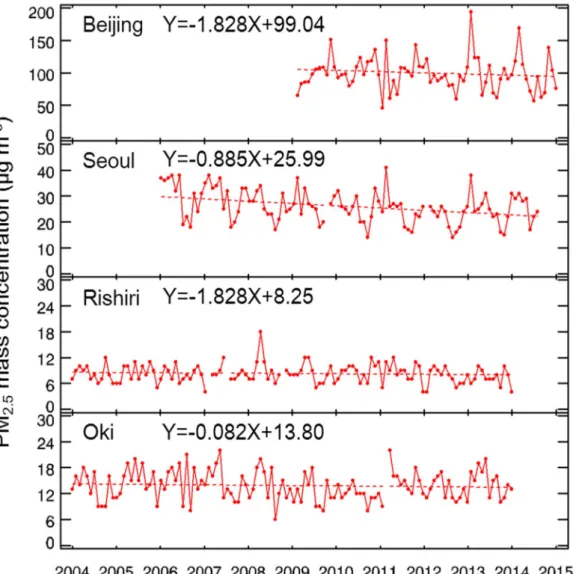
Increasing AOD trends are observed for all 8-stations of about +0.80 % yr-1over 2004- 2014. This increasing AOD trend in eight of the urban stations is well projected in the AOD trend over region 1 (Table2: 1.18 % yr-1). In contrast, PM10 mass concentration has increasing trend of about -1.53 % yr-1 for 7 stations expect for Zhengzhou with increasing trend of +0.47 % yr-1. The increase in PM10 mass concentration may have contributed to large increase in AOD in Zhengzhou station. The Korea sites of Seoul and Gosan have AOD trend of 0.40 % yr-1 and 0.04 % yr-1, respectively, and PM10 mass concentration trend of -2.77 % yr-1. At 5-station in Japan, both AOD and PM10 mass concentration have decreased over the past 11 years. Also, trends of PM2.5 mass concentration over few stations in China (Beijing), Korea (Seoul) and Japan (Rishiri and Oki) were analyzed (Table 3, Fig. 5). All the PM2.5 mass concentration measuring stations show decreasing trend, although, only Seoul station are statistically significant.
This result suggests that the air quality in East Asia have improved over the past decade but the effects of aerosols on radiation budget are still significant. Further discussion will be given at Section 3.4.
Figure 4. LMS trend results for AOD during 2004-2014 and PM10 mass concentration over 2004-2012 (China), 2004-2014 (Korea), and 2003-2013 (Japan). Filled bar correspond to statistically significant trends within 95% confidence level.
Figure 5. Monthly mean of PM2.5 mass concentration in China (Beijing), Korea (Seoul), and Japan (Rishiri and Oki) in data period 2009-2014, 2006-2014, and 2004-2014, respectively.
Table 2. LMS trends of PM2.5 mass concentration measured by surface observation over stations Beijing, Seoul, Rishiri, and Oki.
Station mean trend (% yr-1) Significance
Beijing 99.04 -0.88 1.96
Seoul 25.99 -2.53 7.60
Rishiri 8.25 -0.70 1.29
Oki 13.80 -0.54 0.70
* Trends within 95 % confidence level are expressed in bold type.
3.3 Changes of vertically resolved column aerosol optical depth from lidar measurements at and East China and Seoul
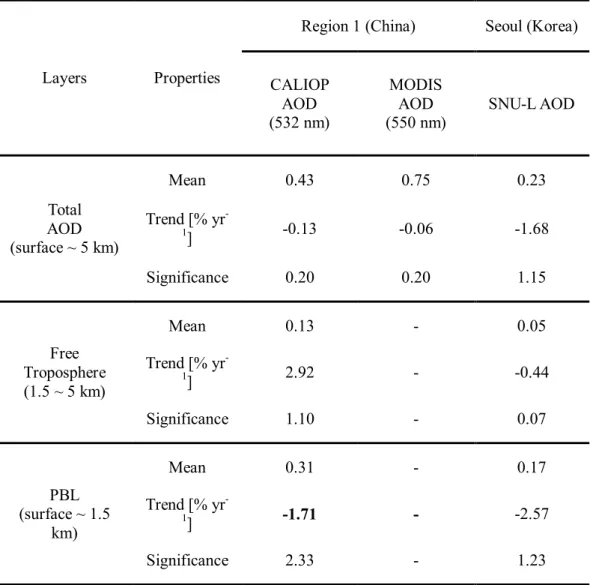
Vertically resolved aerosol profile is derived from space-borne lidar CALIOP over East China (Region 1) to analyze aerosol loading trend of individual layers. Fig. 6a show CALIOP AOD for each layer, planetary boundary layer (PBL-AOD), free troposphere (FT-AOD), and total AOD (TC). These layers are distinguished by the criteria that the aerosol vertical profiles show most of aerosol loading within the 1 ~ 2 km altitude than in the free atmosphere (Kim et al., 2007). The general trends for both CALIOP TC and MODIS AOD have increasing trend of -0.13 % yr-1 and -0.06 % yr-1 over 2007-2014 (Table 4).
The trend analysis of aerosol extinction from ground-level lidar measurements has been performed in Seoul (Fig. 6b). Vertical aerosol extinction profile is calculated into AOD for each layers, PBL-AOD, FT-AOD, and TC, where trends are observed as
–2.57 % yr-1, -0.44 % yr-1, -1.68 % yr-1 , respectively (Table 4). In contrast, MODIS- AOD and ground-level PM10 mass concentration in Seoul has a trend of +0.87 % yr-1 and -3.55 % yr-1, respectively, during 2007 - 2014.
Table 4. LMS trend of Lidar derived AOD for layers, surface to 5 km (TC), free troposphere (FT-
AOD), and planetary boundary layer (PBL-AOD) by space borne CALIOP lidar(2007-2014), MODIS column AOD (2007-2014), and ground based SNU-L (2006-2014).
Layers Properties
Region 1 (China) Seoul (Korea)
CALIOP AOD (532 nm)
MODIS AOD (550 nm)
SNU-L AOD
Total AOD (surface ~ 5 km)
Mean 0.43 0.75 0.23
Trend [% yr-
1] -0.13 -0.06 -1.68
Significance 0.20 0.20 1.15
Free Troposphere (1.5 ~ 5 km)
Mean 0.13 - 0.05
Trend [% yr-
1] 2.92 - -0.44
Significance 1.10 - 0.07
PBL (surface ~ 1.5
km)
Mean 0.31 - 0.17
Trend [% yr-
1] -1.71 - -2.57
Significance 2.33 - 1.23
Figure 6. Time series of lidar-derived monthly mean AOD from (a) CALIOP of each layer with
MODIS-derived column AOD of region 1 in open square over 2006-2014, and (b) SNU-L (Seoul) of each layer in closed circle. Upper figure indicates total AOD (TC), middle is AOD estimated for free troposphere (FT-AOD), and bottom is AOD estimated for planetary boundary layer (PBL-AOD) with dotted linear fit line during 2007-2014.
3.4 Discussion
Multi-year MODIS, ground-based particulate matter mass concentration, CALIOP, and ground-level lidar measurements revealed increasing AOD trend in East China, decreasing AOD trend in downwind of East China coast and Japan, and mostly decreasing PM10 mass concentration over East Asia. Particularly, significant decreasing PBL-AOD trend were shown in region 1 and Seoul. In contrast, an increasing FT-AOD trend where shown in region 1 and decreasing trend where shown in Seoul. The possible reasons for this inhomogeneous AOD and PM10 mass concentration trends can be explained by the followings:
1) The AOD over main industrial region of East China were influenced by the change in surface wind speed. Lin et al. (2013) reported that surface wind speed at East coast of China show decreasing trend during 2002-2009 (Fig. 7). Low wind speed satisfies stagnant atmospheric condition that is favorable for accumulation of pollution aerosols in a regional scale. As a result, decreasing surface wind speed trends can explain the increase of AOD in main industrial region in East China and decreasing AOD trend in the background stations in Korea and Japan.
2) Additionally, change in precipitation pattern may contribute to the occurrence of increasing trend in total AOD. Most important contribution of decreasing trend of aerosol wet deposit is from decrease in total rainy days. Gong et al. (2004) and Fu et al.
(2008) reported that rain days are highly correlated to the light-rain days. Also, Huang and Wen (2013) reported a distinct decrease of light rain over East China in summer as well as winter during 1961-2010. The reduction in precipitation frequency giving less
chance of aerosol wet deposal in East China which cause increase in aerosol amount.
3) An increase in AOD over East China is possibly connected to the weakened East Asian summer monsoon over the past few decades. Ding et al. (2008) reported that a weakened tropical upper-level easterly jet has contributed to weakening East Asia summer monsoon, as a result, the precipitation in coast of East China have decreased over the past decade. Therefore, it can be concluded that the aerosol washout effect has much less impact and perhaps increased the column aerosol loading in East Asia over Figure 7. Spatial distribution of China Meteorological Administration (CMA) surface wind speed trends during 2002-2009. The positive and negative trends are marked by regular triangles and invertes triangles, respectively. The filled triangle indicates that the trend at this station is statistically significant (P<0.05). [Source : Lin et al. (2013)]
that the reason for weakening East Asian summer monsoon are due to the linear cooling in upper troposphere that have changed large-scale circulation over the China continent.
Changed circulation allows more aerosols lifted up into FT from surface that could possibly increase FT -AOD.
4) The atmospheric and hydrological cycle due to the climate change may have contributed to the trends in vertical aerosol loadings. For example, Yang et al. (2012) reported that strong Tibetan Plateau thermal forcing is experiencing the climate change such as, surface air warming and moistening, solar dimming, and wind stilling, which will supplement for deeper clouds. Therefore, frequency of deep convection will increase. As a result, deep convection allows more aerosol lift up to FT causing increase of AOD in the FT.
CHAPTER 4. SUMMARY AND CONCLUSION
Aerosol optical properties observed from moderate resolution imaging spectroradiometer (MODIS) ground-based particulate matter (PM) mass concentration measurements, cloud-aerosol lidar with orthogonal polarization (CALIOP), and ground- based lidar (SNU-L) in Seoul, Korea, were analyzed in order to evaluate the seasonal and annual changes of aerosol optical depth (AOD) and PM10 mass concentration over East Asia, and relationship between aerosol optical properties. Also, the contribution of aerosol in free troposphere and planetary boundary layer to total AOD are discussed.
The main conclusions of the study can be summarized as follows:
1. Eleven-year MODIS measurements show mostly increasing AOD trend as well as Å trend, especially over the east coastal industrialized region in China, of 1.18 % yr-1 and 0.98 % yr-1, respectively.
2. Seasonal and monthly variation of AOD show maximum value at April-July over East Asia, which were related to progress of summer monsoon rain band and stationary continental air mass on the northeast of Asia.
3. Increasing trends of AOD were found for eight China stations (0.80 % yr-1), Seoul, Korea (0.40 % yr-1), but no trend were shown in Gosan station and decreasing trend was shown in Japan (-0.42 % yr-1). Decreasing PM10 mass concentration trend were shown in China, Korea, and Japan of -1.28 % yr-1, - 2.77 % yr-1, and -2.03 % yr-1, respectively. Also, PM2.5 mass concentration show significant decreasing trend of about -1.16 % yr-1 over East Asia. Interestingly,
significant decreasing trend in surface PM10 and PM2.5 mass concentration over China stations (-1.28 % yr-1) do not agreed well with the trends of MODIS- derived AOD (0.80 % yr-1).
4. AOD estimated for planetary boundary layer (PBL-AOD) from CALIOP measurements over East China show decreasing trend of -1.71 % yr-1, wherever AOD estimated for free troposphere (FT-AOD) show increasing trend of 2.92 % yr-1. In addition, ground-level lidar in Seoul (SNU-L) show decreasing PBL-AOD trend of -2.57 % yr-1 and increasing FT-AOD trend of -0.40 % yr-1. 5. Significant decreasing PBL-AOD and increasing FT-AOD trend is attributable to
the relative contribution of complex processes that possibly include change in surface wind speed, total rainy days, atmospheric and hydrological cycle, and East Asian summer monsoon over East Asia.
In addition to ground-based and space borne lidar instrument, future studies should investigate on the trends of aerosol vertical profile and each layers aerosol optical properties possibly by model simulation. In addition, further investigations on decadal change of chemical composition from Chemical transport model can improve the results in such instances.
REFERENCES
Chan, C. K. and Yao, X. H.: Air pollution in mega cities in China, Atmos. Environ., 42, 1–42, 2008.
Charlson, R. J., Schwartz, S. E., Hales, J. M., Cess, R. D., Coakley, Jr., J. A., Hansen, J.
E., and Hoffman, D. J.: Climate forcing by anthropogenic aerosols, Science, 255, 423–430, doi:10.1126/science.255.5043.423, 1992.
Choi, Y.-S., C.-H. Ho, J. Kim, D.-Y. Gong, and R.J. Park.: The impact of aerosols on the summer rainfall frequency in China, J. Appl. Meteorol. Climatol., 47, 1802–1813, 2009.
Collaud Coen, M., Andrews, E., Asmi, A., Baltensperger, U., Bukowiecki, N., Day, D., Fiebig, M., Fjaeraa, A. M., Flentje, H., Hyvärinen, A., Jefferson, A., Jennings, S. G., Kouvarakis, G., Lihavainen, H., Lund Myhre, C., Malm, W. C., Mihapopoulos, N., Molenar, J. V., O'Dowd, C., Ogren, J. A., Schichtel, B. A., Sheridan, P., Virkkula, A., Weingartner, E., Weller, R., and Laj, P.: Aerosol decadal trends – Part 1: In-situ optical measurements at GAW and IMPROVE stations, Atmos. Chem. Phys., 13, 869-894, doi:10.5194/acp-13-869-2013, 2013.
Ding, Y., Wang, Z., and Sun, Y.: Inter-decadal variation of the summer precipitation in East China and its association with decreasing Asian summer monsoon. Part I:
Observed evidences, Int. J. Climatol., 28, 1139–1161, doi: 10.1002/joc.1615, 2008.
Fu J., Qian, W., Lin, X., and Chen, D.: Trends in graded precipitation in China from 1961 to 2000. Adv Atmos Sci 25(2):267–278, 2008.
Gong, D. Y., Shi, P. J., and Wang, J. A.: Daily precipitation changes in the semi-arid
region over northern China. J Arid Environ 59(4):771–784, 2004.
He, K. B., Yang, F. M., Ma, Y. L., Zhang, Q., Yao, X. H., Chan, C. K., Cadle, S., Chan, T., and Mulawa, P.: The characteristics of PM2.5 in Beijing, China, Atmos.
Environ., 35, 4959–4970, 2001.
Huang, G. and Wen, G. H.: Spatial and temporal variations of light rain days over China and the mid-high latitudes of the northern hemisphere. Chin Sci Bull 58(12):1402–
1411, 2013.
Klimont, Z., Cofala, J., Xing, J., Wei, W., Zhang, C., Wang, S., Kejun, J., Bhandari, P., Mathura, R., Purohit, P., Rafaj, P., Chambers, A., Amann, M., and Hao, J.:
Projections of SO2, NOx, and carbonaceous aerosols emissions in Asia, Tellus, 61B, 602–617, doi:10.1111/j.1600-0889.2009.00428.x, 2009.
Kim, M.-H., Yoon, S.-C., Kim, S.-W., Sugimoto, N., and Shimizu, A.: Comparison of Vertical Extinction Profiles Obtained from 2 Ground-Based Mie-Scattering Lidars at Gosan, Korea during ABC-EAREX2005, 23rd International Laser Radar Conference, Nara, Japan, 449–450, 2006.
Kim, S. –W., S. C. Yoon, J. Kim, and S. –Y. Kim.: Seasonal and monthly variations of columnar aerosol optical properties over east Asia determined from multi-year MODIS, LIDAR, and AERONET Sun/sky radiometer measurements, Atmos.
Environ., 41, 1634-1651, 2007.
Li, J., Zhuang, G. S., Huang, K., Lin, Y. F., Xu, C., and Yu, S. L.: Characteristics and sources of air-borne particulate in Urumqi, China, the upstream area of Asia dust, Atmos. Environ., 42, 776– 787, 2008.
Liu, Y., J. A. Sarnat, B. A. Coull, P. Koutrakis, and D. J. Jacob.: Validation of Multiangle
Imaging Spectroradiometer (MISR) aerosol optical thickness measurements using Aerosol Robotic Network (AERONET) observations over the contiguous United States, J. Geophys. Res., 109, D06205, doi:10.1029/2003JD003981, 2004.
Liu, X., Penner, J. E., and Herzog, M.: Global simulation of aerosol dynamics: Model description, evaluation, and interactions between sulphate and nonsulphate aerosols, J. Geophys. Res., 110(D18), D18206, doi:10.1029/2004JD005674, 2005.
Liu, X., Penner, J. E., Das, B., Bergmann, D., Rodriguez, J. M., Strahan, S., Wang, M., and Feng, Y.: Uncertainties in global aerosol simulations: Assessment using three meteorological datasets, J. Geophys. Res., 112, D11212, doi:10.1029/2006JD008216, 2007.
Lu, Z., Zhang, Q., and Streets, D. G.: Sulfur dioxide and primary carbonaceous aerosol emissions in China and India, 1996–2010, Atmos. Chem. Phys., 11, 9839–9864, doi:10.5194/acp-11-9839- 2011, 2011.
Pope, C. A. III, Dockery, D. W., and Schwartz, J.: Review of epidemiological evidence of health effects of particulate air pollution, Inhulution Toxicol, 7, 1-18, 1995.
Omar, A. H., D. M. Winker, J. L. Tackett, D. M. Giles, J. Kar, Z. Liu, M. A. Vaughan, K.
A. Powell, and C. R. Trepte.: CALIOP and AERONET aerosol optical depth comparisons: One size fits none, J. Geophys. Res. Atmos., 118, 1-19, doi:10.1002/jgrd.50330, 2013.
Qu, W. J., Arimoto, R., Zhang, X. Y., Zhao, C. H., Wang, Y. Q., Sheng, L. F., and Fu, G.:
Spatial distribution and interannual variation of surface PM10 concentrations over eighty-six Chinese cities, Atmos. Chem. Phys., 10, 5641-5662, doi:10.5194/acp-10- 5641-2010, 2010.
Remer, L. A., Kaufman, Y. J., Tanre, D., Mattoo, S., Chu, D. A., Martins, J. V., Li, R. R., Ichoku, C., Levy, R. C., Kleidman, R. G., Eck, T. F., Vermote, E., and Holben, B.
N.: The MODIS aerosol algorithm, products, and validation, J. Atmos. Sci., 62, 947-973, doi:10.1175/JAS3385.1,2005.
Richter, A., Burrows, J.P., Hendrik Nu¨ß, H., Granier, C., Niemeier, U.: Increase in tropospheric nitrogen dioxide over China observed from space, Nature, 437, 129–
132, 2005.
Sayer, A. M., N. C. Hsu, C. Bettenhausen, and M.-J. Jeong: Validation and uncertainty estimates for MODIS Collection 6 “Deep Blue” aerosol data, J. Geophys. Res.
Atmos., 118, 7864–7872, doi:10.1002/jgrd.50600, 2013.
Seo, S., J. Kim, H. Lee, U. Jeong, B. N. W. Kim, B. N. Holden, S.-W. Kim, C. H. Song, and J. H. Lim.: Estimation of PM10 concentrations over Seoul using multiple empirical models with AERONET and MODIS data collected during the DRAGON-Asia campaign, Atmos. Chem. Phys., 15, 319-334, 2015.
Shimizu, A., Sugimoto, N., Matsui, I., Arao, K., Uno, I., Murayama, T., Kagawa, N., Aoki, K., Uchiyama, A., and Yamazaki, A.: Continuous observations of Asian dust and other aerosols by polarization lidar in China and Japan during ACE-Asia, J.
Geophys. Res., 109, D19S17, doi:10.1029/2002JD003253, 2004.
Sugimoto, N., Matsui, I., Shimizu, A., Uno, I., Asai, K., Endoh, T., and Nakajima, T.:
Observation of dust and anthropogenic aerosol plumes in the Northwest Pacific with a two-wavelength polarization lidar on board the research vessel Mirai, Geophys. Res. Lett., 29, 1901, doi:10.1029/2002GL015112, 2002.
Sugimoto, N., Shimizu, A., Matsui, I., Itsushi, U., Arao, K., Chen, Y., Zhao, S., Zhou, J.,
and Lee, C.-H.: Study of Dust Transport Using a Network of Continuously Operated Polarization Lidars, Water Air Soil Poll., 5, 145–157, 2005.
Sugimoto, N., Shimizu, A. Matsui, I., Dong, X., Zhou, J., Bai, X., Zhou, J., Lee, C. H., Yoon, S.-C., Okamoto H., and Uno I.: Network Observations of Asian Dust and Air Pollution Aerosols Using Two-Wavelength Polarization Lidars, 23rd International Laser Radar Conference, Nara, Japan, 851–854, 2006.
Tiao, G. C., Reinsel, G. C., Xu, D., Pedrick, J. H., Zhu, X., Mler, A. J., DeLuisi, J. J., Mateer, C. L., and Wuebbles, D. J.: Effects of autocorrelation and temporal sampling schems on estimates of trend and spatial correlation, J. Geophys. Res., 95, 20507-20517, 1990.
Tie, X., Wu, D., and Brasseur, G.: Lung cancer mortality and exposure to atmospheric aerosol particles in Guangzhou, China Atmospheric Environment, 43, 2375–2377, 2009.
Wang, D., Wang, Y. Q., and Cheng, Y.: Characterization of soil dust aerosol in China and its transport/distribution during 2001 ACE-Asia: 1. Network observations, J.
Geophys. Res., 108(D9), 4261, doi:10.1029/2002JD002632, 2003.
Wang, G., Hu, S., Xie, M., and Zhou, B.: Water-soluble inorganic ions and organic carbon of PM10 aerosols in Baoji, an inland city of China, Atmos. Res., under review, 2010.
Wang, K. C., Dickinson, R. E., and Liang, S. L.: Clear sky visibility has decreased over land globally from 1973 to 2007, Science, 323(5920), 1468–1470, 2009.
Wang, Y. Q., Zhang, X. Y., Arimoto, R., Cao, J. J., and Shen, Z. X.: The transport pathways and sources of PM10 pollution in Beijing during spring 2001, 2002 and
2003, Geophys. Res. Lett., 31, L14110, doi:10.1029/2004GL019732, 2004.
Wang, L., Li, Z. Q., Li, D. H., Li, K. T., Tian, Q. J., Li, L., Zhang, Y., Lu, Y., and Gu, X.
F.: Retrieval of Dust Fraction of Atmospheric Aerosols Based on Spectra Characteristics of Refractive Indices Obtained from Remote Sensing Measurements, Spectrosc. Spect. Anal., 32, 1644–1649, doi:10.3964/j.issn.1000- 0593(2012)06- 1644-06, 2012.
Weatherhead, E. C., Reinsel, G. C., Tiao, G. C., Meng, X.-L., Choi, D., Cheang, W.-K., Keller, T., DeLuisi, J., Wuebbles, D. J., Kerr, J. B., Miller, A. J., Oltmans, S. J., and Frederick, J. E.: Factors affecting the detection of trends: Statistical considerations and applications to environmental data, J. Geophys. Res., 103, 17149– 17161, doi:10.1029/98JD00995, 1998.
Winker, D. M., M. A. Vaughan, A. Omar, Y. Hu, K. A. Powell, Z. Liu, W. H. Hunt, and S.
A. Young: Overview of the CALIPSO mission and CALIOP data processing algorithms, J. Atmos. Oceanic Technol., 26, 2310‐2323, doi:10.1175/2009JTECHA1281.1, 2009.
Weatherhead, E. C., Reinsel, G. C., Tiao, G. C., Jackman, C. H., Bishop, L., Hollandsworth, F. S. M., DeLuisi, J., Keller, T., Oltmans, S. J., Flemming, E.
L.,Wuebbles, D. J., Kerr, J. B., Miller, A. J., Herman, J., McPeters, R., Nagatani, R.
M., and Frederick, J. E.: Detecting the recovery of total column ozone, J. Geophys.
Res., 105, 22201–22210, 2000.
Xia, X. A., Chen, H. B., Wang, P. C., Zhang, W. X., Goloub, P., Chatenet, B., Eck, T. F., and Holben, B. N.: Variation of columnintegrated aerosol properties in a Chinese urban region, J. Geophys. Res., 111, D05204, doi:10.1029/2005JD006203, 2006.
Yang, K., Ding, B., Qin, J., Tang, W., Lu, N., Lin, C.,: Can aerosol loading explain the solar dimming over the Tibetan Plateau? Geophys. Res. Lett. 39, L20710.
http://dx.doi.org/10.1029/2012GL053733, 2012.
Yap, X.Q., and Hashim, M.: A robust calibration approach for PM10 prediction from MODIS aerosol optical depth, Atmos. Chem. Phys., 13, 3517–3526, http://dx.doi.org/10.5194/acp-13-3517-2013, 2013.
Young, S. A., M. A. Vaughan, R. E. Kuehn, and D. M. Winker.: The retrieval of profiles of particulate extinction from Cloud-Aerosol Lidar Infrared Pathfinder Satellite Observations (CALIPSO) data: Uncertainty and error sensitivity analyses, J. Atmos.
Oceanic Technol., 30, 395–428, doi:10.1175/JTECH-D-12-00046.1, 2013.
Yu, R., Wang, B., and Zhou, T.: Tropospheric cooling and summer monsoon weakening trend over East Asia, Geophys. Res. Lett., 31, L22212, doi:10.1029/2004GL021270, 2004.
Zhang, X. Y., Gong, S. L., Shen, Z. X., Mei, F. M., Xi, X. X., Liu, L. C., Zhou, Z. J., Wang, D., Wang, Y. Q., and Cheng, Y.: Characterization of soil dust aerosol in China and its transport/distribution during 2001 ACE-Asia: 1. Network observations, J. Geophys. Res., 108(D9), 4261, doi:10.1029/2002JD002632, 2003.
Zheng, M., Wang, F., Hagler, G. S. W., Hou, X., Bergin, M. H., Cheng, Y., Salmon, L. G., Schauer, J. J., Louie, P. K. K., Zeng, L., and Zhang, Y.: Sources of excess urban carbonaceous aerosol in the Pearl River Delta Region, China, Atmos. Environ., 45, 1175–1182, 2011.
SUPPLIMENTARY
Figure S1. Monthly variations of MODIS-derived aerosol optical depth (AOD) with linear fit line shown in dotted line for selected 8-station in China.
Figure S1. (continued) for selected 2-station in Korea and 5-station in Japan.
Figure S2. As in Fig. S1, but for PM10 mass concentration in 8-sation in China.
Figure S2. (Continued) for selected 2-station in Korea and 5-station in Japan.
Figure S3. (a) Column AOD monthly mean of MODIS (black line) and AERONET lev 2.0 AOD
(red filled circle) in Beijing, China. (b) MODIS AOD (black line) and AERONET AOD in Shirahama (red cross) and Osaka (blue square). Correlation between MODIS and AERONET AODs (550 nm) at (c) Beijing and (d) Yusuhara. The validation of MODIS and AERONET AOD that are used in this study are conducted to reduce uncertainties in the trend analysis. Although, global comparison of MODIS and AERONET AOD at wavelength of 550 nm show great
correlation of R=0.92 in Sayer et al., (2013). This study have used 1°x1° spatial range MODIS- derived AOD that are way bigger than ground-based stations which shows correlation of 0.68, 0.72, 0.83 for Beijing, Osaka , and Shirahama, respectively, with fair amount of agreement.
국문 초록
동아시아 지역의 에어로졸 광학두께와 지표 입자질량농도 변화 연구
남 지 현 지구환경과학부 서울대학교 대학원
본 연구는 다양한 에어로졸 광학 특성의 변화를 조사하기 위해 2004년부 터 2014년까지의 위성자료인 moderate resolution imaging spectroradiometer (MODIS), cloud-aerosol lidar with orthogonal polarization (CALIOP), 지상관측 자료인 light detection and ranging (Lidar) 의 관측자료인 에어로졸 광학두께와 옹스트롬 지수 그리고 지표입자 질량농 도 자료를 사용하였다. 각 추세의 유의성을 감정하기 위해 least mean square (LMS) fit 방법을 사용하였다. 지난 11년간의 MODIS 자료에 의하면 에어로졸 광학두께와 옹스트롬 지수가 모두 증가하는 추세를 보이는데, 특히 중국 동쪽 해안을 따라 분포된 주요 산업지대 에서는 에어로졸 광학두께가 1.18 % yr-1, 옹스트롬 지수가 0.98 % yr-1 증가하는 것으로 확인되었다. 동 아시아의 에어로졸 광학두께의 4월에서 6월까지 가장 높은 값을 보이는데, 이는 여름철 몬순 강우띠의 이동과 아시아의 북동쪽의 정지된 대륙성 기단에
의한 영향으로 사료된다. 동아시아의 에어로졸 광학두께의 11년간의 변동 추 세를 비교해 본 결과 중국은 0.80 % yr-1, 한국은 0.40 % yr-1로 기간 경과 에 따라 미세하게 증가하는 경향을 보이고 일본은 -0.42 % yr-1로 미세하게 감소하는 경향을 보였다. 그에 반해 미세먼지 지표입자 (PM10)질량농도는 중국은 -1.28 % yr-1, 한국은 -2.77 % yr-1, 그리고 일본은 -2.03 % yr-1로 전체적으로 감소 중인 것으로 나타나 에어로졸 광학두께와 뚜렷한 차 이를 보였다. 또한, 동아시아 초미세먼지 지표입자 (PM2.5) 질량농도는 약 - 1.16 % yr-1정도 감소하는 경향을 보였다. 흥미롭게도, 동중국의 지표입자 질량농도 (PM10, PM2.5)는 -1.28 % yr-1으로 뚜렷한 감소를 보이는 반면 에 어로졸 광학두께는 0.80 % yr-1 증가하는 것으로 나타났다. CALIOP 라이다 자료에서 계산된 동중국의 행성 경계층과 대류권에서의 에어로졸 광학두께 의 추세는 각각 -1.71 % yr-1, 2.92 % yr-1을 보였고, 서울의 lidar에서 계 산된 두 층의 추세는 -2.57 % yr-1, -0.40 % yr-1으로 나타났다. 행성 경계 층에서 감소하는 에어로졸 광학두께와 달리 증가하거나 미세하게 감소하는 대류권의 에어로졸 광학두께는 지면풍속, 강우일, 대기와 물 순환, 동아시아 의 여름철 장마 경향의 변화로 인한 복합적 영향을 받았을 것으로 추정된다.
주 요 어 : 지표입자 질량농도, 에어로졸 광학두께, MODIS, 라이다, 동아시아
학 번 : 2013-22972