저작자표시-비영리-변경금지 2.0 대한민국 이용자는 아래의 조건을 따르는 경우에 한하여 자유롭게
l 이 저작물을 복제, 배포, 전송, 전시, 공연 및 방송할 수 있습니다. 다음과 같은 조건을 따라야 합니다:
l 귀하는, 이 저작물의 재이용이나 배포의 경우, 이 저작물에 적용된 이용허락조건 을 명확하게 나타내어야 합니다.
l 저작권자로부터 별도의 허가를 받으면 이러한 조건들은 적용되지 않습니다.
저작권법에 따른 이용자의 권리는 위의 내용에 의하여 영향을 받지 않습니다. 이것은 이용허락규약(Legal Code)을 이해하기 쉽게 요약한 것입니다.
Disclaimer
저작자표시. 귀하는 원저작자를 표시하여야 합니다.
비영리. 귀하는 이 저작물을 영리 목적으로 이용할 수 없습니다.
변경금지. 귀하는 이 저작물을 개작, 변형 또는 가공할 수 없습니다.
MASTER DISSERTATION
Nanosheets of 2D Ni-based Metal-Organic Framework for
Oxygen Evolution Reaction
이차원 니켈 기반 금속유기구조체 기반의 산소발생반응 촉매
By
Min Kyung Lee
February 2021
DEPARTMENT OF MATERIALS SCIENCE AND ENGINEERING
COLLEGE OF ENGINEERING
SEOUL NATIONAL UNIVERSITY
Nanosheets of 2D Ni-based Metal- Organic Framework for Oxygen
Evolution Reaction
Advisor: Prof. Ho Won Jang
By
Min Kyung Lee
A thesis submitted to the Graduate Faculty of Seoul National University in partial fulfillment of the requirements for the Degree of Master
Department of Materials Science and Engineering
February 2021
Approved by
Chairman of Advisory Committee: Seung-Kyun Kang
Vice-Advisory Committee: Ho Won Jang
Advisory Committee: Hyejin Jang
1
Abstract
Two-dimensional (2D) metal-organic framework (MOF) nanosheets Ni-NDC MOF (NDC= naphthalene-2,6-dicarboxylic acid) are prepared by a facile surfactant- assisted one-pot hydrothermal synthesis. The obtained ultrathin 2D Ni-MOF nanosheets are extremely thin, which contributes to their excellent electrical properties. These unique nanostructures make them good candidates as electrode materials for high-performance water splitting catalysts to enlarge the active sites and enhance stability. In a three-electrode system, 2D Ni-MOF@NF had an overpotential of 160 mV at 10 mA cm-2 and a Tafel slope of 19 mV dec-1. To utilize this outstanding characteristic, NiMo was deposited on MOF@NF to fabricate a bifunctional catalyst. NiMo proved not to disturb the OER performance of MOF and improve the HER catalytic performances, resulting in 1.56 V overpotential at 20 mA cm-2 at a two-electrode system. This remarkable value is comparable to conventional catalysts such as Pt/C and IrO2. More importantly, the NiMo/MOF@NF exhibits almost no degradation after 1000 cycles of linear sweep voltammetry and long term stability test under constant voltages. The 2D Ni-MOF nanosheets, combined with NiMo alloy, offers superior performance in alkaline condition with outstanding electrochemical activity and high durability.
Keywords: metal-organic framework, 2D material, oxygen evolution reaction, hydrogen evolution reaction, water splitting, bifunctional catalyst
Student Number: 2019-20391
Min Kyung Lee
2
Table of Contents
Abstract ... 1
Table of Contents ... 2
List of Tables ... 3
List of Figures ... 4
Chapter 1 Electrochemical catalysts: Mechanisms and metal-organic frameworks ... 6
1.1 Background ... 7
1.2 Electrochemical catalysts ... 9
1.3 Metal-organic frameworks ... 10
1.3.1 Introduction ... 10
1.3.2 Top-down and Bottom-up synthesis of 2D MOF nanosheets ... 12
1.3.3 Unique properties ... 15
1.4 References ... 16
Chapter 2 Direction-controlled growth of 2D Ni-MOF nanosheets on nickel foam ... 21
2.1 Introduction ... 22
2.2 Experimental Procedures ... 23
2.3 Results and Discussion ... 26
2.3.1 The structure of Ni-NDC ... 26
2.3.2 Electrochemical performance of Ni-NDC@NF & NiMo/MOF@NF ... 34
2.4 Conclusion ... 47
2.5 References ... 48
Abstract in Korean ……….. 49
3
List of Tables
Table 1. List of OER catalysts and their electrochemical activities.
Table 2. List of the two-electrode system and their potential value at a current density of 20 mA cm-2.
4
List of Figures
Figure 1. The SEM images of Ni-NDC nanosheets on NF, synthesized (a) without and (b) with PVP surfactant.
Figure 2. The SEM images of (a,b) Ni-NDC@NF and (c) NiMo/MOF@NF.
Figure 3. XRD patterns of MOF@NF and MOF powder compared to the simulated pattern from crystal data.
Figure 4. Rietveld refinement of X-ray powder diffraction data of Ni-NDC MOF.
Figure 5. (a) FT-IR spectra of NiFe-MOF powder and NDC powder. (b)Ni 2p and O 1s spectrum of Ni-NDC powder.
Figure 6. TEM image of Ni-NDC nanosheets and its element mapping for the selected area.
Figure 7. The TEM image of single-layer NiFe-NDC MOF and its d space value of (100) plane.
Figure 8. The crystal structure of Ni-NDC. The color scheme for atom representation:
green for Ni, orange for O, purple for C, and pink for H.
Figure 9. Electrochemical measurements of MOF@NF, NiMo/MOF@
NF, and bare NF. (a) OER LSV curves in 1.0 M KOH at a scan rate of 5 mV s-1. (b) Tafel plots. (c) Nyquist plots measured at 1.48 V vs. RHE.
Figure 10. Electrochemical measurements of MOF@NF, NiMo/MOF@
NF, and Pt plate. (a) HER LSV curves in 1.0 M KOH at a scan rate of 5 mV s-1. (b) Tafel plots. (c) Nyquist plots measured at -0.12 V vs. RHE.
Figure 11. Comparison of O 1s XPS spectra between electrodes (MOF@NF and NiMo/MOF@NF) before and after OER measurement.
5
Figure 12. Raman spectra of the MOF@NF before and after electrochemical measurements.
Figure 13. CV curves of bare NF, MOF@NF, and NiMo/MOF@NF at 10, 20, 30, 50, 100, 150, 200 mV sec-1 scan rates and the capacitive current measured at 1.10 V vs. RHE as a function of scan rates.
Figure 14. Chronoamperometric testing of NiMo/MOF@NF of (a) OER and (b) HER process. (c) LSV curves for the NiMo/MOF@NF before and after 1,000 cyclic voltammograms at a scan rate of 5 mV s-1.
Figure 15. (a) Optical photograph of NF, MOF@NF, and NiMo/MOF@NF before and after electrochemical reactions. SEM images of MOF@NF and NiMo/MOF (b,d) before and (c,e) after reactions, respectively.
Figure 16. (a) Two-electrode measurement of NiMo/MOF@NF||Ni
Mo/MOF@NF and MOF@NF||NiMo/MOF@NF. (b) Photograph of bubbles generating and (b) current density during the measurement through a two-electrode system driven by ~1.6 V AAA battery.
6
Chapter 1
Electrochemical catalysts:
Mechanisms and metal-organic
frameworks
7
1.1 Background
In recent decades, technology innovations have emerged in various fields with the exploded amount of consuming energy. Although alternative energy sources have been developed, fossil fuel consists of the most significant percentage of energy generation source, which evokes environmental issues all over the world. Hence, the demand for energy storage and conversion that are eco-friendly and economical have to be substitute fossil fuel energy. To maximize energy efficiency, storing the energy for moments when energy resources are inevitable, and the generating rate exceeds the consuming rate.
There are several sustainable future energies, such as bio, solar, wind, heat, geothermal, etc. Moreover, one of the methods that investigate rapidly with great attention is water splitting technologies. According to the Navigant Research report, the amount of consumption of hydrogen energy will expect to be continuously increased. Hydrogen energy has a high potential for direct conversion and renewable energy in nature, without producing toxic and harmful byproducts. Also, hydrogen energy has three times higher energy efficiency compared to gasoline and fossil fuels.
Moreover, due to the high energy/mass storage ratio, it can transport energy easily and consume various types of energy for diverse applications. It was using chemical reactions with water, electric energy conversed into chemical bonding energy, and vice versa. [1,2] However, hydrogen energy has a limitation in production in terms of economic. While traditional fossil fuel requires 3.2 cents to generate power of 1 kWh energy, hydrogen energy needs more than two times (7.0 cents) expense to generate power of 1 kWh energy. This high expense is mostly because of the expensive electrolyte solutions. Thus, energy generation efficiency should compensate for the price to overcome the limitation.
Water splits into hydrogen and oxygen gases (2H2O → O2 + 2H2) by applied electric energy and then hydrogen oxidized (2H2 + O2 → 2H2O) with the regeneration of energy. Water splitting reaction is an endothermic reaction that required 286 kJ/mol at room temperature and under the standard atmosphere pressure.
This demanding energy is too high for use in the large-scale energy industry.
8
Therefore, finding an exact catalyst to reduce activation energy and accelerate the water splitting reaction rate is essential to enhance energy efficiency for the future energy system. Significantly, the high activation energy for oxygen evolution reaction (OER) is the most significant step to control the rate of water splitting reaction.[3] Noble metal ruthenium and iridium oxides are the most active electrocatalysts for OER and Pt for hydrogen evolution reaction (HER). However, their low abundance and high expense hinder the commercial applications as catalysts. It became significant to develop economic electrocatalysts made of earth- abundant elements, such as using transition metals.[4,5] A classic catalyst design strategy was improving intrinsic activity and density of the active sites. Hence, catalysts with a large specific surface area with porous structure and high charge transfer capability are considered the ideal electrocatalyst architecture. As a result of this idea, extensive researches have been measured the electrocatalytic properties of carbon allotropes,[6] metal chalcogenides,[7] organometallic complexes,[8] conducting polymers,[9] and their composites. A recent class of catalyst material, satisfied both economic and utility conditions are metal-organic frameworks (MOFs). MOFs are composed of various transition metals and organic linkers that are electrochemically active[10,11] and well known for their ultrahigh specific surface area.
9
1.2 Electrochemical catalysts
The most important electrocatalytic energy conversion reactions include the electrochemical water splitting, [12–14] comprising the OER at the anode and HER at the cathode in an electrolytic cell, producing O2 and H2, respectively.
To drive OER at the anode, the reaction requires the energy of 237.1 kJ/mol at standard conditions, which corresponding to a thermodynamically reversible voltage of 1.23 V. In practical electrolytes, the onset potential for OER is usually much higher than 1.23 V due to the sluggish kinetics.[15,16] According to the Sabatier principle, the OER path required 1.23 V, the HER path absorbs the free energy close to 0 V.[17]
Efficient catalyst has onset potential, typically represent the voltage at 1 mA/cm2, with near 1.23 V with fast reaction rate. In general, to evaluate the catalyst, polarization curves (Linear sweep voltammetry, LSV) are the most frequently used indicators. Selected potential value, called overpotential, obtained from the curve, where usually the potential value to afford a current density at 10 mA/cm2 for OER and -10 mA/cm2 for HER. These potential values determine the range to calculate the Tafel slope.
Tafel slope indicates the charge transfer rate and determines the reaction rate determination step. HER has three reaction steps, called a Volmer step (H+ + e- → H), Tafel step (H + H+ + e- → H2), and Heyrovsky step (2H → H2). Among these steps, the slowest step determines the total reaction rate, and it is well-known that the value of the Tafel slope typically indicates the reaction rate.
Furthermore, electrochemical impedance spectroscopy (EIS) and electrochemical active surface area (ECSA) are measured to calculate charge transfer resistance and double-layer capacitance to analyze catalytic characteristics. Generally, the catalyst with the lowest resistance value and the highest capacitance is considered the ideal material.
10
1.3 Metal-organic frameworks
1.3.1 Introduction
Noble metal oxide such as IrO2 and RuO2 are the most well-known electrocatalysts for OER, and Pt is the most active element for HER.[18] However,the price of noble metals is enormously high than non-noble metals. Thus, non-noble metal catalysts such as using transition metals have been widely explored for water splitting to substitute those noble metal catalysts. Furthermore, those new catalysts showed similar or even better active performances. Besides, high porosity enlarged the active sites. Thus, the use of functional porous materials with large surface areas for heterogeneous catalysis has been acknowledged for several decades.
A recent class of catalyst material, satisfied both economic and utility conditions, are metal-organic frameworks (MOFs). MOFs are composed of various transition metals and organic linkers that are electrochemically active[10,11] and well known for their ultrahigh specific surface area.
Meanwhile, two-dimensional (2D) nanomaterials have received increasing research interest. For example, transition metal dichalcogenides (TMDs),[19–24] black phosphorus (BPs),[25–27] and boron nitrides (BNs)[28,29] were actively reported. These 2D materials have many unique properties compared with other dimensions of nanomaterials, including zero-dimensional (0D) nanoparticles, one-dimensional (1D) nanowires, and three-dimensional (3D) networks. In single-layer nanomaterials, electronic confinement enables the 2D materials to have improved electronic properties than other nanostructured materials. The ultrathin 2D nanosheets become a fascinating candidate material for highly flexible and transparent electronic and optoelectronic devices. These unusual properties and promising applications have motivated researchers to synthesize 2D MOF instead of 3D bulk crystalline MOFs.
Almost endless diversity for designing new 2D MOFs is a great advantage compared to other 2D materials, given the large variability of metals and organic linkers. Remarkably, many highly accessible active sites are exposed on the surface of 2D MOF nanosheets, compared to 3D MOFs, with a low surface to volume ratio and sealed active sites in their inside pores, which facilitate more interaction between
11
active sites and reacting molecules that results to improve the catalytic activities.[30]
Using MOFs directly as electrocatalysts have been given significant attention recently because of the rapid development of MOF chemistry, as indicated by the annually increased number of publications.
12
1.3.2 Top-down and Bottom-up synthesis of 2D MOF nanosheets
Despite the advances reported in the design process of 2D MOFs, these materials consist of stacked 2D layers. To maximize the advantages of 2D structure, obtaining a few layered nanosheets, even into a single-layered structure, is required.
The designing process of 2D structures should proceed before the fabrication of 2D MOF as nanosheets. MOFs are composed of metals and organic linkers.
Transition metal cations form several different coordination geometries depend on their extranuclear electron numbers. Common coordination geometries of transition metal ions. In the case of metal ions that directly combine with organic linkers, the geometry of the metal should be planar (trigonal or square); if not, 3D MOFs will be generated. Also, metal complexes can be used to form 2D MOFs. These metal complexes are also called secondary building units (SBUs), and the number of reacting sites of SBUs determines the linked structures. Therefore, choosing appropriate metals and organic linkers is essential.
Unlimited options for organic linkers able to design different structures with several diverse compositions of MOFs. Organic linkers can be categorized with the number of reactive groups, composed of polycarboxylate, phosphonate, sulfonate, imidazole, amine, pyridyl, phenolate, amino acid polypeptide have been reported.
Among those functional groups, polycarboxylate acid was commonly used to fabricate MOFs. These organic linkers make it possible to change the functionalities of the surface, which influences the material’s physicochemical properties.[31–33]
In general, the synthesis method of 2D MOF nanosheets can be divided into two methods: The top-down method and the bottom-up method. In the former method, firstly synthesized bulk crystals are split into multi-layer or even into single-layer nanosheets. Bulk crystals have strong coordination bonds within the layers but weak interlayer interaction such as van der Waals forces, hydrogen bonding, or π–π stacking.[22,34] As a result of weak interaction forces, bulk crystals can be successfully exfoliated through external forces, breaking the weak force between layers. In the latter method, 2D MOF nanosheets are directly synthesized along the specific direction, while the growth along the other direction is restricted.
13 Top-down method
2D MOFs have been synthesized in bulk form powder widely by the solvothermal method. Still, a bulky form cannot be fully utilized the advantages of 2D structure, including large surface area and flexibility. Thus, fabrication into nanosheets form should be proceeded to develop the usage of 2D MOFs.
Ultrasonication is the universal method to achieve nanosheet delamination.
Ultrasound energy assists in breaking interlayer bonding easily. Ultrasonic waves create bubbles in the solvent, which leads to forming shock waves—also, the vibration aid to separation of MOF. Additionally, the solvent’s surface energy and polarity operate a substantial role during the exfoliation process, especially for the ultrasonication method. If the solvent and MOF surface energy are similar, generally, the exfoliation rate increases and stability as a single-layered nanosheet enhances.[35–
37] Choosing the proper solvents to bring about thinner 2D MOF nanosheets.
Ball milling is another means to introduce mechanical shear force. Mechanical exfoliation is not only carried out in the liquid phase but also in the solid phase. As single-layered graphene prepared with the tape-assisted method, the same concept can be introduced to separate 2D MOF crystals.
Chemical exfoliation of bulk 2D MOFs is alternative external forces to delaminate bulk 2D MOFs into ultrathin nanosheets.[38–41] Intercalation of ions and molecules expand the distance between layers to be easily detached with smaller forces.
Another chemical exfoliation method is the oxidation method.
Bottom-up method
Unlike the top-down methods, the bottom-up methods directly formed 2D MOFs.
The growth direction of MOF nanosheets selectively restricted through physical or chemical strategies. The space constriction physically inhibits three-dimensional growth, and the aid of capping solvents or surfactants react with functional groups in MOFs, allowed to grow in a limited direction.
Restricting the stacking of the layers by synthesizing along the interface is one of
14
the examples of constrained space. Interfacial growth, again, can be classified into liquid-air, liquid-liquid, and liquid-solid growth. In these methods, the synthetic reaction occurs between the interface. Therefore MOFs only grow in the confined 2D interface region.[42] Another physical confining method is template synthesis.
MOF nanosheets grow in a limited direction along the microcrystal plane of templates.[43]
The surfactant-assisted method is the typical chemical approach to control the growth direction of 2D MOFs. Surfactants, such as polyvinylpyrrolidone (PVP),[44]
sodium dodecylbenzene sulfonate (SDBS),[45] hexadecyltrimethylammonium bromide (CTAB),[46,47] and sodium dodecyl sulfate (SDS),[48] modify the surface struct4ure of the 2D MOFs by reducing the surface energies.
Besides surfactants, small molecules such as acetic acid, formic acid, and pyridines, called modulators, like acetic acid and pyridine, can also assist the 2D bottom-up synthesis.[49,50] These modulators retain the same functional groups as the organic ligands of MOFs. Thus, modulators can easily coordinate with metal ions of MOFs and control the growth direction of MOF nanosheets.[51–57] The competitive reaction between modulators and metals or organic linkers reduces the nucleation rate and crystal growth, which caused MOFs crystals to grow in an anisotropic direction.
15
1.3.3 Unique properties
MOFs can be synthesized in 1D, 2D, or 3D forms, depending on the coordination geometries of their building units. The diversity of metals and organic linkers have spawned a wide variety of MOFs. The porosity in the MOFs structure provides several appealing properties, including compelling electronic properties, high specific surface area, outstanding mechanical strength, excellent optical transparency, etc. Mostly, as ultrathin 2D materials represent an emerging class of nanomaterials that have been widely investigated for catalysis, energy storage and conversion, and electronic and optoelectronic devices, an enormous number of articles have been published on the use of 2D MOFs.
2D MOF nanosheets possess high percentages of metal atoms exposed on the surface, and these coordinatively unsaturated metal sites with more dangling bonds (abundant active sites) are highly desirable for electrocatalysis. Moreover, the electronic structures of metal sites in MOFs, influenced by organic linkers, make it possible to achieve high oxidation states of metal cations. By merely changing metals and organic linkers, tunable electronic structures may offer a high possibility to investigate noble 2D MOFs with high oxidation states that are promising improved electrocatalytic properties. Compared to other 2D materials, lower densities, large pore structures, and high surface areas are the characteristics of MOFs.[58]
Bulk MOFs that are formed by stacked layers pose a great obstacle for electron or ion transfer. By generating 2D MOFs nanosheets, dramatically decreased electron transfer distance from the ultrathin nanosheets, providing sufficient electron conduction pathways from the electrodes or conductive additives to the active sites, the transport resistance and low conductivity issues of bulk form were solved. [59]
Remarkably, 2D MOFs with a thickness of single- or few-atom layers possess unique chemical, physical, electronic, and optical properties[60,61] and broaden the applications.[35,62–66] These factors make 2D materials especially suited as heterogeneous catalysts. Furthermore, by combining with other compounds like CNT, graphene, and metal oxides, electrochemical properties can be enhanced dramatically compare to 1D or 3D MOF-based composites
16
1.4 References
[1] H. B. Gray, Nat. Chem. 2009, 1, 7.
[2] M. G. Walter, E. L. Warren, J. R. McKone, S. W. Boettcher, Q. Mi, E. A. Santori, N. S. Lewis, Chem. Rev. 2010, 110, 6446.
[3] F. Lyu, Q. Wang, S. M. Choi, Y. Yin, Small 2019, 15, 1804201.
[4] S. Wan, J. Qi, W. Zhang, W. Wang, S. Zhang, K. Liu, H. Zheng, J. Sun, S. Wang, R. Cao, Adv. Mater. 2017, 29, 1700286.
[5] S. Anantharaj, S. R. Ede, K. Sakthikumar, K. Karthick, S. Mishra, S. Kundu, ACS Catal. 2016, 6, 8069.
[6] J. Zhang, Z. Xia, L. Dai, Sci. Adv. 2015, 1, e1500564.
[7] Y. Zhang, Q. Zhou, J. Zhu, Q. Yan, S. X. Dou, W. Sun, Adv. Funct. Mater. 2017, 27, 1702317.
[8] M. L. Pegis, C. F. Wise, D. J. Martin, J. M. Mayer, Chem. Rev. 2018, 118, 2340.
[9] H. Wang, C. Zhu, D. Chao, Q. Yan, H. J. Fan, Adv. Mater. 2017, 29, 1702093.
[10] J. Milikić, M. Vasić, L. Amaral, N. Cvjetićanin, D. Jugović, R. Hercigonja, B.
Šljukić, Int. J. Hydrogen Energy 2018, 43, 18977.
[11] S. Samanta, S. Khilari, K. Bhunia, D. Pradhan, B. Satpati, R. Srivastava, J. Phys.
Chem. C 2018, 122, 10725.
[12] H. F. Wang, L. Chen, H. Pang, S. Kaskel, Q. Xu, Chem. Soc. Rev. 2020, 49, 1414.
[13] N. T. Suen, S. F. Hung, Q. Quan, N. Zhang, Y. J. Xu, H. M. Chen, Chem. Soc. Rev.
2017, 46, 337.
[14] S. Ghosh, R. N. Basu, Nanoscale 2018, 10, 11241.
[15] S. Sohrabi, S. Dehghanpour, M. Ghalkhani, ChemCatChem 2016, 8, 2356.
[16] L. Li, P. Dai, X. Gu, Y. Wang, L. Yan, X. Zhao, J. Mater. Chem. A 2017, 5, 789.
[17] A. J. Medford, A. Vojvodic, J. S. Hummelshøj, J. Voss, F. Abild-Pedersen, F.
Studt, T. Bligaard, A. Nilsson, J. K. Nørskov, J. Catal. 2015, 328, 36.
[18] Y. Yan, T. He, B. Zhao, K. Qi, H. Liu, B. Y. Xia, J. Mater. Chem. A 2018, 6,
17 15905.
[19] R. Lv, J. A. Robinson, R. E. Schaak, D. Sun, Y. Sun, T. E. Mallouk, M. Terrones, Acc. Chem. Res. 2015, 48, 56.
[20] M. Chhowalla, H. S. Shin, G. Eda, L. J. Li, K. P. Loh, H. Zhang, Nat. Chem. 2013, 5, 263.
[21] C. Tan, H. Zhang, Chem. Soc. Rev. 2015, 44, 2713.
[22] V. Nicolosi, M. Chhowalla, M. G. Kanatzidis, M. S. Strano, J. N. Coleman, Science (80-. ). 2013, 340, 1226419.
[23] J. N. Coleman, Acc. Chem. Res. 2013, 46, 14.
[24] J. N. Coleman, M. Lotya, A. O’Neill, S. D. Bergin, P. J. King, U. Khan, K. Young, A. Gaucher, S. De, R. J. Smith, I. V. Shvets, S. K. Arora, G. Stanton, H. Y. Kim, K.
Lee, G. T. Kim, G. S. Duesberg, T. Hallam, J. J. Boland, J. J. Wang, J. F. Donegan, J. C. Grunlan, G. Moriarty, A. Shmeliov, R. J. Nicholls, J. M. Perkins, E. M.
Grieveson, K. Theuwissen, D. W. McComb, P. D. Nellist, V. Nicolosi, Science (80-. ). 2011, 331, 568.
[25] S. C. Dhanabalan, J. S. Ponraj, Z. Guo, S. Li, Q. Bao, H. Zhang, Adv. Sci. 2017, 4, 1600305.
[26] H. Liu, Y. Du, Y. Deng, P. D. Ye, Chem. Soc. Rev. 2015, 44, 2732.
[27] M. Batmunkh, M. Bat-Erdene, J. G. Shapter, Adv. Mater. 2016, 28, 8586.
[28] J. Qian, C. Wu, Y. Cao, Z. Ma, Y. Huang, X. Ai, H. Yang, Adv. Energy Mater.
2018, 8, 1870079.
[29] Q. Weng, X. Wang, X. Wang, Y. Bando, D. Golberg, Chem. Soc. Rev. 2016, 45, 3989.
[30] A. Dhakshinamoorthy, A. M. Asiri, H. Garcia, Adv. Mater. 2019, 31, 1900617.
[31] J. R. Li, Y. Tao, Q. Yu, X. H. Bu, H. Sakamoto, S. Kitagawa, Chem. - A Eur. J.
2008, 14, 2771.
[32] T. Devic, P. Horcajada, C. Serre, F. Salles, G. Maurin, B. Moulin, D. Heurtaux, G.
Clet, A. Vimont, J. M. Grenéche, B. Le Ouay, F. Moreau, E. Magnier, Y.
Filinchuk, J. Marrot, J. C. Lavalley, M. Daturi, G. Férey, J. Am. Chem. Soc. 2010,
18 132, 1127.
[33] M. Eddaoudi, J. Kim, N. Rosi, D. Vodak, J. Wachter, M. O’Keeffe, O. M. Yaghi, Science (80-. ). 2002, 295, 469.
[34] Y. Peng, Y. Li, Y. Ban, H. Jin, W. Jiao, X. Liu, W. Yang, Science (80-. ). 2014, 346, 1356.
[35] M. Zhao, Y. Huang, Y. Peng, Z. Huang, Q. Ma, H. Zhang, Chem. Soc. Rev. 2018, 47, 6267.
[36] V. K. M. Au, K. Nakayashiki, H. Huang, S. Suginome, H. Sato, T. Aida, J. Am.
Chem. Soc. 2019, 141, 53.
[37] A. Gallego, C. Hermosa, O. Castillo, I. Berlanga, C. J. Gõmez-García, E. Mateo- Martí, J. I. Martínez, F. Flores, C. Gõmez-Navarro, J. Gõmez-Herrero, S. Delgado, F. Zamora, Adv. Mater. 2013, 25, 2141.
[38] M. Naguib, Y. Gogotsi, Acc. Chem. Res. 2015, 48, 128.
[39] R. Ma, T. Sasaki, Acc. Chem. Res. 2015, 48, 136.
[40] X. Huang, Z. Zeng, H. Zhang, Chem. Soc. Rev. 2013, 42, 1934.
[41] J. Zheng, H. Zhang, S. Dong, Y. Liu, C. Tai Nai, H. Suk Shin, H. Young Jeong, B.
Liu, K. Ping Loh, Nat. Commun. 2014, 5, 2995.
[42] H. Maeda, R. Sakamoto, H. Nishihara, Coord. Chem. Rev. 2017, 346, 139.
[43] L. Huang, X. Zhang, Y. Han, Q. Wang, Y. Fang, S. Dong, J. Mater. Chem. A 2017, 5, 18610.
[44] E. Y. Choi, C. A. Wray, C. Hu, W. Choe, CrystEngComm 2009, 11, 553.
[45] X. Gao, R. Cui, M. Zhang, Z. Liu, Mater. Lett. 2017, 197, 217.
[46] A. Pustovarenko, M. G. Goesten, S. Sachdeva, M. Shan, Z. Amghouz, Y.
Belmabkhout, A. Dikhtiarenko, T. Rodenas, D. Keskin, I. K. Voets, B. M.
Weckhuysen, M. Eddaoudi, L. C. P. M. P. M. de Smet, E. J. R. R. Sudhölter, F.
Kapteijn, B. Seoane, J. Gascon, Adv. Mater. 2018, 30, 1707234.
[47] A. Pustovarenko, M. G. Goesten, S. Sachdeva, M. Shan, Z. Amghouz, Y.
Belmabkhout, A. Dikhtiarenko, T. Rodenas, D. Keskin, I. K. Voets, B. M.
Weckhuysen, M. Eddaoudi, L. C. P. M. P. M. de Smet, E. J. R. R. Sudhölter, F.
19
Kapteijn, B. Seoane, J. Gascon, Adv. Mater. 2018, 30, 1707234.
[48] H. Fan, H. Yu, X. Wu, Y. Zhang, Z. Luo, H. Wang, Y. Guo, S. Madhavi, Q. Yan, ACS Appl. Mater. Interfaces 2016, 8, 25261.
[49] Y. Sakata, S. Furukawa, M. Kondo, K. Hirai, N. Horike, Y. Takashima, H. Uehara, N. Louvain, M. Meilikhov, T. Tsuruoka, S. Isoda, W. Kosaka, O. Sakata, S.
Kitagawa, Science (80-. ). 2013, 339, 193.
[50] L. Cao, Z. Lin, F. Peng, W. Wang, R. Huang, C. Wang, J. Yan, J. Liang, Z. Zhang, T. Zhang, L. Long, J. Sun, W. Lin, Angew. Chemie - Int. Ed. 2016, 55, 4962.
[51] S. Diring, S. Furukawa, Y. Takashima, T. Tsuruoka, S. Kitagawa, Chem. Mater.
2010, 22, 4531.
[52] A. Schaate, P. Roy, A. Godt, J. Lippke, F. Waltz, M. Wiebcke, P. Behrens, Chem. - A Eur. J. 2011, 17, 6643.
[53] W. Cho, J. L. Hee, M. Oh, J. Am. Chem. Soc. 2008, 130, 16943.
[54] M. H. Pham, G. T. Vuong, F. G. Fontaine, T. O. Do, Cryst. Growth Des. 2012, 12, 3091.
[55] H. Guo, Y. Zhu, S. Qiu, A. J. Lercher, H. Zhang, Adv. Mater. 2010, 22, 4190.
[56] T. Tsuruoka, S. Furukawa, Y. Takashima, K. Yoshida, S. Isoda, S. Kitagawa, Angew. Chemie - Int. Ed. 2009, 48, 4739.
[57] S. Hermes, T. Witte, T. Hikov, D. Zacher, S. Bahnmüller, G. Langstein, K. Huber, R. A. Fischer, J. Am. Chem. Soc. 2007, 129, 5324.
[58] P. J. Waller, F. Gándara, O. M. Yaghi, Acc. Chem. Res. 2015, 48, 3053.
[59] W. Zheng, C. S. Tsang, L. Y. S. Lee, K. Y. Wong, Mater. Today Chem. 2019, 12, 34.
[60] R. Dong, T. Zhang, X. Feng, Chem. Rev. 2018, 118, 6189.
[61] S. Kim, H. Wang, Y. M. Lee, Angew. Chemie - Int. Ed. 2019, 58, 17512.
[62] Q. Cui, G. Qin, W. Wang, K. R. Geethalakshmi, A. Du, Q. Sun, J. Mater. Chem. A 2019, 7, 14510.
[63] M. Choi, K. Na, J. Kim, Y. Sakamoto, O. Terasaki, R. Ryoo, Nature 2009, 461,
20 246.
[64] R. Dong, M. Pfeffermann, H. Liang, Z. Zheng, X. Zhu, J. Zhang, X. Feng, Angew.
Chemie - Int. Ed. 2015, 54, 12058.
[65] J. Duan, S. Chen, C. Zhao, Nat. Commun. 2017, 8, 15341.
[66] S. Zhao, Y. Wang, J. Dong, C. T. He, H. Yin, P. An, K. Zhao, X. Zhang, C. Gao, L.
Zhang, J. Lv, J. Wang, J. Zhang, A. M. Khattak, N. A. Khan, Z. Wei, J. Zhang, S.
Liu, H. Zhao, Z. Tang, Nat. Energy 2016, 1, 16184.
[67] W. J. Dang, Y. Q. Shen, M. Lin, H. Jiao, L. Xu, Z. L. Wang, J. Alloys Compd.
2019, 792, 69.
[68] Z. Xue, K. Liu, Q. Liu, Y. Li, M. Li, C. Y. Su, N. Ogiwara, H. Kobayashi, H.
Kitagawa, M. Liu, G. Li, Nat. Commun. 2019, 10, 5048.
[69] M. Vaseem, S. Zhen, S. Yang, W. Li, A. Shamim, Adv. Electron. Mater. 2019, 5, 1800949.
[70] X. Ling, F. Du, Y. Zhang, Y. Shen, T. Li, A. Alsaedi, T. Hayat, Y. Zhou, Z. Zou, RSC Adv. 2019, 9, 33558.
21
Chapter 2
Direction-controlled growth of
2D Ni-MOF nanosheets on nickel foam
22
2.1 Introduction
Using bimetal or even more than three metal components can significantly improve the catalytic performances in both OER and HER cases. Numerous combinations of metals assist in increasing the electrical conductivity of the MOFs and improving stability. D. Wen-Jiao et al. demonstrated that 2D CoNi-MOF nanosheets have great OER performances compared to Ni-MOF.[67] To find a new candidate for catalyst, it is necessary to devise a good performance of a single metal MOF catalyst. Nickel and iron are known to have a synergistic effect when combined rather than they composed catalyst alone. Therefore, finding an excellent single metal MOF will able to develop in subsequent researches to find bimetal MOF with improved catalytic performances.
Besides, a method of synthesizing a new material into a 2D form should be simultaneously studied. The 2D morphology significantly increases the active area of the catalyst, leading to better catalytic characteristics.
23
2.2 Experimental Procedures
Material preparation: Nickel nitrate hexahydrate (97.0 %), hydrochloric acid (35 % in aqueous solution), N, N-dimethylformamide (DMF, 99.8 %), polyvinylpyrrolidone (PVP), sodium molybdate dihydrate (98.5 %), nickel sulfate hexahydrate (98.5 %), ammonium hydroxide (30 %), and 1.0 M potassium hydroxide (99%) were purchased from Daejung. Trisodium citrate dihydrate (99.8 %) and naphthalene-2,6-dicarboxylic acid (NDC, 98.0 %) were sourced from Sigma-Aldrich, Junsei, and Alfa Aesar, respectively. Nickel foam (NF, thickness 1.5 mm, pore size 450 μm) purchased from Alantum.
Synthesis of Ni-NDC@NF: First, NF (2.5 cm x 1 cm x 1.5 mm) was first cleaned to remove the oxide layer, using the ultrasonic treatment in HCl solution (0.2 ml of 35 % HCl in 9.8 mL water), followed by water and ethanol washing. Next, ethanol (20 ml) and water (20 ml) were mixed, followed by dissolution of Ni(NO3)2‧6H2O (0.7 mmol, 0.20 g) and NDC (0.6 mmol, 0.13 g) powders into the mixed solvent with stirring. Subsequently, DMF (20 ml) added to the solution, and PVP (1.0 g) was added. After the solution was stirred for 10 min to obtain a uniform suspension, the prepared solution was transferred into a 100 ml Teflon vessel with the freshly- cleaned NF. Teflon vessel sealed in the autoclave at 120℃ for 2h. Finally, the Ni- NDC@NF were obtained, washed with water and ethanol, then dried at room temperature.
Synthesis of Ni-NDC MOF powders: The preparation process was the same as Ni-NDC@NF, except for the immersion of NF. Obtained powders were centrifugated at 6000 rpm 5 min, washed with water and ethanol, and then dried at room temperature.
Synthesis of NiMo/MOF@NF: C6H5Na3O7 (6.3 g), Na2MoO4·2H2O (7.9 g), and NiSO4‧6H2O (7.9 g) were dissolved in 200 ml water. Next, NH4OH (10 ml) was
24
added to make the solution pH 10.4. The electrodeposition of NiMo alloy on MOF@NF was conducted in a conventional three-electrode electrochemical cell in the prepared solution at 50℃. The chronoamperometry was performed (Nstat, Ivium Technologies), using MOF@NF as the working electrode, Pt plate as the counter electrode, and Ag/AgCl (3M) as the reference electrode. The electrodeposition process was set with the potential at -1.2 V for 10 min, with 500 rpm stirring. After the NiMo alloy was deposited on MOF@NF, NiMo/MOF@NF was washed with water then dried at room temperature.
Characterization: The X-ray diffraction (XRD) measurements were performed by an X-ray diffractometer (BRUKER MILLER Co., D8-Advance) with Cu Kα radiation (λ = 1.54056 Å). XRD data were recorded at room temperature in the 2θ range of 5°−55° with a step size of 0.01° and a scan speed of 3° min–1. The film surface images of the device were obtained using a field emission scanning electron microscope (ZEISS, MERLIN Compact) with an in-lens secondary electron detector at a 5 kV accelerating voltage and transmission electron microscopy (JEOL, JEM- 2100F). FT-IR spectra were measured from 500 to 4000 cm-1 by FT-IR spectrometer (Thermo Scientific, Nicolet iN10). XPS analysis was carried out using a MultiLab 2000 (Thermo Scientific) with an Mg Kα X-ray source and a K-alpha+ (Thermo Scientific) with an Al Kα X-ray source to determine the composition of nickel, carbon, and oxygen. Raman spectra were obtained using a Raman spectrometer (Horiba, LabRAM HR Evolution) measured from 200 to 2500 cm-1.
Electrochemical measurements: To evaluate the half-reaction of OER and HER, a three-electrode configuration was operated, using a Pt plate as a counter electrode with 1.0 M KOH electrolyte solution. All potentials were applied versus a 3M Ag/AgCl reference electrode and expressed to the reversible hydrogen electrode (RHE) using the Nernst equation. The two-electrode system was operated for overall water electrolysis to show bifunctional performance. The current was recorded using a computer-controlled multichannel electrochemical analyzer potentiostat (Nstat, Ivium Technologies), which simultaneously controlled the potential. EIS spectra
25
were obtained in the three-electrode configuration using the potentiostat. The EIS data at frequencies ranging from 5 kHz to 0.1 Hz. The EIS data were fitted using the equivalent circuits. Based on the CV measurements at different scanning rates, the ECSA was obtained.
26
2.3 Results and Discussion
2.3.1 The structure of Ni-NDC
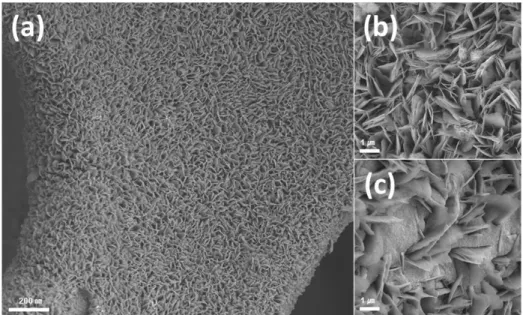
During the preparation of ultrathin 2D Ni-NDC nanosheets on NF, Ni(NO3)2‧6H2O was used as the metal source, and NDC was chosen as the organic linker. PVP was added to functionalized as an anionic surfactant to encourage the MOFs to grow vertically in the one-pot hydrothermal process. The hydrothermal method can be used for growing good quality crystals. Under high temperature and high pressure, the hydrothermal method can control the size and shape of materials by changing the concentration of a solution, types of solvents, temperatures, and reaction times. The temperature and the concentration of the reactant precursor were controlled to obtain the expected products. The ultrathin structure is beneficial to the electrocatalytic properties because it provides abundant coordinatively unsaturated metal sites with more dangling bonds, where the active sites for the surface redox reaction, resulting in good catalytic activities. However, 2D MOFs are usually have a strong tendency to aggregate, as shown in Figure 1a that hinders their practical application. To overcome this drawback, PVP surfactant was used to restrict the vertical growth of MOF nanosheets (Figure 1b). With appropriate synthesizing conditions, MOF@NF and NiMo/MOF@NF have a high percentage of the surface area (Figure 2) that exposes as many unsaturated metal sites and facilitates the catalytic reactions.
27
Figure 1. The SEM images of Ni-NDC nanosheets on NF, synthesized (a) without and (b) with PVP surfactant.
28
Figure 2. The SEM images of (a,b) Ni-NDC@NF and (c) NiMo/MOF@NF.
29
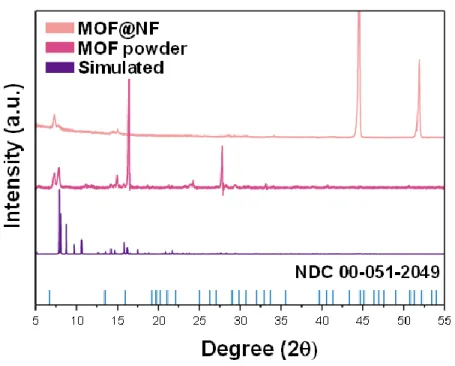
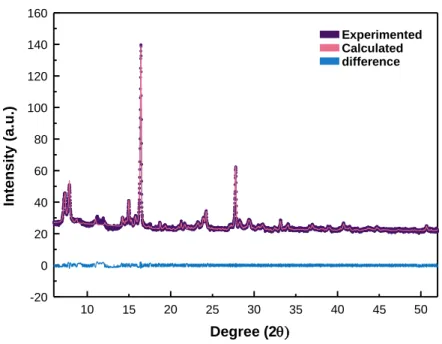
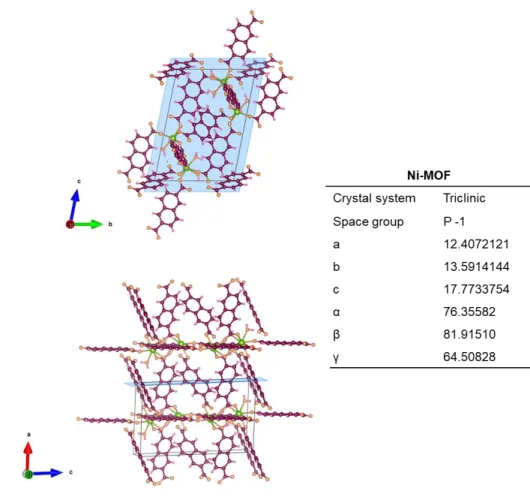
In order to get more insights into Ni-NDC MOF, the X-ray diffraction of both MOF@NF and MOF powder were analyzed (Figure 3). MOF@NF has the peaks at 7.3° and 14.9° with relatively low intensity because of the strong NF substrate signal at 44.5° and 51.8°. Therefore, the MOF powder diffraction pattern was analyzed in detail through the Rietveld refinement method (Figure 4). The crystal structure can be estimated as triclinic with lattice parameters of a=12.4 Å, b=13.6 Å, c=17.18 Å, α=76.4°, β=81.9°, γ=84.51°. This expected structure was simulated with the TOPAS program to construct the Rietveld refinement, and the result is illustrated in Figure 8, showing slight differences and confirming the crystal structure of Ni-NDC. The Ni-NDC MOF consists of a 2D network with octahedral coordination of nickel cation, which bonded with a carboxyl group in NDC. FT-IR and XPS spectra of Ni- NDC powder verify the coordination of the carboxylate groups to nickel ions (Figure 5). As evidenced by a red shift in the carboxylate stretching frequency from 1657 cm-1 (uncoordinated NDC) to 1575 cm-1 (Ni-NDC). The infrared spectra in the range of 1200-1700 cm-1 more clearly illustrated the functional group of MOF. For more detail, and the peaks at 1575 cm-1 and 1397 cm-1 attributed, respectively, to the asymmetric and symmetric stretching vibration of COO- groups. The XPS spectral peaks of Ni 2p were deconvoluted and the spectrum comprised of two regions representing the 2p3/2 and 2p1/2 spin-orbit levels. As in Figure 5b, The peak of Ni2+
2p3/2 at a binding energy of 855.6 eV has a higher intensity than the peak of Ni3+ 2p3/2
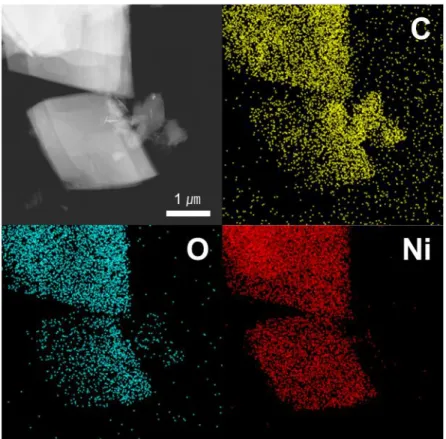
at 857.8 eV; the same is observed for Ni 2p1/2. The spectra of O 1s also support the bonding between nickel cation and oxygen. The peaks at 529.8 eV attributed to metal oxide. Figure 6 shows the EDS results, and this clearly demonstrates the successful fabrication of Ni-NDC nanosheets.
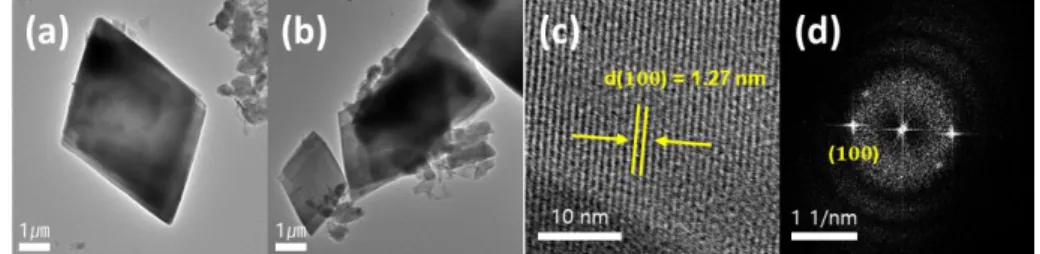
Furthermore, 2D Ni-NDC MOF reveals its orientation through an electron diffraction pattern (Figure 7c,d). The observed d space value (1.27 nm) corresponds to the experimental value (1.22 nm), calculated by the XRD peak at 7.3° in Figure 3.
30
Figure 3. XRD patterns of MOF@NF and MOF powder compared to the simulated pattern from crystal data.
Figure 4. Rietveld refinement of X-ray powder diffraction data of Ni-NDC MOF.
10 20 30 40 50
-20 0 20 40 60 80 100 120 140 160
Intensity (a.u.)
Degree (2q)
15 25 35 45
Experimented Calculated difference
31
Figure 5. (a) FT-IR spectra of NiFe-MOF powder and NDC powder. (b) Ni 2p and O 1s spectrum of Ni-NDC powder.
32
Figure 6. TEM image of Ni-NDC nanosheets and its element mapping for the selected area.
Figure 7. The TEM image of single-layer NiFe-NDC MOF and its d space value of (100) plane.
33
Figure 8. The crystal structure of Ni-NDC. The color scheme for atom representation: Green for Ni, orange for O, purple for C, and pink for H.
34
2.3.2 Electrochemical performance of Ni-NDC@NF & NiMo/MOF@NF
The electrocatalytic performance of Ni-NDC@NF for OER was tested in 1.0 M KOH electrolyte in a typical three-electrode system. All the data were acquired with iR-correction. According to the linear sweep voltammograms (LSV) of Figure 9a, the Ni-NDC@NF demonstrated an overpotential of 249.6 mV at a current density of 10 mA cm-2, which is much smaller than other controlled samples, the bare NF (360 mV). Compared with the commercial benchmark OER catalyst IrO2 (286 mV), Ni- NDC@NF shows a significantly smaller overpotential. The superior OER performance of Ni-NDC@NF also is confirmed by its smaller Tafel slope derived from LSVs (Figure 9b). NiMo/MOF@NF has a higher value of Tafel slope, and this could be explained through the EIS spectrum at room temperature in the frequency range of 0.1 Hz to 25 kHz (Figure 9c). To simulate the working circuit, an equivalent circuit A was designed for MOF@NF and NiMo/MOF@NF and B for NF and Pt.The curve is fitted by a solution resistance Rs, a charge transfer R1 and R2, and the double-layer capacitance CPE1 and CPE2. According to the fitting calculation, it was found that the R of Ni-NDC@NF was 3.24 Ω, while NiMo/MOF@NF has higher resistance (8.51 Ω).
The Ni-NDC@NF is also tested toward HER, with the expected to integrated MOF electrodes for overall water splitting. However, as displayed in Figure 10a, Ni-NDC@NF has no better HER activity. Therefore, NiMo alloy was deposited on vertical MOF@NF through the electrodeposition, illustrated in Figure 2c. NiMo alloy successfully deposited on the space between the vertical nanosheets of Ni- NDC@NF. NiMo/MOF@NF was tested in 1.0 M KOH, which is the same electrolyte used in OER measurement. At the current density of -10 mA cm-2, NiMo/MOF@NF had a small overpotential of 140.4 mV, similar to the overpotential of the Pt plate (116.7 mV). NiMo/MOF@NF exhibits the low Tafel slope of 74 mV dec-1, also similar to the Pt plate (61 mV dec-1).
35
Figure 9. Electrochemical measurements of MOF@NF, NiMo/MOF@NF, and bare NF. (a) OER LSV curves in 1.0 M KOH at a scan rate of 5 mV s-1. (b) Tafel plots. (c) Nyquist plots measured at 1.48 V vs. RHE.
36
Figure 10. Electrochemical measurements of MOF@NF, NiMo/MOF@NF, and Pt plate. (a) HER LSV curves in 1.0 M KOH at a scan rate of 5 mV s-1. (b) Tafel plots. (c) Nyquist plots measured at -0.12 V vs. RHE.
37
Table 1. List of OER catalysts and their electrochemical activities.
Material Overpotential
[mV@10 mA cm-2]
Tafel slope
[mA dec-1] reference
Ni-MOF@NF 249.6 74 This work
NiMo/MOF@NF 249.6 109 This work
RuO2@NF 235 88 [68]
IrO2 286 90 [69]
Ni-NDC/PANI-NF ~365 103 [67]
Ni-MOF@NF 268 132 [70]
38
As expected, the 2D nanosheet structure of Ni-NDC has high activation site resulting in exposed nickel cations to be oxidated. This could be proved by O 1s spectra of MOF@NF and NiMo/MOF@NF (Figure 11). The peaks around 530 eV and 532 eV are reflecting the state of M-O and M-OH, respectively. MOF@NF and NiMo/MOF@NF has appeared within low intensity at the M-OH bond peak. After the electrochemical measurements were operated, M-OH intensity was aroused compared to the M-O peak. This result indicating the exposed metal active sites were oxidized to activate the catalytic characteristics of materials. Raman spectrum also demonstrates the oxidation of nickel in Ni-NDC. After the electrochemical reaction, a peak around 445 cm-1 has appeared, which can be assigned to Ni-OH stretching vibration (Figure 12).
Based on the CV measurements at different scanning rates (10, 20, 30, 50, 100, 150, 200 mV s-1) to get the double layer capacitance (Cdl) of the catalyst, the ECSA was obtained (Figure 13). Cdl value for NiMo/MOF@NF and MOF@NF were calculated to be 0.0108 mF cm-2 and 0.003 mF cm-2, indicating that both catalysts have a high active area. NiMo/MOF@NF has three times higher active area than MOF@NF. However, both have similar OER catalytic performances (Figure 9).
This could be explained with charge transfer value. Since the catalytic activity depends on both of active area and the intrinsic activity, poor charge transfer of NiMo hinders the high active area effects. Although NiMo alloy is inadequate for the OER process, overpotential is not significantly increased but assists the HER process.
In addition to catalytic activity, chemical stability is also an essential factor in the design of electrodes. Thus, by applying constant voltage and cycling performance, Figure 14 was obtained. It is clear that the electrode is relatively stable in alkaline conditions (1.0 M KOH). NiMo/MOF@NF shows more than 20 h stabilities with time at a constant 1.5 V and -0.8 V versus RHE. After the 1000 cycle test, no significant change was found compared to the first LSV polarization curve. SEM images presenting MOF nanosheets were maintained even after the stability test (Figure 15).
To test the overall water splitting, a two-electrode cell was constructed by using NiMo/MOF@NF as both the anode and the cathode. The photograph and the result
39
are revealed in Figure 16. As the applied constant 1.6 V by AAA battery, a large amount of H2 and O2 gas bubbles evolve at the cathode and anode (Figure 16b). The electrolytic cell demonstrated outstanding activity with only a voltage at 1.56 V obtained a 20 mA cm-2. This value is smaller than commercial IrO2||Pt/C cell (1.62 V@10 mA cm-2). This result can be interpreted that NiMo/MOF@NF is well- performed bifunctional electrocatalysts for overall water splitting.
40
Figure 11. Comparison of O 1s XPS spectra between electrodes (MOF@NF and NiMo/MOF@NF) before and after OER measurement.
41
Figure 12. Raman spectra of the MOF@NF before and after electrochemical measurements.
42
Figure 13. CV curves of bare NF, MOF@NF, and NiMo/MOF@NF at 10, 20, 30, 50, 100, 150, 200 mV sec-1 scan rates and the capacitive current measured at 1.10 V vs. RHE as a function of scan rates.
43
Figure 14. Chronoamperometric testing of NiMo/MOF@NF of (a) OER and (b) HER process. (c) LSV curves for the NiMo/MOF@NF before and after 1,000 cyclic voltammo- grams at a scan rate of 5 mV s-1.
44
Figure 15. (a) Optical photograph of NF, MOF@NF, and NiMo/MOF@NF before and after electrochemical reactions. SEM images of MOF@NF and NiMo/MOF (b,d) before and (c,e) after reactions, respectively.
45
Figure 16. (a) Two-electrode measurement of NiMo/MOF@NF ||NiMo/MOF@NF and MOF@NF||NiMo/MOF@NF. (b) Photograph of bubbles generating and (b) current density during the measurement through a two-electrode system driven by ~1.6 V AAA battery
.
46
Table 2. List of the two-electrode system and their potential value at a current density of 20 mA cm-2.
Anode Cathode Potential
[V@20 mA cm-2] reference
Ni-MOF@NF NiMo/MOF@NF 1.56 This work
NiMo/MOF@NF NiMo/MOF@NF 1.56 This work
N-Co3O4@C@NF N-Co3O4@C@NF 1.58 [71]
RuO2@NF Pt/C@NF 1.79 [72]
IrO2@NF Pt/C@NF 1.75 [71]
47
2.4 Conclusion
One of the significant challenges of using MOFs for electrocatalysis is the very small pore size of bulk MOF materials, which inhibits the effective mass transport of electrolyte to the active centers and diffusion of products, leading to impeded electrode performance. Here, using the extra-large macrospores of nickel foam facilitated the mass transport of electrolytes and gaseous products.
In summary, this work demonstrates a universal strategy to fabricate ultrathin nanosheets of 2D MOFs, assisted by surfactant. The synthesized material exhibited significantly enhanced catalytic performances with high catalytic activity, favorable kinetics, and strong stability towards electrocatalysis such as OER, HER, and overall water splitting. The significantly enhanced performance of Ni-NDC@NF and NiMo/MOF@NF for water splitting has been proved. Structural advantages, including the highly exposed metal active site of 2D MOF nanosheets, improved electrical conductivity, and catalysts activities. In a three-electrode system, 2D Ni- MOF@NF had an overpotential of 249.6 mV at 10 mA cm-2 and a Tafel slope of 74 mV dec-1. NiMo was deposited on MOF@NF to fabricate bifunctional catalyst and proved NiMo do not disturb the OER performance of MOF and improve the HER catalytic performances, resulting in 1.56 V overpotential at 20 mA cm-2 at the two- electrode system. The NiMo/MOF@NF exhibits stability after 1000 cycles of linear sweep voltammetry and endure the long term stability test under constant voltages.
The 2D Ni-MOF nanosheets, combined with NiMo alloy, offers superior performance in alkaline condition with outstanding electrochemical activity and high durability. These outstanding values are much better than conventional catalysts such as Pt/C and IrO2. However, the mechanism is still uncovered to understand the catalytic performance of 2D MOFs.
Moreover, instead of using NiMo alloy, investigating 2D MOFs can function for overall water splitting without combining materials needed to discover because Ni- NDC MOF has low HER activity. Furthermore, MOFs can be synthesized into different structures and compositions with the same reactant materials by changing synthesis methods and precursor concentrations. Thus, optimizing the synthesis process and find the best catalytic structure should be led.
48
2.5 References
[67] Z. Xue, K. Liu, Q. Liu, Y. Li, M. Li, C. Y. Su, N. Ogiwara, H. Kobayashi, H.
Kitagawa, M. Liu, G. Li, Nat. Commun. 2019, 10, 1.
[68] M. Vaseem, S. Zhen, S. Yang, W. Li, A. Shamim, Adv. Electron. Mater. 2019, 5, 1.
[69] J. Xing, K. Guo, Z. Zou, M. Cai, J. Du, C. Xu, Chem. Commun. 2018, 54, 7046.
[70] X. Ling, F. Du, Y. Zhang, Y. Shen, T. Li, A. Alsaedi, T. Hayat, Y. Zhou, Z. Zou, RSC Adv. 2019, 9, 33558.
[71] Y. Ha, L. Zhi, Z. Chen, R. Wu, Adv. Sci. 2019, 6(11), 1900272.
[72] P. Yang, X. Ge, L. Fan, M. Li, L. Zhang, X. Li, Z. Kang, H. Cuo, F. Dai, D. Sun, J.
Solid State Chem. 2020, 292, 121696.
.
49
Abstact in Korean
이차원 니켈 기반 금속유기구조체 기반의 산소발생반응 촉매
기존의 화석연료 기반 에너지원을 대체할 수 있는 지속가능한 친환경 에 너지원에 대한 연구의 중요성이 커지고 있다. 태양, 풍력, 조력 등을 이 용한 에너지원이 초기에 주목받았지만 에너지를 생산하는 조건이 한정적 이며 저장할 수 없는 한계를 가지고 있다. 반면, 수소 에너지는 외부 환 경과는 무관하게 물을 전기 분해하여 쉽게 생산할 수 있고, 수소를 다양 한 형태로 저장함으로써 에너지를 비축할 수 있기 때문에 최근 연구가 활발히 이루어지고 있다. 물 분자는 전기 에너지를 가하여 수소와 산소 로 분리되며 각각의 반은은 수소발생반은 (HER) 과 산소발생반응 (OER) 로 나뉜다. 전체 반응은 열역학적으로 1.23 V 의 전위에서 발생해야한다.
하지만 실제 반응은 반응속도가 느리기 떄문에 1.23 V 이상의 과전압
(overpotential)이 필요하며, 과전압은 전극 재료와 특성에 따라서 달라진
다. 전극 물질의 전기 전도도와 이온 이동성 등의 요소를 고려하여 반응 효율이 높은 전기화학촉매 연구가 요구되어 지고있다.
금속유기구조체 (MOF)는 기본적으로 부도체이기 때문에 촉매로서의 역 할이 제한된다고 여겨졌지만, 특히, 금속유기구조체는 유기리간드의 구조
50
에 따라서 다양한 형태를 만들 수 있으며 이차원 다공성 구조를 통해 표 면적이 넓고 촉매 반응이 일어나는 금속 이온들이 표면에 많이 노출될 수 있어서 전도성 금속유기구조체의 발전으로 뛰어난 촉매효율을 드러내 고 있다. 본 논문에서는 니켈과 2,6-나프탈렌다이카르복시산을 이용한 이 차원 .금속유기구조체 나노시트를 니켈폼 위에 합성하여 산소발생반응 촉매로서 향상된 효과를 입증하였으며, 더 나아가 니켈몰리브데늄을 금 속유기구조체 나노시트 사이에 박막을 형성함으로써 수소발생반응 촉매 로서의 효과또한 보여주었다.
주요어: 금속유기구조체, 이차원 물질, 산소발생반응, 수소발생반응, 물분 해, 이원 기능성 촉매