저작자표시-비영리-변경금지 2.0 대한민국 이용자는 아래의 조건을 따르는 경우에 한하여 자유롭게
l 이 저작물을 복제, 배포, 전송, 전시, 공연 및 방송할 수 있습니다. 다음과 같은 조건을 따라야 합니다:
l 귀하는, 이 저작물의 재이용이나 배포의 경우, 이 저작물에 적용된 이용허락조건 을 명확하게 나타내어야 합니다.
l 저작권자로부터 별도의 허가를 받으면 이러한 조건들은 적용되지 않습니다.
저작권법에 따른 이용자의 권리는 위의 내용에 의하여 영향을 받지 않습니다. 이것은 이용허락규약(Legal Code)을 이해하기 쉽게 요약한 것입니다.
Disclaimer
저작자표시. 귀하는 원저작자를 표시하여야 합니다.
비영리. 귀하는 이 저작물을 영리 목적으로 이용할 수 없습니다.
변경금지. 귀하는 이 저작물을 개작, 변형 또는 가공할 수 없습니다.
보건학석사 학위논문
초 미세먼지(PM 2.5 ) 구성성분과 심혈관 질환 사망의 연관성 분석 Effects of fine particulate matter
components on cardiovascular diseases mortality
2017년 6월
서울대학교 보건대학원 보건학과 보건통계학전공
황성희
초 미세먼지(PM 2.5 ) 구성성분과 심혈관 질환 사망의 연관성 분석
지도교수 김 호
이 논문을 보건학 석사학위논문으로 제출함 2017년 5월
서울대학교 보건대학원 보건학과 보건통계학전공
황성희
황성희의 석사학위논문을 인준함 2017년 6월
위 원 장 이 승 묵 (인) 부위원장 조 성 일 (인) 위 원 김 호 (인)
i
Abstract
Sung-Hee Hwang
Department of Biostatistics
Graduate School of Public Health
Seoul National University
Background: Numerous studies have revealed an association between particulate matter (PM) and cardiovascular mortality, although few studies have investigated the association between health and PM components. The present study evaluated the associations of mortality for cardiovascular, cardiac and stroke diseases with fine particulate matter components, including organic carbon (OC), elemental carbon (EC), and ion species (SO42-
, NO3-
, and NH4+
).
Method: Statistical analyses were performed using the time- series approach, and generalized additive models with spline functions were used to adjust for the non-linear relationship between the confounders and mortality counts.
Results: Our single-pollutant models revealed that the greatest increase in cardiovascular mortality counts was associated with EC (relative risk: 1.02; 95% confidence interval: 1.00–1.04), which was
followed by NH4+
, SO42-
, OC and NO3-
. For cardiac diseases, the estimated RRs in SO42- and NH4+were 1.05 (95% CI: 1.02–1.08) and 1.05 (95% CI: 1.01–1.09), respectively. For stroke diseases, the estimated RRs in EC and NH4+were 1.02 (95% CI: 0.99–1.06) and 1.02 (95% CI: 0.98–1.06), respectively.
Conclusions: The associations of cardiovascular mortality counts with PM2.5components were found. For cardiac diseases, SO42-
and NH4+ were significantly associated with mortality counts. Similarly, for stroke diseases, EC and NH4+
were positively associated with mortality counts. Lagged SO42- was associated with cardiac mortality counts in male group. As PM2.5 components are related to traffic and industrial sources, and exhibited positive associations with mortality counts, our results may help improve air pollution regulation and public health.
Keywords: Air pollution, Fine Particulate matter (PM2.5), PM2.5 components, Cardiovascular disease, Mortality, Association, Relative risk
Student I.D.: 2015-24085
Contents
1. Background...1
2. Method...4
2.1 Study population and health outcomes...4
2.2 Environmental variables...5
2.3 Statistical Analysis...5
3. Results...8
3.1 Descriptive characteristics of data...8
3.2 Results... 17
4. Discussion... 28
5. Conclusion... 31
초록... 50
그림 목차
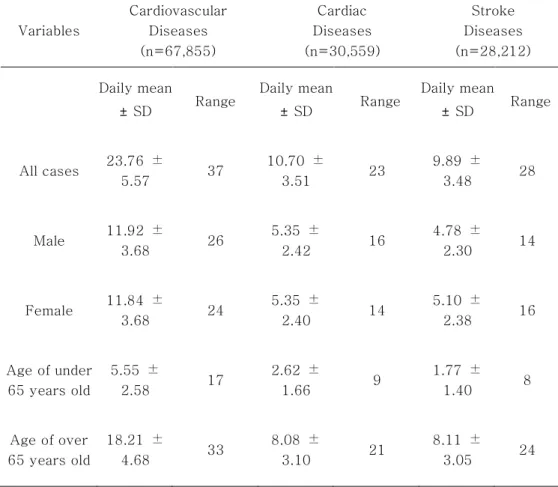
Figure 1: Box plots of mortality counts for cardiovascular diseases by age and gender.
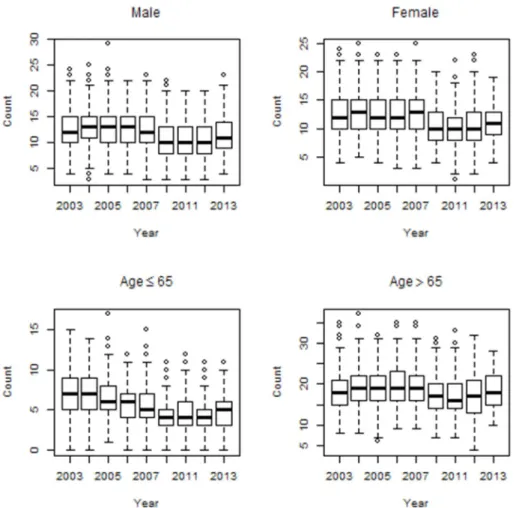
Figure 2: Box plots of mortality counts for cardiac diseases by age and gender.
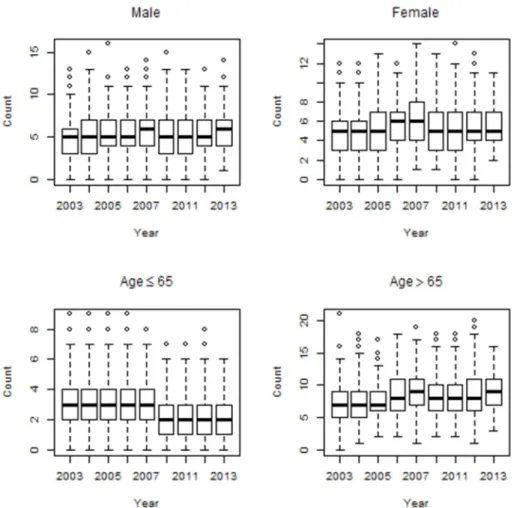
Figure 3: Box plots of mortality counts for stroke diseases by age and gender.
Figure 4: Q-Q plots of PM2.5 components’concentrations.
Figure 5: RRs of daily mortality counts per one IQR increase of PM2.5 and its components on cardiovascular diseases for the concurrent day (lag=0).
Figure 6: RRs per one IQR increase of PM2.5and their components for cardiovascular diseases with different lag days (from 0 to 10 days before the concurrent day).
Figure 7: RRs of daily mortality counts per one IQR increase of PM2.5 and its components on cardiac diseases (A) and stroke diseases (B) for the concurrent day (lag=0).
Figure 8: RRs per one IQR increase of sulfate and ammonium for cardiac diseases by gender with different lag days (from 0 to 4 days before the concurrent day).
v
Figure 9: RRs per one IQR increase of sulfate and ammonium for stroke diseases by age with different lag days (from 0 to 4 days before the concurrent day).
표 목차
Table 1: Characteristics of mortality counts for cardiovascular, cardiac and stroke diseases from March 1, 2003 to November 30, 2007 and April 17, 2010 to May 10, 2013.
Table 2: Air pollution and meteorological data from March 1, 2003 to November 30, 2007 and April 17, 2010 to May 10, 2013.
Table 3: Pearson correlation coefficients among concentrations of PM2.5component.
Table 4. Relative risks per one IQR increase of air pollutants on cardiovascular mortality counts for the concurrent day.
Table 5. Relative risks per one IQR increase of PM2.5 and PM2.5
components on cardiac and stroke mortality counts.
Table 6. Relative risks (RRs) per one IQR increase of each PM2.5
components on cardiovascular, cardiac and stroke disease in multi pollutant models.
1 1. Background
Air pollution caused by urbanization and industrialization has been gaining attention as an important health issue. Concerns regarding the health effects of air pollutants have been increasing, and several studies have revealed that adverse health effects are related to increasing concentrations of particulate matter (PM) [1–
8]. Previous studies have examined the association between mortality and PM concentrations, and typically revealed that mortality increases with greater population-level exposure to air pollutants [9–15]. Furthermore, researchers have demonstrated an association between PM concentrations and mortality for cardiovascular diseases [16, 17].
PM is divided according to range of sizes. Fine particulate matter (PM2.5), which is 2.5 micrometers in diameter or smaller, is a mixture of solids and liquid droplets floating in the air. PM2.5 is produced from all types of combustion, including power plants, motor vehicles and some industrial processes. In South Korea, the level of PM2.5has proved to be the worst in the world and health effects of PM2.5 have been rising. According to the National Institute of Health and Human Resources Development in the United States(HEI), the level of average annual PM2.5 concentration considering population weight was 26 µg/m3 in 1990. At the time, it was much higher than the OECD average of 17㎍/㎥ and the seventh
worst member among the countries. For the past 25 years, the OECD average measurement has declined to 15 µg/m3, while Korea has increased to 29 µg/m3. [18] PM2.5 can penetrate deep into human lungs to directly contribute to heart or lung diseases and to reduce the body's immune function. According to the Korea Centers for Disease Control and Prevention(KCDC), the mortality for ischemic heart disease such as myocardial infarction increased by 30 to 80 percent due to PM2.5 exposure. [19]
As there is increasing evidence regarding the effects of PM on mortality for cardiovascular diseases, study on the components of PM has also become important. Hoek et al. [20] have reported a positive association between cardiovascular diseases mortality and PM components, such as nitrates (NO3-) and sulfates (SO42-).
Furthermore, Ostro et al. [21] found that daily counts of cardiovascular mortality were associated with PM2.5and several of its species including elemental carbon (EC), organic carbon (OC), nitrates (NO3-) and sulfates (SO42-).
In Korea, study was conducted in 2010 to investigate the association between cardiovascular mortality and components of PM2.5. [22] However, studies which have shown that health effects of PM components on cardiovascular mortality is currently
3
insufficient in Korea. Therefore, we examined the associations of PM2.5 components with mortality for cardiovascular diseases in Seoul, South Korea (2003-2007, 2010-2013).
2. Method
2.1 Study population and health outcomes
Seoul, the largest city in Korea, was selected for the study.
The morality counts data were obtained from the Korean Statistical Information Service. The process of obtaining data was accessed by entering the Microdata Integrated Service web site (MDIS:
https://mdis.kostat.go.kr/index.do) from the Statistics Korea (KOSTAT: http://www.kostat.go.kr) web site. After joining the membership of the MDIS site, we extracted the health care and social welfare area. By selecting study periods and cause of death statistics, data could be downloaded. In addition, MDIS provides data at the individual level, such as death age, sex, death date(s), reasons for the mortality, marital status, education degree and occupation. MDIS mortality data were classified according to the discharge diagnosis. To examine the subgroup effects, we stratified by gender (male or female) and age (≥65 years old or <65 years old).
The classification criteria for death diagnosis code should be determined first to investigate the structure of the mortality and the trend of death. The ICD-10 code was international statistical classification of diseases and related health problems in the World Health Organization (WHO). We used non-accidental mortality counts for cardiovascular diseases (ICD-10: I00-I99, G45, G46,
5
M30, M31, R58 excluding G45.3, I67.0, I67.3, I68.0). To examine the details of cardiovascular diseases, we considered cardiac disease (ICD-10: I00-I52, I97.0, I97.1, I98.1) and stroke (ICD-10:
I60-I69, G45, G46 excluding G45.3, I67.0, I67.3, I68.0).
2.2 Environmental variables
The present study evaluated air pollution data (March 1, 2003 to November 30, 2007 and April 17, 2010 to May 10, 2013) The PM components were defined as carbon species (EC and OC) and ion species (NO3-
, NH4+
, and SO42-
), and related data were obtained during 24-h periods using ambient air samples that were collected on the rooftop of the former School of Public Health building (37.5ºN and 127.00ºE). After sample collections, concentrations of carbon species and ion species were analyzed by using and thermal and optical transmittance (Sunset Laboratories, Tigard, OR) and ionic chromatograph (Dionex DX-120, Thermo Fisher Scientific, Inc., Cambridge, UK), respectively. More detailed information regarding measurement procedures were explained in Heo et al. (2009) and Kim et al. (2007) studies [23, 24]. The Korea Meteorology Administration provided daily meteorological data, including temperature (℃) and relative humidity (%). (Korea Meteorology Administration: www.kma.go.kr)
2.3 Statistical Analysis
To evaluate the relationships between cardiovascular
diseases mortality and concentrations of PM components, we used a generalized additive model based on the assumption of a quasi- Poisson distribution. The model included various controlling factors, such as influenza status, day of the week (DOW), holiday, and meteorological variables (temperature and relative humidity):
log(μ ) =
α + βComponent + (DOW ) + (Influenza ) + (Temp ) + (RH ) + (Holiday ) + (SN) + (Time): (SN)
In this model, μ is the expected number of mortality counts on day t, Component is the concentrations of the PMs and their components on day t ( g/m3), and α is the intercept of the model.
DOW is the day of the week, which was evaluated as a categorical variable on day t (Monday, Tuesday, Wednesday, Thursday, Friday, Saturday, and Sunday). Influenza was evaluated as a categorical variable on day t (presence: 1, absence: 0), Holiday was evaluated as a categorical variable on day t (holiday: 1, non-holiday: 0). To evaluate the delayed association between temperature and each PM component, we applied 5 days moving average for daily temperature.
We selected spline function of moving average temperature with 6 degrees of freedom (df) per year. We applied spline function of daily relative humidity with 3 df per year. To control the discontinuous period, SN was evaluated as an indicator variable.
(2003-2007 period: 1, 2010-2013 period: 2) We used a df of 8
7
per year for the cubic spline function to control for long-term trend and seasonality. To explain more details of time control, interaction term between date and SN was used to consider the discontinuous study period time.
3. Results
3.1 Descriptive characteristics of data.
Table 1: Characteristics of mortality counts for cardiovascular, cardiac and stroke diseases from March 1, 2003 to November 30,
2007 and April 17, 2010 to May 10, 2013.
Variables
Cardiovascular Diseases (n=67,855)
Cardiac Diseases (n=30,559)
Stroke Diseases (n=28,212) Daily mean
±SD Range Daily mean
±SD Range Daily mean
±SD Range
All cases 23.76 ±
5.57 37 10.70 ±
3.51 23 9.89 ±
3.48 28
Male 11.92 ±
3.68 26 5.35 ±
2.42 16 4.78 ±
2.30 14
Female 11.84 ±
3.68 24 5.35 ±
2.40 14 5.10 ±
2.38 16
Age of under 65 years old
5.55 ±
2.58 17 2.62 ±
1.66 9 1.77 ±
1.40 8
Age of over 65 years old
18.21 ±
4.68 33 8.08 ±
3.10 21 8.11 ±
3.05 24
SD: standard deviation; Range: daily max- daily min Table 1 describes the basic characteristics of the morality counts for cardiovascular diseases during March 1, 2003 to November 30, 2007 and April 17, 2010 to May 10, 2013. We identified 67,855 morality counts for cardiovascular diseases
9
(23.76 counts/day), 30,559 morality counts for cardiac diseases (10.70 counts/day) and 28,212 morality counts for cardiac diseases (9.89 counts/day). Compared to female group, male group had a higher average value for cardiovascular and cardiac diseases.
However, for stroke diseases, female group had a higher average value compared to male group. Elderly group (≥65 years old) had higher mean values for cardiovascular, cardiac and stroke diseases, compared to younger group (<65 years old). The trends for cardiovascular and cardiac mortality counts maintained a level over time among male and female group. However, for stroke diseases, the mortality counts decreased over time among male and female group. The mortality counts for both cardiovascular and cardiac diseases distinctly increased over time among elderly group (≥65 years old). However, for stroke diseases, the mortality counts decreased over time among elderly group (≥65 years old). Figures 1, 2 and 3 show the time series distributions of cardiovascular, cardiac and stroke mortality counts according to gender and age.
Figure 1: Box plots of mortality counts for cardiovascular diseases by age and gender.
11
Figure 2: Box plots of mortality counts for cardiac diseases by age and gender.
Figure 3: Box plots of mortality counts for stroke diseases by age and gender.
13
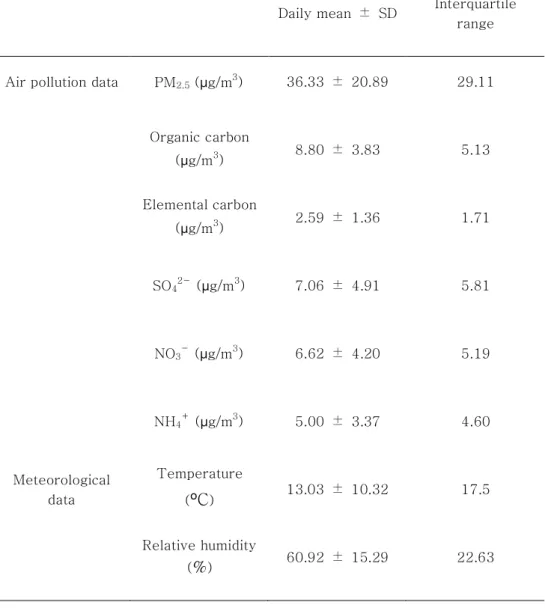
Table 2: Air pollution and meteorological data from March 1, 2003 to November 30, 2007 and April 17, 2010 to May 10, 2013.
Daily mean ± SD Interquartile range
Air pollution data PM2.5 (µg/m3) 36.33 ± 20.89 29.11
Organic carbon
(µg/m3) 8.80 ± 3.83 5.13 Elemental carbon
(µg/m3) 2.59 ± 1.36 1.71
SO42-(µg/m3) 7.06 ± 4.91 5.81
NO3-(µg/m3) 6.62 ± 4.20 5.19
NH4+(µg/m3) 5.00 ± 3.37 4.60
Meteorological data
Temperature
(ºC) 13.03 ± 10.32 17.5
Relative humidity
(%) 60.92 ± 15.29 22.63
Table 2 summarizes the air pollution and meteorological data from the study period. The daily average concentrations of PM2.5
was 36.33 µg/m3. Among the PM2.5 components, OC had the highest daily concentration value (8.80 µg/m3), which was followed by
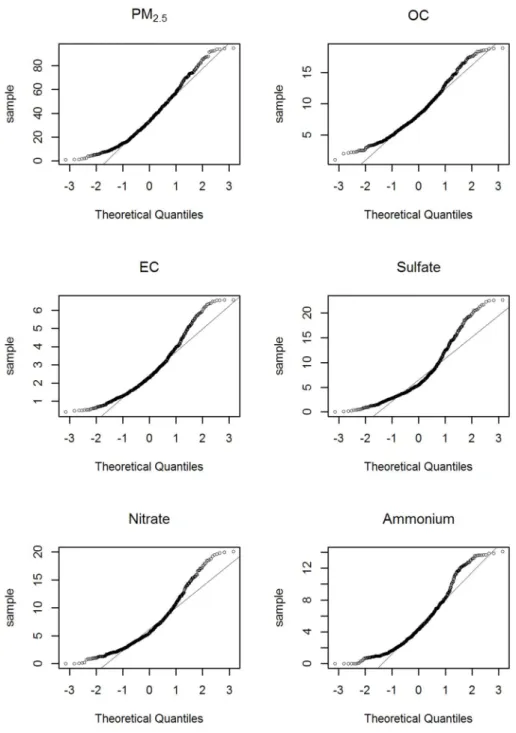
SO42-(7.06 µg/m3) and NO3-(6.62 µg/m3). The interquartile ranges (IQR) for PM2.5 were 29.11 µg/m3. Unlike the average daily concentrations, the highest IQR value was observed for SO42- (5.81 µg/m3), which was followed by NO3- (5.19 µg/m3) and OC (5.13 µg/m3). Meanwhile, we used the quantile-quantile plot (Q-Q plot) to conduct a normality test of air pollution data. The Q-Q plot is a graphical tool to help us assess if our data plausibly came from normal theoretical distribution. In our analysis, Y-axis meant concentrations of each PM2.5 components. The circles in Figure 4 were plenty close enough to the line, and our air pollution data had being normal. In addition, we investigated Shapiro-Wilk Test and the same result was found to follow the normal distribution. Q-Q plots of the PM2.5 components’ concentrations are shown in Figure 4.
15
Figure 4: Q-Q plots of PM2.5 components’concentrations.
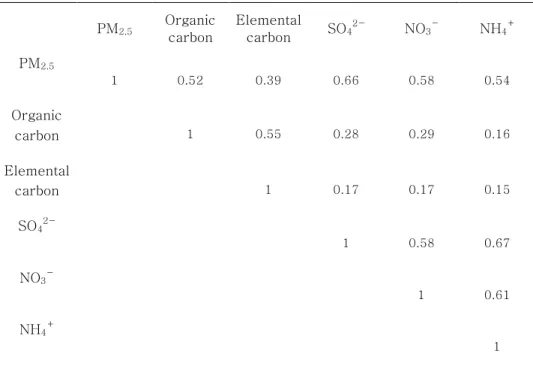
Table 3: Pearson correlation coefficients among concentrations of PM2.5components.
PM2.5 Organic carbon
Elemental
carbon SO42-
NO3-
NH4+
PM2.5
1 0.52 0.39 0.66 0.58 0.54
Organic
carbon 1 0.55 0.28 0.29 0.16
Elemental
carbon 1 0.17 0.17 0.15
SO42-
1 0.58 0.67
NO3-
1 0.61
NH4+
1
Table 3 shows the Pearson correlation coefficients for the concentrations of PM2.5components. The strongest correlation with PM2.5 was observed for SO42- (r = 0.66). Among the PM components, NH4+
and NO3-
were the strongest correlations (r = 0.67). The weakest correlation was between EC and NH4+ (r = 0.15).
17 3.2 Results
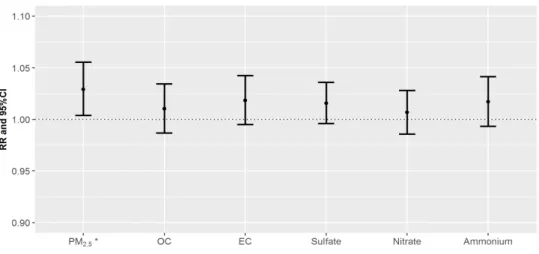
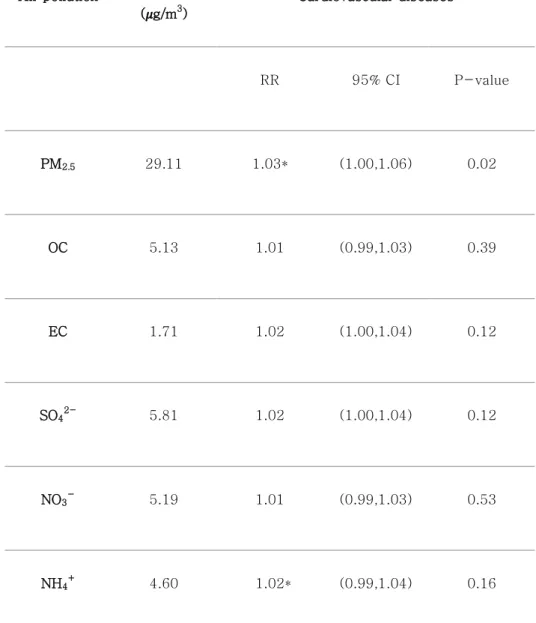
Figure 5: RRs of daily mortality counts per one IQR increase of PM2.5
and its components on cardiovascular diseases for the concurrent day (lag=0). PM2.5 for cardiovascular (marked as asterisk) indicates
statistically significant value.
Figure 5 shows the relative risks (RRs) of cardiovascular on lag 0 day when exposed to the PM and their components. The PM2.5, and component variables exhibited positive associations with mortality counts for cardiovascular disease. The estimated RR on lag 0 day for PM2.5 was 1.03 (95% confidence interval [CI]: 1.00–
1.06). The estimated RRs on lag 0 day for OC and EC were 1.01 (95% CI: 0.99–1.03) and 1.02 (95% CI: 1.00–1.04), respectively.
The estimated RRs on lag 0 day for SO42-, NO3- and NH4+ were 1.02 (95% CI: 1.00–1.04), 1.01 (95% CI: 0.99–1.03) and 1.02 (95%
CI: 0.99–1.04) respectively. The details regarding the RR values in Figure 5 are summarized in Table 4.
Table 4. Relative risks per one IQR increase of air pollutants on cardiovascular mortality counts for the concurrent day.
Air pollution
IQR ( g/m3)
Cardiovascular diseases
RR 95% CI P-value
PM2.5 29.11 1.03* (1.00,1.06) 0.02
OC 5.13 1.01 (0.99,1.03) 0.39
EC 1.71 1.02 (1.00,1.04) 0.12
SO42-
5.81 1.02 (1.00,1.04) 0.12
NO3-
5.19 1.01 (0.99,1.03) 0.53
NH4+
4.60 1.02* (0.99,1.04) 0.16
* p-value of RRs < 0.05; CI, confidence interval; IQR, interquartile range; RR, relative risk
19
Figure 6: RRs per one IQR increase of PM2.5and their components for cardiovascular diseases
with different lag days (from 0 to 10 days before the concurrent day).
In addition, we analyzed lag effects for each PM2.5
components (Figure 6). Except for NO3-, PM2.5 and their components were delayed effects on cardiovascular mortality counts with lag 1 day. The details regarding the RR values in the lag models are summarized in Table A1.
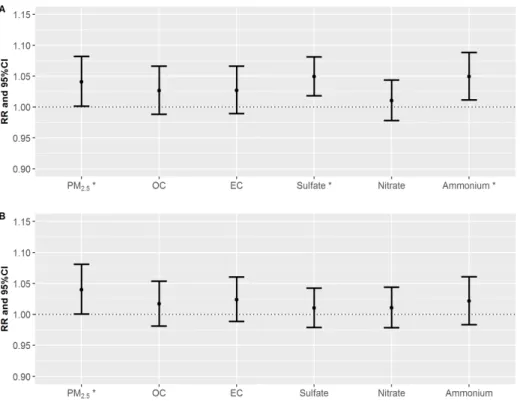
Figure 7: RRs of daily mortality counts per one IQR increase of PM2.5
and its components on cardiac diseases (A) and stroke diseases (B) for the concurrent day (lag=0). PM2.5, Sulfate and Ammonium for
cardiac (marked as asterisk) and PM2.5for stroke indicate statistically significant value.
Figure 7 shows RR values for cardiac (Figure 7A) and stroke (Figure 7B) diseases per one-IQR increase in PM2.5 and their components. Both SO42- and NH4+ exhibited significantly associated
21
with cardiac mortality counts (Figure 7A). The estimated RRs on lag 0 day for SO42- and NH4+ were 1.05 (95% confidence interval [CI]: 1.02–1.08) and 1.05 (95% confidence interval [CI]: 1.01–
1.09), respectively. As shown in Figure 7B, the largest RR estimate was observed for EC, which was followed by NH4+ in stroke diseases. The estimated RRs of stroke mortality counts due to EC and NH4+
in PM2.5were 1.02 (95% CI: 0.99–1.06) and 1.02 (95% CI:
0.98–1.06), respectively. Interestingly, NH4+ had a common effect on both cardiac and stroke mortality counts. The details regarding the RR values in Figure 7 are summarized in Table 5.
Table 5. Relative risks per one IQR increase of PM2.5and PM2.5components on cardiac and stroke mortality counts.
Air pollution
IQR ( g/m3)
Cardiac diseases Stroke diseases
RR 95% CI P-value RR 95% CI P-value
PM2.5 29.11 1.04* (1.00,1.08) 0.042 1.04* (1.00,1.08) 0.047
OC 5.13 1.03 (0.99,1.07) 0.179 1.02 (0.98,1.05) 0.357
EC 1.71 1.03 (0.99,1.07) 0.162 1.02 (0.99,1.06) 0.187
SO42-
5.81 1.05* (1.02,1.08) 0.001 1.01 (0.98,1.04) 0.526
NO3-
5.19 1.01 (0.98,1.04) 0.528 1.01 (0.98,1.04) 0.517
NH4+
4.60 1.05* (1.01,1.09) 0.010 1.02 (0.98,1.06) 0.272
* p-value of RRs < 0.05; CI, confidence interval; IQR, interquartile range; RR, relative risk
23
Figure 8: RRs per one IQR increase of sulfate and ammonium for cardiac diseases by gender with different lag days (from 0 to 4 days
before the concurrent day).
Figure 8 shows the RR values in SO42- and NH4+ for cardiac diseases by gender group, while considering the lag. Based on the results in Figure 7A, exposure to SO42- and NH4+ were positively associated with cardiac mortality counts. The estimated RRs per one-IQR increase in SO42- were 1.06 on lag 0 day (95% CI: 1.02–
1.11) and 1.03 on lag 1 day (95% CI: 0.99–1.07) in male group. The estimated RRs per one-IQR increase in SO42-
were 1.05 on lag 0 day (95% CI: 1.00–1.09) and 1.00 on lag 1 day (95% CI: 0.96–1.04)
in female group. SO42-
had lag effects up to lag 3 in male group.
Compared to female group, the male groups exhibited greater RR estimates for SO42-
up to lag 4. Similarly, for NH4+
, the estimated RRs in male group were larger than female up to lag 3. The RRs in NH4+ slightly decreased up to lag 2 both in male and in female. The RRs per one-IQR increase in SO42- and NH4+ for cardiac diseases for gender and lag days were summarized in Table A2.
Figure 9: RRs per one IQR increase of sulfate and ammonium for stroke diseases by age with different lag days (from 0 to 4 days
before the concurrent day).
25
Figure 9 shows the RR values in SO42-
and NH4+
for stroke diseases by age group, while considering the lag. Interestingly, both SO42-
and NH4+
, the estimated RRs per one-IQR increase were jumped on lag 2 day in young group. The estimated RRs per one- IQR increase in SO42- and NH4+were 1.10 (95% CI: 1.03–1.17) and 1.11 (95% CI: 1.02–1.19) on lag 2 day in young group, respectively.
For elderly, NH4+
had a positively association on stroke diseases in lag 0. However, lag effects were not found. The RRs per one-IQR increase in SO42-
and NH4+
for stroke diseases for age and lag days were summarized in Table A3. All information regarding the stratified analyses are described in Figure A3-A8.
In addition, we analyzed multi-pollutant models for each PM2.5 components. For cardiovascular disease, the highest RR on lag 0 day was observed for NH4+ (RR: 1.02, 95% CI: 0.98–1.06).
Similarly, for cardiac disease, the highest RR on lag 0 day was observed for NH4+ (RR: 1.06, 95% CI: 0.99–1.14). For stroke disease, the highest RR on lag 0 day was observed for OC (RR: 1.04, 95% CI: 0.98–1.10). The similar or higher RRs were found in single -pollutant models compared to multi-pollutant models. However, the estimated RR of cardiac disease in the multi-pollutant model for NH4+
was higher than the value from the single-pollutant model.
Also, only the estimated RR of stroke disease in the multi-pollutant model for OC was higher than the value from the single-pollutant model. NH4+ was significantly associated with cardiac mortality in
the multi-pollutant models at the 0.10 level. Both single- and multi- pollutant models showed significant result for NH4+ on cardiac mortality. The details regarding the RR values in the multi- pollutant models are summarized in Table 6. We evaluated the statistical models by changing the df for relative humidity and temperature, and observed little change in the RRs (A4 Table).
27
Table 6. Relative risks (RRs) per one IQR increase of each PM2.5 components on cardiovascular, cardiac and stroke disease in
multi pollutant models.
* p-value of RRs < 0.10; CI, confidence interval; RR, relative risk
Variables Air pollution RR 95% CI P-value
Cardiovascular diseases
OC 1.01 (0.98 , 1.05) 0.53
EC 1.01 (0.97 , 1.04) 0.76
SO42-
1.00 (0.97 , 1.03) 0.99 NO3-
1.01 (0.97 , 1.04) 0.67 NH4+
1.02 (0.98 , 1.06) 0.33 Cardiac diseases OC 1.01 (0.95 , 1.06) 0.66
EC 1.02 (0.96 , 1.08) 0.53
SO42-
1.02 (0.97 , 1.07) 0.47 NO3-
0.98 (0.93 , 1.03) 0.50 NH4+ 1.06* (0.99 , 1.14) 0.07
Stroke diseases OC 1.04 (0.98 , 1.10) 0.23
EC 0.98 (0.93 , 1.04) 0.51
SO42-
1.00 (0.95 , 1.05) 0.99 NO3- 1.01 (0.96 , 1.07) 0.62 NH4+
0.99 (0.93 , 1.06) 0.87
4. Discussion
There was a study in South Korea regarding the association between PM2.5 components and mortality. [22] They reported that both OC and ammonium were strongly related with cardiovascular mortality. Meanwhile, we found that EC and ammonium influenced much on cardiovascular mortality among PM2.5
components. Compared to our findings, it was the same result that the effects of ammonium were strongly impacted. However, our results showed that OC had the weakest health effect. Furthermore, the lag trend varied from our results. They described that the greatest RR was showed on concurrent day for PM2.5 and all PM2.5
components. However, our results described that RR estimates increased from concurrent day to lag 1 day except for ammonium.
Compared with their study, discrepancies were shown and therefore further study is needed.
Our findings indicate that sulfate and ammonium were more positively associated with cardiac diseases, and these findings were consistent with findings from previous studies [25, 26, 27, 28].
Burnett et al. [25] reported that sulfate could increase the risk of emergency room (ER) visits for cardiac disease in Ontario, Canada.
Burnett et al. [25] estimated that 13 µg/m3increase in sulfate was associated with 2.8% (95% CI: 1.8–3.8%) increase in cardiac hospital admissions. Furthermore, compared to female group, male was more associated with cardiac ER visits. The estimated
29
percentages of excess cardiac hospital admissions in male and female group were 3.4% per 13.0 µg/m3increase in sulfate (95% CI:
1.8–5.0%) and 2.0% per 13.0 µg/m3 increase in sulfate (95% CI:
0.2–3.7%), respectively. Although they observed hospital admissions for cardiac disease, the mechanisms for this effect imply the possibility of cardiac mortality increase with sulfate. Luttmann- Gibson et al. [26] also reported that sulfate was associated with increasing heart rate. Those authors investigated the percentage changes in heart rate in senior adults in Steubenville, Ohio. They found that heart rate was elevated by 0.8% (95% CI: -0.02–1.7%) with 5.1 µg/m3 increase in sulfate. Exposure to sulfate may induce heart rate, which possibly lead to cardiac disease [27, 28]. Another study investigated the toxic effects of ammonium ion [29]. They found that the ammonium transport in cell membranes lead to intracellular and extracellular pH changes. This mechanisms may affect cardiac muscle [30], which may induce cardiac disease.
Although our finding was not significant in ammonium on stroke disease, the RR value was positively estimated. Previous studies regarding the biological mechanisms for these relationship support our finding [31, 32]. Szerb and Butterworth et al. [31] have reported that ammonium ions may be associated with synaptic transmission, a central process in nervous system. They suggested that ammonium might disrupt glutamatergic excitatory transmission.
Moreover, blockade of synaptic transmission mediated by glutamate
N-methyl-D-aspartate (NMDA) receptors hinders neuronal survival and this process may could lead to stroke disease [32].
Limitation is that we used stationary air pollution data, rather than the individual’s exposures to PM2.5 and PM2.5
components, as it is difficult to examine the influence of air pollution exposure at the individual level. This approach may have introduced random errors in the PM2.5component data and led to a reduction in the related RR values [33]. In addition, PM2.5 components influence people when they are near ground level, while we collected PM2.5
component data on a rooftop of a large building, which may have created discordance between the air pollutant data and the exposure location. Furthermore, since we used the data measured in one area of Seoul, our study have inevitably assumed that School of Public Health building (37.5ºN and 127.00ºE) is a representative area of Seoul. We could not address measurements of air pollutant data in all parts of Seoul.
As Seoul is a representative traffic-congested region in South Korea, studies regarding the health effects of traffic-related air pollution have recently increased in importance. Thus, our data may help promote further research regarding the effects of PM2.5
components, and may facilitate the control and regulation of air pollution.
31 5. Conclusion
Our analyses revealed that PM2.5 mass and PM2.5
components were associated with cardiovascular mortality counts.
Except for nitrate, PM2.5 components had delayed effects on cardiovascular mortality counts up to lag 1 day. Sulfate and ammonium were significantly associated with mortality counts in cardiac diseases. Similarly, EC and ammonium were positively associated with mortality counts in stroke diseases. When we performed stratified analyses according to gender and age, lagged sulfate was associated with cardiac mortality counts in male group.
Based on our results, it appears that cardiac diseases are more influence on both sulfate and ammonium compared to stroke diseases. Furthermore, as sulfate, ammonium and EC are generally categorized as traffic-related air pollutants, our findings may facilitate health policy development and promote the management of traffic-related air pollutants.
Appendix. Figures and Tables
Figure A1: RRs per one IQR increase of PM and their components for cardiac diseases with different lag days (from 0 to 10 days before the concurrent day).
33
Figure A2: RRs per one IQR increase of PM and their components for stroke diseases with different lag days (from 0 to 10 days before the concurrent day).
Figure A3: RRs per one IQR increase of PM2.5 and its components on cardiovascular mortality counts for different lag days by gender.
35
Figure A4: RRs per one IQR increase of PM2.5 and its components on cardiovascular mortality counts for different lag days by age.
Figure A5: RRs per one IQR increase of PM2.5 and its components on cardiac mortality counts for different lag days by gender.
37
Figure A6: RRs per one IQR increase of PM2.5 and its components on cardiac mortality counts for different lag days by age.
Figure A7: RRs per one IQR increase of PM2.5 and its components on stroke mortality counts for different lag days by gender.
39
Figure A8: RRs per one IQR increase of PM2.5 and its components on stroke mortality counts for different lag days by age.
Table A1. Relative risks per one IQR increase of PM2.5and PM2.5components on cardiovascular mortality counts for different lag days.
Air pollution
Lag 0 day
Lag 1 day
Lag 2 day
Lag 3 day
Lag 4 day
Lag 5 day
Lag 6 day
Lag 7 day
Lag 8 day
Lag 9 day
Lag 10 day
PM2.5
1.03*
(1.00- 1.06)
1.04*
(1.02- 1.07)
0.98 (0.96-
1.01)
0.99 (0.96-
1.01)
1.01 (0.98-
1.03)
1.00 (0.98-
1.03)
0.98 (0.96-
1.01)
0.99 (0.96-
1.01)
1.02 (0.99-
1.04)
1.00 (0.98-
1.03)
1.00 (0.98-
1.02)
OC 1.01
(0.99- 1.03)
1.02*
(1.00- 1.05)
0.99 (0.97-
1.02)
0.99 (0.97-
1.02)
1.01 (0.99-
1.03)
1.00 (0.98-
1.03)
1.00 (0.98-
1.02)
0.98**
(0.96- 1.00)
1.01 (0.99-
1.04)
0.98 (0.96-
1.00)
0.99 (0.97-
1.01)
EC 1.02
(1.00- 1.04)
1.03*
(1.00- 1.05)
1.00 (0.97-
1.02)
1.00 (0.97-
1.02)
1.01 (0.98-
1.03)
1.02 (0.99-
1.04)
0.99 (0.97-
1.01)
0.99 (0.97-
1.01)
1.03*
(1.01- 1.05)
0.99 (0.97-
1.02)
1.00 (0.98-
1.02) SO42- 1.02
(1.00- 1.04)
1.02 (1.00-
1.04)
0.99 (0.97-
1.01)
1.00 (0.98-
1.02)
1.01 (0.99-
1.02)
0.98*
(0.96- 1.00)
0.99 (0.97-
1.01)
0.98**
(0.96- 1.00)
1.01 (0.99-
1.03)
1.00 (0.98-
1.02)
1.00 (0.98-
1.02) NO3- 1.01
(0.99- 1.03)
1.00 (0.98-
1.02)
0.98**
(0.96- 1.00)
0.99 (0.97-
1.01)
1.00 (0.98-
1.02)
0.99 (0.97-
1.01)
1.00 (0.98-
1.02)
0.99 (0.97-
1.01)
1.01 (0.99-
1.03)
1.00 (0.98-
1.03)
1.00 (0.97-
1.01) NH4+ 1.02
(0.99- 1.04)
1.01 (0.99-
1.03)
0.98 (0.96-
1.01)
1.00 (0.98-
1.02)
1.00 (0.98-
1.02)
0.98 (0.96-
1.01)
0.99 (0.96-
1.01)
0.99 (0.97-
1.02)
1.01 (0.99-
1.04)
1.00 (0.98-
1.03)
1.00 (0.98-
1.02)
* p-value of RRs < 0.05; ** p-value of RRs < 0.10
41
Table A2. Relative risks per one IQR increase of sulfate and ammonium on cardiac mortality counts by gender up to lag 4.
Air pollution Variables Lag 0 day Lag 1 day Lag 2 day Lag 3 day Lag 4 day
SO42-
Male 1.06*
(1.02-1.11)
1.03 (0.99-1.07)
1.04**
(1.00-1.09)
1.04**
(1.00-1.08)
1.01 (0.97-1.06)
Female 1.05*
(1.00-1.09)
1.00 (0.96-1.04)
0.97**
(0.93-1.01)
1.00 (0.96-1.05)
1.00 (0.96-1.04)
NH4+
Male 1.06*
(1.00-1.12)
1.04 (0.99-1.09)
1.01 (0.96-1.07)
1.02 (0.97-1.07)
1.00 (0.96-1.05)
Female 1.05**
(0.99-1.11)
1.01 (0.96-1.06)
0.92*
(0.87-0.96)
1.00 (0.95-1.06)
1.01 (0.96-1.06)
* p-value of RRs < 0.05; ** p-value of RRs < 0.10
Table A3. Relative risks per one IQR increase of sulfate and ammonium on stroke mortality counts by age up to lag 4.
Air pollution Variables Lag 0 day Lag 1 day Lag 2 day Lag 3 day Lag 4 day
SO42- Age < 65
years old 0.98 (0.92-1.05)
0.97 (0.91-1.04)
1.10*
(1.03-1.17)
0.96 (0.89-1.03)
1.02 (0.95-1.09) Age ≥ 65
years old 1.00 (0.97-1.04)
1.02 (0.98-1.06)
0.99 (0.95-1.02)
1.01 (0.97-1.04)
1.00 (0.97-1.03)
NH4+ Age < 65
years old 0.95 (0.87-1.03)
0.93**
(0.86-1.01)
1.11*
(1.02-1.19)
0.98 (0.90-1.06)
0.98 (0.90-1.06) Age ≥ 65
years old 1.04**
(1.00-1.08)
1.01 (0.97-1.05)
0.99 (0.95-1.03)
1.00 (0.97-1.04)
0.99 (0.95-1.03)
* p-value of RRs < 0.05; ** p-value of RRs < 0.10
43
Table A4. Sensitivity of the relative risks (RRs) per one IQR increase of PM2.5 on cardiovascular disease, cardiac and stroke mortality for the concurrent day by changing degree of freedom on
temperature/relative humidity.
Cardiovascular disease
Modeling Choices
df for relative humidity
RRs of sulfate
% Change
RRs of PM2.5
% Change
Base model
With temperat
ure
6/year
1.015833 0174182
4
- 1.029430
0346898 -
4/year
1.015832 9724635
4
-0.00
1.029430 0535579
6
+0.00
8/year
1.015832 9112384
1
-0.00
1.029430 0274883
9
-0.00
10/year
1.015832 8464567
6
-0.00
1.029430 0537321
6
+0.00
Base model
With relative humidity
3/year
1.015833 0174182
4
- 1.029430
0346898 -
5/year
1.015832 9495367
1
-0.00
1.029430 1608658
6
+0.00
10/year 1.015833
1549768 +0.00
1.029430 0419724
3
+0.00
Cardiac disease
Modeling Choices
df for relative humidity
RRs of sulfate
% Change
RRs of PM2.5
% Change
Base model
With temperat
ure
6/year
1.049372 5736232
7
-
1.040987 9601665
8
-
4/year
1.049372 4908732
8
-0.00
1.040987 9960026
1
+0.00
8/year
1.049372 4964632
8
-0.00
1.040988 0079265
3
+0.00
10/year
1.049372 4513064
1
-0.00
1.040987 9072762
4
-0.00
Base model
With relative humidity
3/year
1.049372 5736232
7
-
1.040987 9601665
8
-
5/year
1.049372 6134867
3
+0.00
1.040988 0639726
7
+0.00
1.049372 5850955
4
10/year
1.049372 5850955
4
+0.00
1.040987 8718505
3
-0.00
45
Stroke disease
Modeling Choices
df for relative humidity
RRs of sulfate
% Change
RRs of PM2.5
% Change
Base model
With temperat
ure
6/year
1.010250 1294888
5
-
1.040058 8939204
7
-
4/year
1.010250 1628194
6
+0.00 1.040058
9001752 +0.00
8/year
1.010250 1824073
4
+0.00
1.040058 8719902
5
-0.00
10/year
1.010250 1182931
8
-0.00
1.040058 8772029
8
-0.00
Base model
With relative humidity
3/year
1.010250 1294888
5
-
1.040058 8939204
7
-
5/year
1.010250 2236051
9
+0.00
1.040058 9567044
8
+0.00
10/year 1.010250
1967521 +0.00 1.040060
1555893 +0.00
Acknowledgements
This research was supported by a grant from the Natural Hazard Mitigation Research Group [MPSS-NH-2015-81], which is funded by the Korean Ministry of Public Safety and Security.
Bibliography
1. Bascom R, Bromberg PA, Costa DL, Devlin R, Dockery DW, Frampton MW, et al. Health effects of outdoor air pollution.
Am J Respir Crit Care Med 1996;153:477-498.
2. Bernstein JA, Alexis N, Barnes C, Bernstein IL, Nel A, Peden D, et al. Health effects of air pollution. J Allergy Clin Immunol 2004;114:1116-1123.
3. Brunekreef B, Holgate ST. Air pollution and health. Lancet 2002;360:1233-1242.
4. Dab W, Medina S, Quenel P, Le Moullec Y, Le Tertre A, Thelot B, et al. Short term respiratory health effects of ambient air pollution: Results of the Aphea Project in Paris. J Epidemiol Community Health 1996;50:s42-s46.
5. Kampa M, Castanas E. Human health effects of air pollution.
Environ Pollut 2008;151:362-367.
6. Katsouyanni K, Touloumi G, Spix C, Schwartz J, Balducci F, Medina S, et al. Short-term effects of ambient sulphur dioxide and particulate matter on mortality in 12 European cities: results from time series data from the APHEA project.
Air Pollution and Health: a European Approach. BMJ 1997;314:1658.
7. Neidell MJ. Air pollution, health, and socio-economic status:
The effect of outdoor air quality on childhood asthma. J Health Econ 2004;23:1209-1236.
47
8. Romieu I, Meneses F, Ruiz S, Sienra JJ, Huerta J, White MC, et al. Effects of air pollution on the respiratory health of asthmatic children living in Mexico City. Am J Respir Crit Care Med 1996;154:300-307.
9. Brook RD, Franklin B, Cascio W, Hong Y, Howard G, Lipsett M, et al. Air pollution and cardiovascular disease: a statement for healthcare professionals from the Expert Panel on
Population and Prevention Science of the American Heart Association. Circulation 2004;109:2655-2671.
10. Hatzakis A, Katsouyanni K, Kalandidi A, Day N, Trichopoulos D. Short-term effects of air pollution on mortality in Athens.
Int J Epidemiol 1986;15:73-81.
11. Lin H, Tao J, Du Y, Liu T, Qian Z, Tian L, et al.
Differentiating the effects of characteristics of PM pollution on mortality from ischemic and hemorrhagic strokes. Int J Hyg Environ Health 2016;219:204-211.
12. Schwartz J. Air pollution and daily mortality: A review and meta analysis. Environ Res 1994;64:36-52.
13. Spix C, Heinrich J, Dockery D, Schwartz J, Völksch G, Schwinkowski K, et al. Air pollution and daily mortality in Erfurt, East Germany, 1980-1989. Environ Health Perspect 1993;101:518.
14. Touloumi G, Pocock S, Katsouyanni K, Trichopoulos D.
Short-term effects of air pollution on daily mortality in Athens: A time-series analysis. Int J Epidemiol
1994;23:957-967.
15. Wong CM, Vichit-Vadakan N, Kan H, Qian Z. Public Health and Air Pollution in Asia (PAPA): a multicity study of short- term effects of air pollution on mortality. Environ Health Perspect 2008;116:1195.
16. Brook RD, Rajagopalan S, Pope CA, Brook JR, Bhatnagar A, Diez-Roux AV, et al. 2010. Particulate matter air pollution and cardiovascular disease. Circulation 121:2331-2378.
17. Crouse DL, Peters PA, van Donkelaar A, Goldberg MS, Villeneuve PJ, Brion O, et al. 2012. Risk of nonaccidental and cardiovascular mortality in relation to long-term exposure to low concentrations of fine particulate matter: A canadian national-level cohort study. Environmental health
perspectives 120:708.
18. Health Effects Institute. https://www.stateofglobalair.org/air 19. Ministry of Environment.(2016). Case Management
Background and Context.[ebook] p.25. Available at:
https://www.me.go.kr/issue/finedust/ebook.pdf [Accessed Apr. 2016]
20. Hoek G, Brunekreef B, Verhoeff A, Wijnen JV, Fischer P.
Daily mortality and air pollution in the Netherlands. Journal of the Air & Waste Management Association 2000;50:1380- 1389.
21. Ostro B, Feng W-Y, Broadwin R, Malig B, Green R, Lipsett M.
2008. The impact of components of fine particulate matter on cardiovascular mortality in susceptible subpopulations.
Occupational and environmental medicine 65:750-756.
22. Heo J, Schauer JJ, Yi O, Paek D, Kim H, Yi SM. Fine particle air pollution and mortality: Importance of specific sources and chemical species. Epidemiology 2014;25:379-388.
23. Heo J-B, Hopke P, Yi SM. Source apportionment of PM 2.5 in Seoul, Korea. Atmos Chem Phys 2009;9:4957-4971.
24. Kim HS, Huh JB, Hopke PK, Holsen TM, Yi SM.
Characteristics of the major chemical constituents of PM 2.5 and smog events in Seoul, Korea in 2003 and 2004. Atmost Environ 2007;41:6762-6770.
25. Burnett RT, Dales R, Krewski D, Vincent R, Dann T, Brook JR. 1995. Associations between ambient particulate sulfate and admissions to ontario hospitals for cardiac and
respiratory diseases. American journal of epidemiology 142:15-22.
49
26. Luttmann-Gibson H, Suh HH, Coull BA, Dockery DW, Sarnat SE, Schwartz J, et al. 2006. Short-term effects of air
pollution on heart rate variability in senior adults in
steubenville, ohio. Journal of occupational and environmental medicine 48:780-788.
27. Wo CC, Shoemaker WC, Appel PL, Bishop MH, Kram HB, Hardin E. 1993. Unreliability of blood pressure and heart rate to evaluate cardiac output in emergency resuscitation and critical illness. Critical care medicine 21:218-223.
28. Mcgregor M, Klassen GA. 1964. Observations on the effect of heart rate on cardiac output in patients with complete heart block at rest and during exercise. Circulation research 15:II-215–II-221.
29. Martinelle K, Häggström L. 1993. Mechanisms of ammonia and ammonium ion toxicity in animal cells: Transport across cell membranes. Journal of biotechnology 30:339-350.
30. Bountra C, Vaughan-Jones R. 1989. Effect of intracellular and extracellular ph on contraction in isolated, mammalian cardiac muscle. The Journal of Physiology 418:163.
31. Szerb JC, Butterworth RF. 1992. Effect of ammonium ions on synaptic transmission in the mammalian central nervous system. Progress in neurobiology 39:135-153.
32. Ikonomidou C, Turski L. 2002. Why did nmda receptor antagonists fail clinical trials for stroke and traumatic brain injury? The Lancet Neurology 1:383-386.
33. Lee JY, Kim H. Projection of future temperature-related mortality due to climate and demographic changes. Environ Int 2016;94:489-494.
초록
서울대학교 보건대학원
보건학과 보건통계학 전공
황성희
<연구배경> 기존의 많은 역학 연구들에서는 초 미세먼지와 심혈관계 질환 사망에 대한 연관성에 밝혔다. 하지만 초 미세먼지를 구성하는 성분과의 연관성에 대한 연구는 그에 비해 잘 진행되지 않았다. 따라서, 본 연구에서는 유기 탄소(OC), 원소 탄소(EC), 황산염(SO42-), 질산염(NO3-) 그리고 암모늄(NH4+) 과 같은 초 미세먼지 구성 성분과 심혈관계 질환들 과의 연관성을 파악해 보고자 한다.
<연구방법> 본 연구에서는 과 산포를 고려한 시계열 분석을 실시하였다.
통계적 모형은 일반화 가법 모형 (GAM: Generalized additive model) 을 적용하였으며, 온도, 상대습도와 같은 confounder (혼란변수) 에 대해 보정을 실시하였다.
<연구결과> 심혈관계 질환 사망률에 영향을 가장 많이 끼친 초 미세먼 지 구성 성분은 EC (상대 위험도: 1.02; 95% 신뢰구간: 1.00–1.04) 이었 다. EC 다음으로는 NH +, SO 2-, OC 그리고 NO -의 순서대로 관련이 있
51 었다. 심장 질환 사망률에는, SO42-
와 NH4+
이 영향을 미쳤다. 추정된 상대위험도는 각각 1.05 (95% 신뢰구간: 1.02–1.08) 와 1.05 (95% 신뢰 구간: 1.01–1.09) 이었다. 뇌졸중 질환 사망률에는, EC 와 NH4+
이 영향 을 미쳤다 추정된 상대위험도는 각각 1.02 (95% 신뢰구간: 0.99–1.06)와 1.02 (95% 신뢰구간: 0.98–1.06) 이었다.
<결론> 초 미세먼지 구성성분과 심혈관계 질환 사망에 대한 연관성이 발견되었다. 심장 질환에서는, SO42-과 NH4+ 가 관련이 있었다. 남성 집 단에서는 SO42-
구성성분이 지연효과를 보였다. 비슷하게, 뇌졸중 질병 에서는, EC와 NH4+ 가 관련이 있었다. 초 미세먼지 구성성분은 교통과 산업으로 인한 대기 오염과 관련이 있기 때문에, 우리의 결과는 대기 오 염 규제와 공중 보건 향상에 도움이 될 것이라고 사료된다.
주요어: 대기 오염, 초 미세먼지, 초 미세먼지 구성 성분, 심혈관계 질환, 연관 성, 상대 위험도, 사망.
학생 번호: 2015-24085