저작자표시-비영리-변경금지 2.0 대한민국 이용자는 아래의 조건을 따르는 경우에 한하여 자유롭게
l 이 저작물을 복제, 배포, 전송, 전시, 공연 및 방송할 수 있습니다. 다음과 같은 조건을 따라야 합니다:
l 귀하는, 이 저작물의 재이용이나 배포의 경우, 이 저작물에 적용된 이용허락조건 을 명확하게 나타내어야 합니다.
l 저작권자로부터 별도의 허가를 받으면 이러한 조건들은 적용되지 않습니다.
저작권법에 따른 이용자의 권리는 위의 내용에 의하여 영향을 받지 않습니다. 이것은 이용허락규약(Legal Code)을 이해하기 쉽게 요약한 것입니다.
Disclaimer
저작자표시. 귀하는 원저작자를 표시하여야 합니다.
비영리. 귀하는 이 저작물을 영리 목적으로 이용할 수 없습니다.
변경금지. 귀하는 이 저작물을 개작, 변형 또는 가공할 수 없습니다.
Theoretical study on
supercontinuum generation and pulse dynamics in gain-embedded
nonlinear optical media
광학적 이득이 포함된 비선형 광학적 매질에서의 초연속체 생성 및 펄스 역학에 관한 이론적 연구
By
KYOUNGYOON PARK
FEBRUARY 2020
DEPARTMENT OF ELECTRICAL AND COMPUTER ENGINEERING
COLLEGE OF ENGINEERING
SEOUL NATIONAL UNIVERSITY
Theoretical study on
supercontinuum generation and pulse dynamics in gain-
embedded nonlinear optical media
광학적 이득이 포함된 비선형 광학적 매질에서의 초연속체 생성 및 펄스 역학에 관한 이론적 연구
지도 교수 정 윤 찬
이 논문을 공학박사 학위논문으로 제출함 2020 년 2 월
서울대학교 대학원 전기정보공학부
박 경 윤
박경윤의 공학박사 학위 논문을 인준함 2020 년 2 월
위 원 장 (인)
부위원장 (인)
위 원 (인)
위 원 (인)
위 원 (인)
i
`Abstract
Theoretical study on supercontinuum generation and pulse dynamics in gain-
embedded nonlinear optical media
KYOUNGYOON PARK DEPARTMENT OF ELECTRICAL AND COMPUTER ENGINEERING COLLEGE OF ENGINEERING SEOUL NATIONAL UNIVERSITY
In this dissertation, supercontinuum generation (SCG) and related soliton dynamics in gain-embedded highly nonlinear photonic crystal fibers (HNL-PCFs) are numerically and theoretically analyzed in anomalous dispersion (AD) and flattened all-normal dispersion (FAND).
The first part of the dissertation introduces the fundamental of fiber optics, fiber lasers, and nonlinear fiber optics. Based on the background knowledge on fiber optics, fiber lasers, and nonlinear fiber optics, the fundamental principle of SCG is briefly overviewed, which is a key basis for this dissertation.
Then, a numerical model of dynamics of ultrafast pulses under dispersive, nonlinear, and optical gain effects. First, the well-
ii
known numerical model on evolution of ultrafast pulses in HNL- PCFs, nonlinear Schrödinger equation (NLSE), is discussed.
Moreover, optical bright solitons (BSs) and dark solitons (DSs), the key elements of the SCG, are introduced briefly. Then, a numerical model of optical gain effects on sub-fs ultrafast pulses is suggested.
Especially, a semi-classical numerical model based on the generalized complex Ginzburg-Landau equation (GCGLE) is suggested in order to take account of ultrafast interactions between gain ions and ultrafast solitons.
Based on the GCGLE, SCG in a rare-earth doped HNL-PCF with AD in the sub-ps pulse regime is numerically investigated.
The SCG characteristics of an active HNL-PCF is compared with a passive-type counterpart, unveiling novel optical gain effects.
Moreover, gain-induced soliton dynamics, such as soliton- cascade-like behaviors, soliton-quasi-soliton collisions, and phase-matched dispersive wave generation, is rigorously analyzed, which eventually contributes to enhancement of energy scaling of SC radiation without incurring considerable degradation of its spectral flatness.
As a counterpart of SCG in a rare-earth doped HNL-PCF with AD, SCG in a rare-earth doped HNL-PCF with FAND in the sub- picosecond pulse regime is also numerically investigated. In particular, spontaneous generation of DSs in FAND regime and its physical mechanism of the DS generation is discussed. By the combined effect of the optical gain and Raman scattering, Raman-
iii
induced oscillatory structure (RIOS) is emitted at the outermost blue-shifted SPM peak, and it develops dark solitons under the optical gain effect. The emitted dark solitons significantly affect SCG characteristics such as spectral bandwidth and shot-to-shot coherence. Consequently, it is proven that the utilization of active fibers for SCG yields bandwidth- or coherence-controllable SCG system.
Therefore, this study suggests the possibility of further improvement of SCG by exploiting the novel active-type HNL- PCFs, which is all-in-one structure of a passive-type HNL-PCF and a rare-earth doped fiber. Furthermore, soliton dynamics related to SCG in active HNL-PCFs is drastically different to the conventional soliton dynamics of SCG in passive fibers. The reason is that in active HNL-PCFs, the soliton dynamics correlated with SCG is actually the soliton dynamics in open systems where external energy inflows are present. The energy inflow causes various soliton dynamics, which have not been observed in soliton dynamics in a closed system. For example, soliton clusters, collisions of a soliton and a quasi-soliton, spontaneous and eruptive generation of DSs, and DS-based coherence collapse. Such novel soliton dynamics in an open system will open up new possibilities for extended power-scaling, controlled spectral broadening and shot-to-shot coherence of SCG.
Keyword : Fiber laser, Nonlinear fiber optics, Optical soliton,
iv
Supercontinuum, Ultrafast optics, Quantum optics Student Number : 2013-20789
i
Table of contents
Abstract ... i
List of Figures ... iii
List of Tables ... x
Nomeclature ... xi
1. Introduction ... 1
1.1 Fiber optics ... 1
1.2 Fiber laser ... 9
1.3 Nonlinear fiber optics ... 13
1.4 Supercontinuum generation ... 14
1.5 Motivation ... 17
1.6 Scope of the study ... 21
2. Numerical model of ultrafast optics active and nonlinear media ... 22
2.1 Numerical model of ultrafast optics ... 22
2.2 Semiclassical model of light-matter interactions .... 30
2.3 Gain saturation effect by an ultrafast pulse train ... 44
3. Superconitnuum generation and bright soliton dynamics in gain-embedded highly nonlinear photonic crystal fibers with anomalous dispersion ... 50
3.1 Background of the study ... 50
3.2 Numerical model and methods ... 54
ii
3.3 Gain effects and soliton dynamics on SCG in the AD regime ... 61 3.4 Comparative analysis of energy-scaling scheme for SCG ... 72 3.5 Direct amplification of SC radiation ... 76
4. Superconitnuum generation and dark soliton dynamics in gain embedded highly nonlinear photonic crystal fibers with flattend all-normal dispersion ... 79
4.1 Background of the study ... 79 4.2 Numerical model ... 84 4.3 Review of SCG in active FAND-PCFs in low gain regime ... 87 4.4 Eruptive generation of Dss on SCG in active FAND- PCFs ... 91 4.5 Raman-induced oscillatory structure ... 100 4.6 DS dynamics and its impact on SCG in active FAND- PCFs ... 109
5. Concluding remarks ... 120
Appendix A. Derivation of Maxwell-Bloch equation in two- level and the saturation energy ... 125
Bibliography ... 131
Abstract in Korean ... 141
iii
List of Figures
Fig. 1.1.1. Attenuation spectrum of typical silica fibers ... 3
Fig. 1.1.2. Transverse mode profiles that multi-mode fibers can support ... 4
Fig. 1.1.3. A typical example of GVD profile of optical fiber...
... 7
Fig. 1.1.4 (a) SEM micrographs of a PCF, (b) Graphics of a PCF with a index profile ... 9
Fig. 1.2.1 Schematic diagram of a fiber amplifier made using rare-earth doped fibers ... 11
Fig. 1.2.2 Wavelength range of fiber laser according to the type of rare-earth ion ... 12
Fig. 1.4.1 Scheme of SCG via highly nonlinear PCF ... 15
Fig. 1.4.2. SCG via highly nonlinear PCF ... 16
Fig. 1.5.1. Concpet of the amplification system of brandband SC radiations ... 17
Fig. 1.5.2. Concpet of the amplification system of brandband
SC radiations: (a) SCG system without any amplifier stages
and its output spectrum as a reference, (b) SCG system with
an ampflier stage after the HNL-PCF and output spectrum,
iv
(c)SCG system with a pre-amplifier stage before the HNL- PCF and its output spectrum, (d) SCG system made of an active HNL-PCF which is an all-in-one system of the HNL- PCF and the fiber amplifier, and the resultant output spectrum ... 19
Fig. 2.1.1. Temporal variation of SPM-indued phase shift and frequency chirp for Gaussian (dahsed curve) and super- Gaussian (solid curve) pulses ... 26
Fig. 2.1.2. (a) Raman gain spectrum and (b) phase response obtained by Eq. (2.1.9) ... 27
Fig. 2.1.3. Three dimensional visualization of propagation of (a) BS and (b) DS. Intensity profile of (c) BS and (d) DS.
Phase profile of (e) BS and (d) DS. From this figure, one can find that BS is symmetric, whereas DS is anti-symmetric ...
... 29
Fig. 2.2.1. (a) State diagram of two states in classical physics, (b) State diagram of two states in quantum physics called as Bloch vector representation ... 30
Fig. 2.2.2. Electric field induces microscopic dipole moment according to the laws of quantum mechanics. These moments are then summed to yield the macroscopic polarization of the medium, which acts as a source in Maxwell’s equations. The condition of self-consistency then requires that the assume field equal to the reaction field ... 33
Fig. 2.2.3. Interaction of multiple pulses with the fixed
repetition rate and atoms where quantum coherence is
negligible, and the condition of gain saturation ... 36
v
Fig. 2.2.4. Er
3+energy level ... 38
Fig. 2.2.5. Yb
3+energy level ... 41
Fig. 2.2.6. A pulse train with a fixed repetition rate ... 45
Fig. 2.2.7. Change of the population inversion during amplification of supercontinuum pulse and validity of Eq.
(2.3.14) ... 49
Fig. 3.2.1. Conceptual schematic of SCG in an Yb-doped active HNL-PCF. LD: Laser diode, OSA: Optical spectrum analyzer. ... 55
Fig. 3.3.1. Evolutions of SC radiation in passive and active HNL-PCFs. (a) and (b): Spectral evolutions in the passive HNL-PCF (g
us= 0 dB/m) and in the active HNL-PCF (g
us= 40 dB/m), respectively. (c) and (d): Temporal evolutions in the passive case and in the active case, respectively. (e) and (f): Evolutions of 20-dB BW and AESD in the passive case and in the active case, respectively. Note that the output spectra and temporal traces are put on top of the figures of (a)-(d), respectively. ... 64
Fig. 3.3.2. Detailed soliton formation and dynamics in the active HNL-PCF. (a) Zoomed-in image of the part enclosed by the rectangle in a white-dashed line in Fig. 2(e). (b) Formation of solitons and QSs, and their collision dynamics.
The inset is the zoomed-in image of the part enclosed by the
rectangle in a white-solid line in (b). (c) Spectrograms and
the linear-scale intensity profiles corresponding to Stage I,
Stage II, and Stage III. S: Soliton; QS: Quasi-soliton. (d)
vi
Dispersion relations of the corresponding soliton, QS, and the HNL-PCF ... 68
Fig. 3.3.3. Output spectrograms for the passive and active HNL-PCFs. (a) Passive HNL-PCF case (g
us= 0 dB/m). (b) Active HNL-PCF case (g
us= 40 dB/m) ... 71
Fig. 3.4.1. Characteristics of the passive HNL-PCF case combined with initially energy-boosted input and the active HNL-PCF case. (a) and (b): Spectral evolutions in the passive HNL-PCF case with initially energy-boosted input and in the active HNL-PCF case, respectively. (c) and (d):
Evolutions of 20-dB BW (blue) and AESD (red) in the passive HNL-PCF case with initially energy-boosted input and in the active HNL-PCF case. (e) and (f): Total numbers of solitons generated in the passive HNL-PCF case with initially energy-boosted input and in the active HNL-PCF case, respectively. ... 74
Fig. 3.5.1. Characteristics of the passive HNL-PCF case combined with a conventional amplifier based on a low- nonlinearity YDF and the active HNL-PCF case. (a) and (b):
Spectral evolutions in the passive HNL-PCF case combined with a conventional amplifier based on a low-nonlinearity YDF and in the active HNL-PCF, respectively. (c) and (d):
Evolutions of 20-dB BW (blue) and SFM (red) within the 20-dB BW in the passive HNL-PCF case combined with a conventional amplifier based on a low-nonlinearity YDF and in the active HNL-PCF, respectively ... 78
Fig. 4.3.1. spectral evolution of a 1-nJ input pulse through the
HNL-PCF with (a) zero-gain or (b) 20-dB/m gain (L: length
vii
of the HNL-PCF). Lower: 20-dB BW (blue) and AESD (green) of the signal pulse with respect to the fiber length for (c) zero-gain or (d) 20-dB/m gain ... 88
Fig. 4.3.2. Temporal evolution of a 1-nJ input pulse through the HNL-PCF with (a) zero-gain or (b) 20-dB/m gain.
FWHM width (blue) and peak power (green) of the signal pulse with respect to the fiber length for (c) zero-gain or (d) 20-dB/m gain ... 89
Fig. 4.3.4. Upper: spectral evolution of a 1-nJ SC input pulse through (a) the YDF of 1.9 m or (b) the active HNL-PCF of 3.4 m. Lower: 20-dB BW (blue) and SFM (green) of the signal pulse with respect to the fiber length for (c) the YDF PCF of 1.9 m or (d) the active HNL-PCF of 3.4 m ... 90
Fig. 4.4.1. Spectral and temporal evolution of SCG seeded by a 1.0-nJ sub-ps pulse with four different gain coefficients:
0-dB/m for (a) and (b), 10-dB/m for (c) and (d), 20-dB/m for (e) and (f), and 30-dB/m for (g) and (h). ... 95
Fig. 4.4.2 Dark pulses atop the SC pulse with 30-dB/m gain coefficient, which are zoomed-in pictures of Fig. 1(h). (a) Dark pulses in a range of 0.35 ~ 0.39 ps, (b) Dark pulses in a range of 2.11 ~ 2.15 ps. (c) Curve fitting of the white-circled dark pulse in (a) with a tanh
2curve and its phase profile, (d) Curve fitting of the white-circled dark pulse in (b) with a tanh
2curve and its phase profile ... 96
Fig. 4.4.3. Output temporal intensity profile for four cases: (a)
output temporal intensity profiles of Case I (with 0-dB/m gain
coefficient and without IRS) and Case III (with 0-dB/m gain
coefficient and with IRS), (b) output temporal intensity
viii
profiles of Case II (with 30-dB/m gain coefficient and without IRS) and Case IV (with 30-dB/m gain coefficient and with IRS). Temporal evolution of SC pulses for four cases: (c) Case I, (d) Case II, (e) Case III, and (f) Case IV. ... 98
Fig. 4.4.4. (a) Temporal intensity profiles and (b) corresponding spectra of Case II and IV for a given distance.
... 101
Fig. 4.5.1. Two dynamics regime in FWM-SRS coupled dynamics: (a) SRS-dominant regime and (b) FWM-dominant regime. (c) continuous energy transfer belonging to both (a) or (b). Stokes and anti-Stokes power with respect to the distance when (d) P
p= 47 W and g
0= 0 dB/m, (f) P
p= 47 W and g
0= 4 dB/m, (h) P
p= 4700 W and g
0= 0 dB/m, and (j) P
p= 4700 W and g
0= 4 dB/m. (e)-(k) are phase evolutions corresponding to (d)-(j), respectively. ... 107
Fig. 4.5.2. Evolution of (a) 20-dB BW and (b) peak power of the SC pulse for four cases ... 108
Fig. 4.5.3. (a) DS generation by RIOS in a cascading way. (b) Repulsive collision of DSs. A: Collision of two DSs, B:
Collision of multiple DSs ... 109
Fig. 4.6.1. Spectrograms of SC lights in an active FAND-PCF with 30-dB/m gain with respect to four different distances:
(a) 1.0 m (State I), (b) 1.3 m (State II), (c) 1.5 m (State III), and (d) 2.2 m (State IV). ... 113
Fig. 4.6.2. Output spectrograms for (a) Case II and (b) IV. .. . ... 114
Fig. 4.6.3. (a) Temporal evolution of SCG with 20-dB/m gain
coefficient and one-photon-per-mode noise. (b) Normalized
ix
autocorrelation traces for the input and two output pulses:
passive and active FAND-PCFs ... 116
Fig. 4.6.4. (a) Spectrally averaged coherence value, (b) 20- dB BW, and AESD of SC pulses generated via an active FAND-PCF with respect to gain coefficient. (c) Output coherence spectra and (d) ensemble-averaged output spectral intensities corresponding to (a) and (b), respectively.
... 118
Fig. 4.6.5. (a) Spectrally averaged coherence value, (b) 20-
dB BW, and (c) AESD of SC pulses generated via an active
FAND-PCF for various fiber lengths and gain coefficients. .. .
... 119
x
List of Tables
Table 3.2.1. Simulation parameters ... 60
Table 4.2.1. Simulation parameters ... 87
xi
Nomenclature
Acronyms / Abbreviations AD Anomalous dispersion
AESD Averaged energy spectral density BS Bright soliton
BW Bandwidth
CW Continuous wave DS Dark soliton DW Dispersive wave
FAND Flattened all-normal dispersion FWM Four-wave mixing
GCGLE Generalized complex Ginzburg-Landau equation GVD Group velocity dispersion
HNL Highly-nonlinear
IRS Intrapulse Raman scattering IST Inverse scattering transform
KdVBE Korteweg-deVries-Burgers equation MBE Maxwell-Bloch equation
ND Normal dispersion
NLSE Nonlinear Schrödinger equation OWB Optical wave breaking
PCF Photonic crystal fiber
xii QS Quasi-soliton
RIOS Raman-induced oscillatory structure RISW Roman-induced shock wave
RSSFS Raman soliton self-frequency shift SC Supercontinuum
SCG Supercontinuum generation SFM Spectral flatness measurement SPM Self-phase modulation
SRS Stimulated Raman scattering XPM Cross-phase modulation YDF Ytterbium-doped fiber ZDW Zero-dispersion wavelength
1
Chapter 1
Introduction
1.1. Fiber optics
1.1.1. Overview on fiber optics
Optical fiber is a transparent cylindrical dielectric waveguide, consisting of a high index core and a low index cladding [1, 2].
Light waves entering the optical fiber are guided by the principle of total internal reflection caused by the index difference between the core and cladding [1]. The waveguide structure using total reflection in silica was proposed in 1960, but the optical loss in the initial optical fiber was very lossy to over 1000 dB/km [2].
However, after continuous technical advances, silica-based optical fibers with low losses of 0.2 dB/km in the 1550-nm wavelength band were developed in 1979, which led to a major breakthrough in optical communications [3]. In addition, low loss silica fibers have enabled waveguides of high-power lasers as well as optical communications, creating the field of nonlinear fiber optics [1, 4]. In 1972, the results of Raman scattering and Brillouin scattering,
2
which are representative phonon-photon interactions, could be observed in optical fibers [5, 6]. Moreover, optical bright soliton (BS) and dark soliton (DS) were theoretically predicted by Hasegawa and Tappert [7] and experimentally observed in 1980 [8]. In addition, various nonlinear optical phenomena have been studied, including self-phase modulation (SFM), four-wave mixing (FWM), and optical parametric amplification (OPA) in optical fibers [1]. In particular, nonlinear optical phenomena easily occur when high-peak power pulses are launched through optical fibers, so that various pulse light sources exploiting nonlinear phenomena have been studied. Representative examples include mode-locked soliton laser [9], dissipative soliton laser [10], Kerr cavity soliton [11], supercontinuum (SC) generation (SCG) [12], etc. Among them, SCG, the main topic of this paper, is a phenomenon in which various kinds of nonlinear optical effects such as optical soliton, Raman scattering, SFM, and FWM simultaneously occur and interact each other, thereby generating optical spectrum extends up to several hundred or thousand nanometers [12]. Such ultra-wideband light sources can be applied to various research fields, including optical communication, optical sensors, and optical imaging. The emergence of optical fibers has caused remarkable advances in laser optics, not only in optical communication, but also in the generation of various light sources exploiting nonlinear optical effects.
3
Fig. 1.1.1. Attenuation spectrum of typical silica fibers (Ref. [13])
1.1.2. Fiber mode
In this dissertation, I will deal with nonlinear optics based on optical fiber, so I will discuss basic properties of optical fiber. In general, a fiber in which the constant core index and the constant cladding index are clearly distinguished is called a step-index fiber, which is currently widely used in optical communication or fiber laser research [14]. This step-index fiber supports a transverse mode due to the boundary condition of the core and cladding [14].
The number of modes that an optical fiber can support depends on the V-number, and the V-number is calculated as follows.
(
2 2)
1/20 core clad
V=k a n −n (1.1.1)
where k0 = 2π/λ, a is the core radius, and λ is the wavelength of light.
4
Fig. 1.1.2. Transverse mode profiles that multi-mode fibers can support (Ref. [15])
5
If V <2.405, the step-index fiber supports single mode, and V >
2.405 supports multi modes. The transverse intensity profile and effective propagation constant of the mode that a step-index fiber can be calculated by solving eigenvalue equations which is derived by applying boundary conditions to the Maxwell equations (See Ref.
[14] for details of the calculation). Figure 1.1.2 shows the transverse intensity profiles of different modes of multi-mode fibers. In this paper, single mode condition (i.e. V < 2.405) is assumed unless otherwise specified.
1.1.3. Fiber dispersion
When light is guided in a dielectric medium such as a silica fiber, the light interacts with bound electrons of the dielectric medium.
Bound electrons can be assumed to be trapped by harmonic potentials generated by atoms, which can be used to model the interaction of light with bound electrons [16]. Since light acts as the driving force of bound electrons, the response of bound electrons varies with frequency of the light and has a resonance when the frequency of the light matches the resonant frequency of the bound electrons [17]. As a result, the susceptibility and refractive index change depending on the frequency of light, which is called as material dispersion, and usually described by the Drude-Lorentz model. According to the Drude-Lorentz model, the refractive index is approximated by the following equation.
6
( )
22
2 2
1
1 k k
k k
n B
=
= +
− . (1.1.2)This equation is called the Sellmeier equation, which is mainly used to characterize the dispersion characteristics of optical fibers [1, 14, 16-18].
The derivative of refractive index with respect to frequency causes the propagation speed of the light to be guided in the optical fiber to vary with frequency. Therefore, the dispersion characteristics have significant influences on the propagation of non-monochromatic waves or multi-monochromatic waves in optical fibers. In general, dispersion in an optical fiber is expressed by a propagation constant, which is
( ) ( ) ( ) ( )
( )
2
0 1 0 2 0
0
1 2
!
k k k
n c
k
= = + − + − +
=
− , (1.1.3)where
0
k
k k
d d
=
= (k = 0, 1, 2, …). (1.1.4)
Each Taylor series of propagation constants has a different physical meaning. β0 is the propagation constant at the center frequency, β1 is the group index for a given frequency, and β2 is the change in group index with frequency (i.e. group velocity dispersion (GVD)), which are expressed as following [1]:
( )
0 0 0n c
= , (1.1.5)
7
1 g 1
n dn
c c n d
= = + , (1.1.6)
2
1dng
c d
= . (1.1.6)
Figure 1.1.3 is shows changes of β2 with respect to wavelength. In Fig. 1.1.3, one can see that there is a zero-dispersion wavelength (ZDW) in which β2 = 0. Wavelengths lower than the ZDW have positive β2 values, which we say are in the normal dispersion (ND) region. Wavelengths higher than the ZDW have negative β2 values, which we say are in the anomalous dispersion (AD) region. In the ND region, the group index at the red wavelength is smaller than the group index at the blue wavelength, so the group velocity at the red wavelength is faster than the group velocity at the blue wavelength. On the other hand, in the AD region, exactly as opposed to the ND region, the group velocity at blue wavelength is faster than the group velocity at red wavelength. Although GVD is highly influenced by material dispersion, it is also affected by mode dispersion, so it is possible to control GVD to obtain desired GVD characteristics through fiber index engineering [1, 18].
2
Zero dispersion wavelength
Anomalous dispersion Normal
dispersion
Fig. 1.1.3. A typical example of GVD profile of optical fiber
8 1.1.4. Various types of optical fiber
In addition to the step index fiber, various optical fibers have been developed for various fiber-optic applications. For example, graded index optical fibers have been developed for reducing modal dispersion [19], dispersion-engineered dispersion shifted or compensated fibers have been implemented to obtain a desired GVD characteristics at a given wavelength range [20], large mode area fibers [15] and anti-resonant fibers [21] have extensively exploited for high-power fiber laser applications, and photonic crystal fibers (PCFs), in which light is guided by the photonic crystal structure, have attracted researchers’ attentions in virtue of its unique waveguide properties [12]. PCF is divided into photonic-bandgap fiber where light is guided in bandgap due to photonic crystal structure, holey fiber guiding along hole, and hole- assisted fiber guiding to core by surrounding hole [18].
These fibers have been used for various purposes, depending on their dispersion and nonlinear properties. Low-linearity anti- resonant fibers, photonic bandgap fibers, and large mode area fibers can be used to deliver high-powered fiber lasers, and hole- assisted PCFs with high nonlinearity due to narrow core areas can convert wavelengths using nonlinearities.
9 (a)
(b)
Fig. 1.1.4 (a) SEM micrographs of a PCF in Ref. [22, 23], (b) Graphics of a PCF with a index profile in Ref. [23].
1.2. Fiber laser
The optical fiber is a cylindrical low-loss waveguide, the cross-sectional width of which is as narrow as a few micrometers and which longitudinal length can range from a few meters to hundreds of kilometers. Such fiber geometry ensures excellent performance as fiber-based optical amplifiers as well as optical
10
transmission in optical communications [1]. Fiber-based optical amplifiers are made by doping rare-earth ions, such as Ytterbium (Yb), Erbium (Er), or Thulium (Tm), to core area of optical fibers [18, 24]. In fiber-based optical amplifiers, launched light is amplified by stimulated emission from excited rare-earth ions. The most distinctive feature of the fiber-based optical amplifier compared to other optical amplifiers is that it is a waveguide-type amplifier, which allows to maintain the transverse mode of light and keep the beam quality high. In addition, the optical gain and amplification efficiency are high because it is amplified through a long optical fiber [24]. Such narrow and long geometries of fiber- based optical amplifiers also have the advantage of easier thermal management than bulk structures [25, 26]. Furthermore, the development of a double clad optical fiber allows high brightness pump light to be guided in an inner clad and interact more efficiently with gain ions, thereby leading to the emergence of new field of high-power fiber laser. In 2004, the development of high-power fiber lasers was greatly advanced, thereby breaking the 1-kW barrier with continuous wave (CW) Yb-doped fiber amplifiers [25].
Fiber-based optical amplifiers can be easily inserted into the resonator structure by exploiting fiber Bragg gratings or fiber couplers. In particular, the optical fiber ring resonator structure using the optical fiber coupler enabled the development of mode- locked fiber lasers. Mode-locked fiber lasers, which generate pulses of high peak power and narrow pulse width, enable the
11
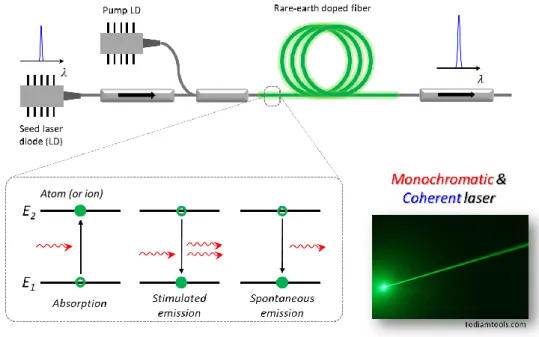
Atom (or ion)
Fig. 1.2.1 Schematic diagram of a fiber amplifier made using rare-earth doped fibers. The incet is from Ref. [27].
exploration of various nonlinear optical phenomena caused by high peak power, and such nonlinear optical phenomena are recently applied in various applications such as optical sensors and bio- medical optics [28]. Moreover, many studies have been conducted to increase the peak power or average power of pulse lasers through engineering of GVD and manipulation of nonlinear effects.
Recently, a novel fiber laser system exploiting Mamyshev resonator with MW level peak power has been demonstrated and attracts great attention in the field of pulsed fiber lasers [29].
Fiber lasers have been developed in various ways to achieve the power, energy, and pulse widths required for engineering applications. However, the wavelength of emitted laser light has been greatly limited by rare-earth ions. For example, even though
12
800 1000 1200 1400 1600 1800 2000 2200 Wavelength, nm
NL conversion
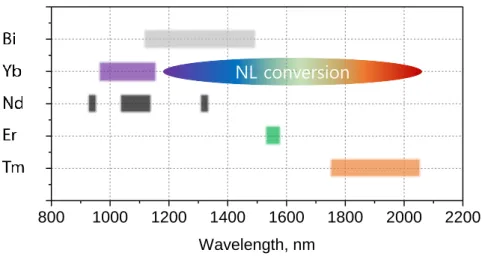
Fig. 1.2.2 Wavelength range of fiber laser according to the type of rare-earth ion
bio-medical applications such as optical coherence tomography require light in the wavelength range of 1200 to 1400 nm [30], rare earth ions have not yet been found that can amplify light at wavelengths in the region. LiDAR technology, which has recently been widely applied in autonomous vehicles and defense applications, requires laser light sources in the eye-safe wavelength band of 1400-1700 nm [31], but Erbium doped fiber amplifiers that amplify light in the wavelength region near 1500 nm have low amplification efficiency and cannot cover all of the wavelength band required for LiDAR applications. Thus, the bandwidth of gain materials currently used in fiber lasers alone cannot satisfy the wavelength requirements of the applications [24].
Although the wavelength of a fiber laser is largely limited by rare- earth ions, nonlinear wavelength conversion phenomena due to the
13
high nonlinearity of the fiber can be used to cover the wavelength range, as shown in Fig. 1.2.2 [1]. Recently, researches for generating a broadband light source covering a wide wavelength band using nonlinear optical phenomena, such as Raman and Brillouin scattering, SPM, and FWM have been actively conducted.
1.3. Nonlinear fiber optics
With the advent of high-power fiber lasers, nonlinear optical phenomena have become more frequent in optical fibers, and nonlinear fiber optics has emerged as the most important part of fiber optics [1].
In any dielectric material, if a sufficiently strong electromagnetic field is launched to the material, the bound electrons of the dielectric medium will exhibit a nonlinear response to the field. The response to the field of bound electrons will appear as dipole moment and total polarization as following [32]:
( ) ( ) ( )
(
1 2 3)
0 :
= + + +
P E EE EEE , (1,3,1)
where ε0 is the vacuum permittivity and χ(n) is the n-th susceptibility. In general, χ(1) is most dominant, and the refractive index is almost determined by χ(1). All higher-order terms after the second order are due to the anharmonic motion of the bound electrons, which contribute to polarization when the field strength is large enough. Among them, the second susceptibility, χ(2), is
14
nearly zero due to the amorphous structure of the optical fiber. The most dominant nonlinear optical phenomenon in optical fibers is due to the third susceptibility, χ(3). Nonlinear optical phenomena caused by χ(3) are called Kerr nonlinearity. Since Kerr nonlinearity is a response function for three fields, intensity-dependent refractive index, third-harmonic generation, and four-wave mixing are representative phenomena of Kerr nonlinear effects. Raman (Brillouin) scattering caused by optical (acoustic) phonons is also considered as the third-order nonlinear effect [1, 32]. Among them, the intensity-dependent refractive index causes the phenomenon of self-phase modulation (SPM) in which the phase is changed by the intensity of the pulse itself, and cross-phase modulation (XPM) in which the phase is changed by the intensity of another pulse [1].
SPM forms an optical soliton by balancing with GVD in the AD domain, and XPM is applied as various technologies such as nonlinear polarization rotation based saturable absorber and nonlinear loop mirror [4].
1.4. Supercontinuum generation
With the development of PCFs with high nonlinearity and engineering dispersion characteristics, nonlinear wavelength conversion studies using PCFs have been actively conducted. In particular, when a sub-picosecond ultrafast pulse with a high peak power of kW is applied to the PCF, the ultrafast pulse expands the
15
Fig. 1.4.1 Scheme of SCG via highly nonlinear PCF (the incet is from Ref. [23])
spectrum to hundreds to thousand nanometers by interplay of dispersion, SPM, FWM, and Raman scattering. Therefore, it is possible to create a broadband spectral light source that can cover whole visible wavelength band if the PCF characteristics and the pump pulse are well controlled [33]. This broadband spectrum is called supercontinuum (SC), and the process of generating SC is called SC generation (SCG).
SC is usually generated by applying a pump pulse in the AD wavelength region to the PCF. When a sub-ps pump pulse which wavelength is in the AD wavelength range, the pump pulse spectrum is expanded by the SPM. Then, the pump pulse is split into multiple solitons and dispersive waves (DWs) by third-order dispersion, Raman scattering, and modulation instability. DWs are phase-matched to the solitons in the ND region, causing the SC spectrum to extend towards the blue frequency. In addition, soliton in the AD region is gradually red-shifted by Raman scattering. This process broadens the SC spectrum from side to side [34]. Besides
16
the SCG pumped in AD region (AD-SCG), a spectrum can also be extensively extended via SPM and FWM in the normal dispersion (ND) region, which is called as ND-SCG. In ND-SCG, the spectrum is also broadened by the interaction of launched dark solitons and DWs in the AD region [35]. In addition, there is one more type of SCG, which is generated via PCF with flattened all-normal dispersion (FAND). The distinguishable feature of SCG in FAND (FAND-SCG) is that the FAND-SCG is only due to coherent spectral broadening processes including SPM and FWM. Thus, coherence property of the FAND-SCG is much better than the two other SCGs [34]. Consequently, SCG is a phenomenon that occurs when the energy spectrum of the pump pulse applied from the input stage is spread to other wavelength regions by nonlinear optical phenomenon.
Reproduced: J. M. Dudley et al., Rev. Modern Phys. 78 (2016)
Soliton fission!
Fig. 1.4.2. SCG via highly nonlinear PCF, which is a reproduced figure in Ref. [12]
17
1.5. Motivation
In virtue of advances in fiber fabrication and fiber laser technology, nonlinear fiber optics could be studied extensively. Also, thanks to the academic achievement of such nonlinear fiber optics, wideband fiber lasers covering a wide wavelength band could be developed in various ways. A broadband fiber laser based on a nonlinear wavelength conversion phenomenon is a light source that is generated when an energy spectrum of a pump pulse applied from an input port spreads to other wavelength regions by a nonlinear optical phenomenon.
The SC light source can be applied to various fields such as optical sensor [30], bio-medical imaging [28], and optical communication [36] in virtue of its ultra-broadband characteristics.
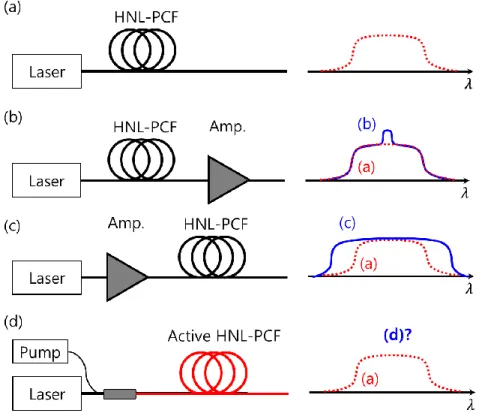
Simultaneously, the SC light source has difficulty in power scaling due to its ultra-broadband characteristics. Even if someone wants to amplify a wide band SC radiation as shown in Fig. 1.5.1, there is no rare-earth ion that can cover the ultra-wide spectrum of several hundred nm. Thus, even if the amplifier is inserted after the HNL-PCF as shown in Fig. 1.5.2 (b), only a portion corresponding
(a) (b)
Optical System
Target output
Fig. 1.5.1. Concpet of the amplification system of brandband SC radiations
18
to the bandwidth of the amplifier will be amplified because the bandwidth of the amplifier is much smaller than the bandwidth of the SC. Thus, in a typical SCG system, the amplify stage is inserted before the nonlinear conversion stage as shown in Fig. 1.5.2 (c).
The energy and peak power of the pump pulses will be much amplified so that the energy of the SC pulses coming out will also be much increased. However, when the peak power of the pump pulse is amplified by the amplifier, the nonlinear phenomenon experienced by the HNL-PCF is also increased, so that the linewidth is significantly increased much more than the average spectral power. Therefore, the combination of the conventional passive HNL-PCF and the fiber amplifier has a limitation in power scaling of SC pulses [37].
To approach this problem, this paper will theoretically examine the nonlinear optical phenomena and SCG in the active type HNL- PCF combined with the fiber amplifier and HNL-PCF (Fig. 1.5.2 (d)). An active-type HNL-PCF is a HNL-PCF doped with rare- earth ions in the core, which can be fully implemented with current advanced fiber fabrication technology. In the previous studies, SCG using Yb-doped fiber (YDF) has been studied similarly to Fig. 1.5.2 (d), but YDF has a low nonlinearity compared to low PCF. [38]. In 2016, L. A. Vazquez-Zuniga et al. fabricated a highly linear fiber amplifier by doping Er ion to soft glass fibers which nonlinearity is sufficiently high. The authors observed that by applying a ps pulse to a high-nonlinearity fiber amplifier, the linewidth was increased
19
Fig. 1.5.2. Concpet of the amplification system of brandband SC radiations: (a) SCG system without any amplifier stages and its output spectrum as a reference, (b) SCG system with an ampflier stage after the HNL-PCF and output spectrum, (c)SCG system with a pre-amplifier stage before the HNL-PCF and its output spectrum, (d) SCG system made of an active HNL-PCF which is an all-in-one system of the HNL-PCF and the fiber amplifier, and the resultant output spectrum
to about 350 nm per unit length [39]. According to the study, when high nonlinearity and optical gain exist simultaneously, nonlinear optical phenomena continue to occur because the optical gain continues to amplify the pump pulse, which is the seed of nonlinear wavelength conversion. Against this background, this study theoretically examines how SCG, which occurs in the presence of high nonlinearity and optical gain, differs from SCG generated only by nonlinearity.
20
As mentioned earlier, nonlinear optical phenomenon that pulses experience under the complex interaction of dispersion and nonlinearity is the heart of the SCG. In particular, the optical soliton and nonlinear optical phenomena experienced by the soliton are the core of the AD-SCG. Thus, SCG in an environment where both optical gain and high nonlinearity exist simultaneously can be regarded as a physical environment where the optical soliton interacts with optical gain, high nonlinearity, and dispersion of optical fiber in a complicated manner. Conventional SCG is a phenomenon that depends on soliton dynamics in closed system with little energy inflow from external system. On the other hand, the SCG considered in this study is a phenomenon that depends on the soliton dynamics in the open system where the energy is continuously injected from the external system. On the other hand, the formation of individual soliton in the open system has been studied a lot. In particular, many studies have been reported on dissipative soliton in which both optical gain, optical loss, and nonlinearity and fiber dispersion are balanced [10]. However, the physics of these solitons interacting complexly in open systems has not been studied. Therefore, this study is not only an engineering study of power scaling of SCG, but also a scientific study of nonlinear optics in open systems.
21
1.6. Scope of the study
In this dissertation, I theoretically explore SCG in active-type HNL-PCFs. In particular, SCG and related soliton dynamics in the AD and FAND regions are examined. Since the soliton from a pulse with a peak power of kW typically has a width of femtosecond, a rigorous model is required to handle the interaction of these ultrafast solitons with rare-earth ions. Chapter 2 first discusses the nonlinear Schrödinger equation (NLSE), an equation that describes the nonlinear optical phenomena of ultrafast pulses. I also derive the Maxwell-Bloch equation for two-, three- and four-level structures, which describe the interaction of ultrafast pulses with rare-earth ions. Chapter 3 discusses the characteristics of SCG and associated bright soliton (BS) dynamics in Yb-doped HNL-PCF with a single ZDW. Next, the impact of BS dynamics on the characteristics of SCG is discussed. Chapter 4 discusses SCG characteristics and associated dark soliton (DS) dynamics in Yb- doped HNL-PCF with FAND characteristics. Next, the influence of dark soliton dynamics on the characteristics of SG is discussed. The final Chapter 5 concludes with a summary of the dissertation.
22
Chapter 2
Numerical model of ultrafast optics in active and nonlinear media
2.1. Numerical model of ultrafast optics
When a sub-picosecond ultrafast pulse is applied to the HNL- PCF, the pulse evolves into an SC pulse under the interaction of Kerr nonlinearity and dispersion, such as SPM, FWM, and Raman scattering [1, 12]. The dynamics of these pulses can be described by the NLSE, as follows:
( ) ( ) ( )
1 2
2
1 , ,
2 !
m m
m
shock m
m
i
A A
i A Z T R T A Z T T dT
Z m T T
−
= −
= − − + + −
(2.1.1) where A, p, and n denote the envelope of the optical field, the transition dipole moment, and the normalized population inversion, respectively; Z and T denote the propagation distance and the time coordinate in the co-moving frame at the envelope group velocity; α,
23
βm, and γ denote the attenuation, the m-th order dispersion, and the nonlinear coefficients; τshock denotes the shock coefficient for self- steepening, which is usually characterized by the inverse of the center angular frequency (i.e., 1/ω0). The nonlinear response function is expressed by R(T) = (1−fR)δ(T) + fRhR(T), which includes SPM and Raman response, where fR is usually given by 0.2 for typical silica fibers. The Raman response function hR(T) is will be given in Section 2.1.3.
In the following section, physical phenomena (e.g. GVD, SPM, and Raman scattering) by each term will be analyzed sequentially.
2.1.1. Group velocity dispersion (GVD) in NLSE
In NLSE, GVD is characterized by β2. If β2 is positive, red light is faster than blue light. if negative, blue light is faster than red light.
To see how these GVD phenomena are described by the NLSE, let's write the equation as follows, except for the terms in the NLSE except for GVD.
2 2
2 2
i
A A
Z T
= − . (2.1.2)
The Fourier transform of this equation gives the following equation.
( )( ) (
2)
2 0 0
1 ,
2
A i A Z
Z
= − −
. (2.1.3)
This differential equation is the ordinary differential equation for Z and the solution is given as:
24
(
, 0) (
0, 0)
exp 2( )(
0)
22
A Z − =A − i − Z (2.1.4) Accordingly, it can be seen that GVD induces a quadratic phase on spectral phase. This soon changes the temporal location of that frequency component, which in turn causes chirping of the pulse in the time domain. To verify this, I apply the Eq. (2.1.4) to the Gaussian pulse to extract the phase term as follows:
( ) ( )
(
2)
2 22 1( )
20
sgn / 1
, tan sgn
2 2
1 /
D D D
Z L T Z
Z T Z L T L
= − + −
+ , (2.1.5)
where T0 is width of Gaussian pulse and LD is the dispersion characteristic length expressed by
2 0
2 D
L T
= . From Eq. (2.1.5), one can see that chirping is caused by GVD. When β2 is positive, up- chirping occurs when the frequency of the leading edge is lower than that of the trailing edge. When β2 is negative, down-chirping occurs when the frequency of the leading edge is higher than the frequency of the trailing edge. Chirping due to GVD causes compression or broadening of the pulse depending on the initial chirping of the pulse. If I denote the initial chirping of the pulse as C, for positive sgn(C β2), the pulse is broadened, and for negative sgn(C β2), the pulse is compressed.
25
2.1.2. Self-phase modulation (SPM) in NLSE
The nonlinear coefficient γ is a characterizing coefficient associated with nonlinear phenomena in NLSE, causing Kerr nonlinear effects such as SPM or intrapulse FWM. To discuss the SPM, this section analyzes the NLSE, including only the SPM term.
A i A A Z
=
(2.1.6)
Looking at Eq. (2.1.6), one can see that the SPM term only changes the phase. In other words, the intensity of the field does not change, and one can obtain the solution of Eq. (2.1.6) as:
(
,) ( )
0, exp(
2)
A Z T =A T i A Z (2.1.7) This means that field at each time undergoes an additional phase shift by instantaneous intensity. This is nonlinear chirping depending on intensity. The chirping is calculated as follows.
( ) ( )
2, d A T
Z T Z
= − dT (2.1.8)
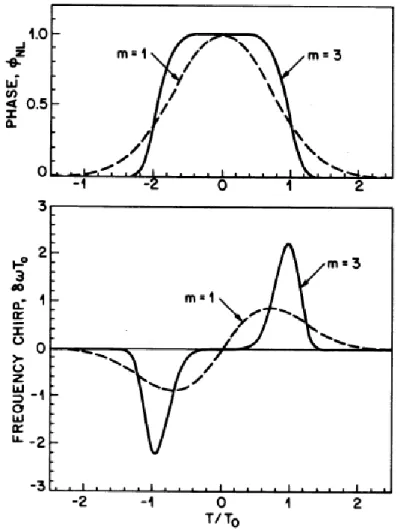
The nonlinear chirping calculated by applying this to Gaussian and super-Gaussian pulse is shown in Fig. 2.1.1. Accordingly, it can be seen that the SPM causes red-shift at the leading edge of the bright pulse and blue-shift at the trailing edge. In other words, the phenomenon of increasing the linewidth of the spectrum by the SPM increases, which is proportional to the nonlinear phase shift. The nonlinear chirping by SPM causes nonlinear dynamics of the pulse with non-zero GVD.
26
Fig. 2.1.1. Temporal variation of SPM-indued phase shift and frequency chirp for Gaussian (dahsed curve) and super-Gaussian (solid curve) pulses in Ref. [1].
2.1.3 Time-delayed response in NLSE
Since optical pulses have a broader spectrum than CW, they suffer from Raman scattering rather than Brillouin scattering [1].
Raman scattering is inelastic scattering by optical phonons, where photons undergoing Raman Stokes scattering loses its energy and become low-frequency Stokes photons [1]. In addition, Stokes light is further amplified by the stimulated process, which is called
27
stimulated Raman scattering (SRS). Photons undergoing Raman anti-Stokes scattering become photons with high frequency, anti- Stokes photons, but generally have a negative gain by a stimulated process. SRS is determined by the response of the optical phonon, which is slower than the response of the electron. Typical silica fibers have a response time of approximately 32 fs [1]. The time- delayed response by Raman scattering is modeled as follows:
( )
12 222(
2) (
1)
1 2
exp / sin /
h TR T T
= + − , (2.1.9)
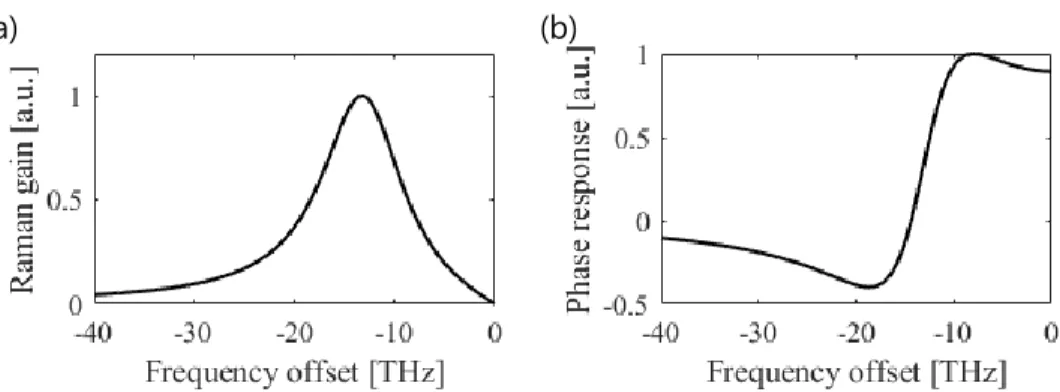
where τ1 is the inverse of the optical phonon frequency and τ2 is the lifetime of the optical phonon. In a typical silica fiber, τ1 has about 12.2 fs and τ2 has about 32 fs. Fourier transform of Eq.
(2.1.9), gives Raman gain spectrum as shown in in Fig. 2.1.2. This Raman response causes Raman-soliton self-frequency shift (RSSFS) and intrapulse Raman scattering (IRS) to be introduced later.
(a) (b)
Fig. 2.1.2. (a) Raman gain spectrum and (b) phase response obtained by Eq. (2.1.9)
28
2.1.4 Bright (dark) soliton formation in AD (ND) regime
Sections 2.1.1 and 2.1.2 review GVD and SPM respectively.
GVD and SPM govern the spectral-temporal dynamics of the pulse, causing linear and nonlinear chirping, respectively. However, there are conditions under which two types of chirping are compensated for each other. In this case, the optical pulse is maintained in its shape and guided without any change in the spectral-temporal domain. This special pulse is called an optical soliton. In particular, the AD region is down-chirped by GVD and at the same time nonlinear up-chirping by SPM. Thus, in the AD domain, GVD and SPM can be balanced to form a soliton. This corresponds to the eigenstate in the eigenvalue problem derived by applying an inverse scattering transform to the NLSE [40, 41]. In this case, the eigenvalue is distributed along the discrete spectrum, and the eigenvalue is represented by N, the soliton number. N is expressed as LD / LNL, where LNL is a nonlinear characteristic length expressed as 1/γP0 . The soliton corresponding to N = 1 is called fundamental soliton [1, 41]. In particular, when CW is applied in the AD region, fluctuation occurs in CW due to modulation instability, and soliton occurs spontaneously from the fluctuation. Therefore, a large number of optical solitons spontaneously occur in SCG in the AD region. Since the soliton in the AD region is a bright pulse on the zero-intensity background, it is also called bright soliton (BS).
On the other hand, for the bright pulse of the ND region, the
29
linear and nonlinear chirping cannot be balanced. This is because both chirping by ND and chirping by SPM are positive chirping.
Thus, bright pulses in the ND region generally undergo endless broadening. However, assuming CW boundary conditions in the NLSE, one can obtain stable soliton solutions even in the ND region, which is called dark soliton (DS). The DS is a dark pulse on a light background and corresponds to an eigenstate with a continuous spectrum in the IST eigenvalue problem. Figure 2.1.3 compares the typical characteristics of BS and DS. BS is symmetric without chirping, while DS is anti-symmetric with phase shift in the middle of dip [42].
(a)
(c)
(e)
(b)
(d)
(f)
B= 1.0
B= 0.8
B= 0.5
sin-1B
Fig. 2.1.3. Three dimensional visualization of propagation of (a) BS and (b) DS. Intensity profile of (c) BS and (d) DS. Phase profile of (e) BS and (d) DS. From this figure, one can find that BS is symmetric, whereas DS is anti-symmetric.
30
2.2. Semiclassical model of light-matter interaction
2.2.1. Overview of Maxwell-Bloch equation (MBE)
In classical physics, a state of a physical system is determined in a definite way [43]. For example, if there are two states A and B which the system can stay, then the system definitely belongs to either state A or B. However, in quantum mechanics, quantum system can belong to superposition of two states (i.e.
i
a b
c a c e b
= + , where ca and cb are real) [43]. According to Copenhagen interpretation, by measurement process, the system wave function collapses to either a or b with a probability of ca2 and cb2
(
= −1 ca2)
, respectively. The important thing is that the system inherently has the possibility of two states in form of superposition of two wave functions. This is the most distinguishable feature from classical physics where the system should have either A or B state and the determined state is not determined at the moment of measurement [43].Fig. 2.2.1. (a) State diagram of two states in classical physics, (b) State diagram of two states in quantum physics called as Bloch vector representation
31
Thus, the superposition is the most important and fundamental feature of quantum systems [43, 44]. Sometimes, we call the property of superposition of states as quantum coherence.
Coherence means a fixed relationship between the phase of waves.
Two waves are coherent when the phase difference is constant. If they are not coherent if there is a random or changing relationship.
In other words, coherence means a property of wave which can interfered by other waves having the same frequency with a fixed phase relationship. In quantum mechanics, quantum coherence manifests itself in the form of an interference effect of two wave functions. For example, the observation probability distribution of a particle of the quantum state on x-axis is described by
( )
2 2
ˆ a ˆ b ˆ a b i ˆ c.c
x c a x a c b x b c c e b x a
= + + − + [44]. In the point of
view of wave theory, the first two terms correspond to intensities of each beam and the last two terms correspond to interference pattern. What if the last two terms disappear due to some decoherence effects? Then, the probability is nothing but probability of classical system which will belong to either state A or B. The system is nothing but classical system not having quantum properties. This is why we call the property of preservation of superposition state as quantum coherence.
Then, what happens if quantum coherence is considered in light-atom interaction? If we abandon the quantum coherence of atoms in light-atom interaction still holding the concept of quantization of states, the system behavior is the same with what
32
Einstein had considered in his remarkable paper, ‘On the quantum theory of radiation (1917)’ [45]. He had described the interaction of light and quantized atoms via the well-known rate equations.
However, if we consider the quantum coherence for further steps, response of the system is largely different against the rate equations. This will be shown in this report.
The superposition of two states has been described as Bloch vector in an efficient way. If a system has a chance to choose a state A or B, then in classical physics, we can just draw two boxes for two states. However, in quantum system, two boxes are not enough for description of the state because the system is the superposition of two states with a fixed phase relationship. Thus, Bloch had developed a Bloch vector expression which can represent the superposed quantum states on a sphere, which is an homage to Poincare sphere for representation of polarization of optical waves [46]. Even though light waves can be described by field quantization, the mean photon number of light waves is extremely large, Maxwell equations are nice equations to describe propagation of light waves. Thus, the interaction of light waves of many photons and atoms can be described by coupled Maxwell equations and Schrödinger equations. We call the coupled equation set as Maxwell-Bloch equations [44]. Then, how can we couple the macroscopic Maxwell equation and the microscopic Schrödinger equation? The key point is making microscopic things macroscopic through statistical summation [44]. One can obtain the microscopic
33
transition dipole moment by solving the Schrödinger equation. Then, we do the statistical summation of the microscopic transition dipole moment and obtain the macroscopic polarization as a result. The macroscopic polarization drives the electric field and the electric field again change the microscopic transition dipole moment through coherent light-atom interaction. The Maxwell-Bloch equations are self-consistent in this way.
Fig. 2.2.2. Electric field induces microscopic dipole moment according to the laws of quantum mechanics. These moments are then summed to yield the macroscopic polarization of the medium, which acts as a source in Maxwell’s equations. The condition of self-consistency then requires that the assume field equal to the reaction field.
2.2.2. MBE for a two-level system
Under the slowly varying envelope approximation (SVEA) and adopting co-moving frame (Z, T), Maxwell-Bloch equation is simply described as following [44]:
(
0)
Q exp
A i P ik z Z
= −
(Macroscopic), (2.2.1)
2
2
1
a
p i
i p En
T T
= − − −
(Microscopic), (2.2.2)
( ) (
* *)
1
1 2
1 i Ep E p
n n
T T
= − + + −
(Microscopic), (2.2.3)
34
Microscopic equations are coupled to the macroscopic Maxwell equation via P=N p0 , which means the transition dipole moment p represents behavior of atomic ensemble at (Z, T). In Eq. (2.2.1)- (2.2.3), p represents the complex phasor form of the transition dipole moment, where the time-harmonic term is factored out.
More specifically, the transition dipole moment is represented by
0 * 0
e i t i t
p=p − +p e and p=21+12 . Another quadrature is expressed as q=i21−i12.
The concept of the saturation energy is automatically given in the rate equation approximation. The rate equation approximation approximates Maxwell-Bloch equation assuming the fast decay of the coherent interaction which is represented by Eq. (A.1.8) (See Appendix A for details of the rate equation approximation and
![Fig. 1.1.1. Attenuation spectrum of typical silica fibers (Ref. [13])](https://thumb-ap.123doks.com/thumbv2/123dokinfo/11653274.0/22.808.182.627.107.446/fig-attenuation-spectrum-typical-silica-fibers-ref-13.webp)
![Fig. 1.1.2. Transverse mode profiles that multi-mode fibers can support (Ref. [15])](https://thumb-ap.123doks.com/thumbv2/123dokinfo/11653274.0/23.808.210.591.162.916/fig-transverse-mode-profiles-that-multi-fibers-support.webp)
![Fig. 1.1.4 (a) SEM micrographs of a PCF in Ref. [22, 23], (b) Graphics of a PCF with a index profile in Ref](https://thumb-ap.123doks.com/thumbv2/123dokinfo/11653274.0/28.808.171.643.113.651/fig-sem-micrographs-pcf-ref-graphics-index-profile.webp)
![Fig. 1.4.1 Scheme of SCG via highly nonlinear PCF (the incet is from Ref. [23])](https://thumb-ap.123doks.com/thumbv2/123dokinfo/11653274.0/34.808.145.667.101.329/fig-scheme-scg-highly-nonlinear-pcf-incet-ref.webp)
![Fig. 1.4.2. SCG via highly nonlinear PCF, which is a reproduced figure in Ref. [12]](https://thumb-ap.123doks.com/thumbv2/123dokinfo/11653274.0/35.808.186.601.620.957/fig-scg-highly-nonlinear-pcf-reproduced-figure-ref.webp)