저작자표시-비영리-변경금지 2.0 대한민국 이용자는 아래의 조건을 따르는 경우에 한하여 자유롭게
l 이 저작물을 복제, 배포, 전송, 전시, 공연 및 방송할 수 있습니다. 다음과 같은 조건을 따라야 합니다:
l 귀하는, 이 저작물의 재이용이나 배포의 경우, 이 저작물에 적용된 이용허락조건 을 명확하게 나타내어야 합니다.
l 저작권자로부터 별도의 허가를 받으면 이러한 조건들은 적용되지 않습니다.
저작권법에 따른 이용자의 권리는 위의 내용에 의하여 영향을 받지 않습니다. 이것은 이용허락규약(Legal Code)을 이해하기 쉽게 요약한 것입니다.
Disclaimer
저작자표시. 귀하는 원저작자를 표시하여야 합니다.
비영리. 귀하는 이 저작물을 영리 목적으로 이용할 수 없습니다.
변경금지. 귀하는 이 저작물을 개작, 변형 또는 가공할 수 없습니다.
수의학석사학위논문
개의 복강 전산화단층촬영에서 조영제 양을 줄이기 위한
Saline Chaser 의 유용성
Usefulness of Saline Chaser to Reduce the Dose of Contrast Material
for Abdominal CT in Normal Dogs
2017 년 2 월
서울대학교 대학원
수의학과 임상수의학(수의영상의학)전공
김 혜 진
I
Abstract
Usefulness of Saline Chaser to Reduce the Dose of Contrast Material
for Abdominal CT in Normal Dogs
Hyejin Kim Veterinary Clinical Sciences (Diagnostic Imaging) Department of Veterinary Medicine The Graduate School Seoul National University
Saline chaser has been reported to allow a significant reduction of contrast material dose and artifacts during computed tomography (CT) examination in human medicine. However, relatively few reports have been reported in dogs. This study assess the extent of dose reduction in intravascularly injected contrast material with the use of a saline chaser in abdominal CT without decreasing the vascular and hepatic parenchymal enhancement in clinically
II
normal dogs. Five beagle dogs underwent abdominal CT scans. Three injection protocols were applied: iohexol injection (600 mg I/kg) without saline chaser (protocol 1), 30% lower dose (420 mg I/kg) of the same iohexol injection followed by 10 ml saline solution (protocol 2), and 40% lower dose (360 mg I/kg) of the contrast material followed by 10 ml saline solution (protocol 3). A dynamic CT scan at the level of the porta hepatis was conducted for 40 seconds. Each dog underwent the 3 protocols twice (total 6 scans). Attenuation values were obtained from the aorta, portal vein, and liver parenchyma. The maximum enhancement values (MEV) in protocol 2 were significantly higher than those in protocols 1 and 3 in the aorta; no significant difference was seen in the portal vein in all protocols. The MEVs recorded from the liver parenchyma in protocols 1 and 2 were significantly higher than those obtained in protocol 3. In this study, the application of saline chaser with a reduced dose of contrast material did not affect vessel enhancement.
In conclusion, the use of a saline chaser for abdominal CT is recommended because it allows 30% reduction in the dose of contrast material without a significant decrease in the vascular and hepatic parenchymal enhancement.
Keywords : computed tomography (CT), saline chaser, contrast material, abdomen, dog
Student Number : 2015-21831
III
Table of Contents
Introduction ... 1
Materials and Methods ... 3
1. Animals ... 3
2. Contrast Material Injection and CT Scan Protocol ... 4
3. Analysis of CT data ... 6
4. Statistical Analysis ... 8
Results ... 9
1. Attenuation of the Aorta ... 9
2. Attenuation of the Portal Vein ... 11
3. Attenuation of the Liver Parenchyma ... 13
Discussion ... 16
References ... 20
Abstract in Korean ... 25
1
Introduction
The advancements in multiple detector computed tomography (MDCT) and the development of nonionic contrast material have had an important influence on computed tomography (CT) imaging. The use of MDCT has significantly reduced the scanning time involved in the procedure. Nonionic contrast material is the optimized choice in CT scanning but its high cost and disadvantages for patients with renal insufficiency forces clinicians and radiologists to investigate alternative methods that will reduce the dose of contrast material used (Goldenberg et al., 2005; Kirberger et al., 2012; Schoellnast et al., 2003;
Schoellnast et al., 2004).
Saline chaser, a technique that involves immediate flushing out of the contrast material using a saline solution after its administration is complete, is commonly used in CT applications, particularly in CT angiography (CTA) in human medicine. It pushes the bolus further into the blood circulation, decreasing the amount of contrast material in those anatomic locations where it is not required.
Therefore, the accumulation of the contrast material in the peripheral vein and injection tubing, which can occur with the advancement of MDCT and reduced scanning time in CT imaging, was prevented by applying this technique (Marin et al., 2011; Tatsugami et al., 2007; Tatsugami et al., 2006). Studies conducted on the topic report that reducing the amount of contrast material does not
2
decrease vascular enhancement. Therefore, the use of saline chaser in CT examination can be a cost-effective option with a decreased risk of contrast material related side-effects (Dorio et al., 2003; Hopper et al., 1997; Orlandini et al., 2006).
However, while there have been numerous reports on saline chaser protocol in human medicine, few studies exist so far on the use of saline chaser in small animals. In particular, studies focused on reducing the dose of contrast material have not been conducted in dogs.
The purpose of this study is to assess the extent to which a saline chaser could reduce the dose of intravascularly injected contrast material in abdominal CT without decreasing the vascular and hepatic parenchymal enhancement.
3
Materials and Methods
1. Animals
The study subjects consisted of 5 adult beagle dogs weighing 12.6-16.3 kg (mean weight: 14.2 kg), showing no abnormal signs related to the cardiovascular system. All dogs have no abnormal findings in blood analysis, abdominal sonography and echocardiography. Details of the anesthesia used during CT scanning are as follows: sedated with an intravenous injection of 0.020 mg/kg body weight acepromazine (Sedaject; Samu Median, Seoul, Korea), induced with an intravenous injection of 1.0-1.5 mg/kg of body weight of etomidate (Etomidate-Lipuro; B. Braun Melsungen AG, Melsungen, Germany) and maintained with isoflurane (Ifran; Hana Pharm, Seoul, Korea) in 100%
oxygen administered via an endotracheal tube. For individual scans, breath- hold protocol with a peak inspiratory pressure of 10 cm H2O was employed during image acquisition to prevent the artifact from respiratory motion.
Electrocardiography (ECG), oxygen saturation, and breathing were monitored for all procedures. The animal care and experimental procedures were approved by the Seoul National University Institutional Animal Care and Use Committees (SNU-160812-1).
4
2. Contrast Material Injection and CT Scan Protocol
The contrast material used in this study was iohexol (Omnipaque 300; GE healthcare, Cork, Ireland) with an iodine concentration of 300 mg I/ml. Three injection protocols were used; 600 mg I/kg contrast material injection at a rate of 3 m/s without saline chaser (protocol 1), 420 mg I/kg contrast material (30%
dose reduction) at the same rate as protocol 1 followed by 10 ml of saline chaser (protocol 2), and 360 mg I/kg contrast material (40% reduction) at the same rate followed by a saline chaser at the same volume of protocol 2 (protocol 3).
In protocols 2 and 3, saline chaser was injected at a rate of 6 m/s. The contrast material and saline chaser were injected through a 22-gauge IV catheter into the cephalic vein. Two long tubes of the injectors were connected with a non-return valve and a Y-shaped tube leading to the IV catheter. A dual-head power injector (Stellant; MedRAD, Pittsburgh, USA) was used. Scanning was typically started 10 seconds after the initiation of the contrast material injection to achieve an adequate enhancement in the arteries and veins.
The studies were repeated 6 times, for the 3 protocols being applied twice for each dog. A minimum 3-day interval was included between CT scanning sessions in each dog.
The study involved 30 dynamic CT scanning sessions using a 64-row MDCT scanner (Aquillion 64; Toshiba, Tochigi, Japan) at a fixed level of the porta hepatis for 40 seconds. The scanning parameters included 4 × 1.0 mm
5
detector collimation, 4.0 mm slice thickness, 120 kVp, 50 mAs and 0.75 seconds rotation time.
6
3. Analysis of CT data
The CT images were reconstructed for analysis using image analysis software (INFINITT; Infinitt Healthcare Co. Ltd, Seoul, Korea). The circular regions of interest (ROIs) were placed at the level of the aorta, portal vein, and liver parenchyma with areas ranging from 15 to 30 mm2. Vessels and artifacts were carefully excluded from the measurements. In the liver parenchyma, ROIs were measured in three distinct areas including both the left and right lobes, and their average was calculated as the results. Attenuation values were measured at soft tissue windows (window width +400, window level +40) in Hounsfield units (HU) using two parameters: the maximum enhancement value (MEV) and the time to maximum enhancement value (tMEV); time-intensity curves were obtained from the attenuation values recorded in each ROI.
7
Figure 1. The circular regions of interest (ROIs) are placed at the level of the aorta (arrow), portal vein (arrow head), and liver parenchyma (dotted lines). In the liver, ROIs are measured in three distinct areas, including the left and right lobes, and their average is recorded as results.
8
4. Statistical analysis
Statistical analyses were carried out using statistical software program (SPSS, version 23.0 for Windows; SPSS, Chicago, IL, USA). In each dog, the difference between the attenuation values obtained in the first and the second scans were analyzed using the Wilcoxon signed-rank test. Further, Kruskal-Wallis test and Mann-Whitney U test were used to compare attenuation parameters of MEV and tMEV obtained from the aorta, portal vein, and liver parenchyma. A p- value of 0.05 was considered to be statistically significant.
9
Results
1. Attenuation of the Aorta
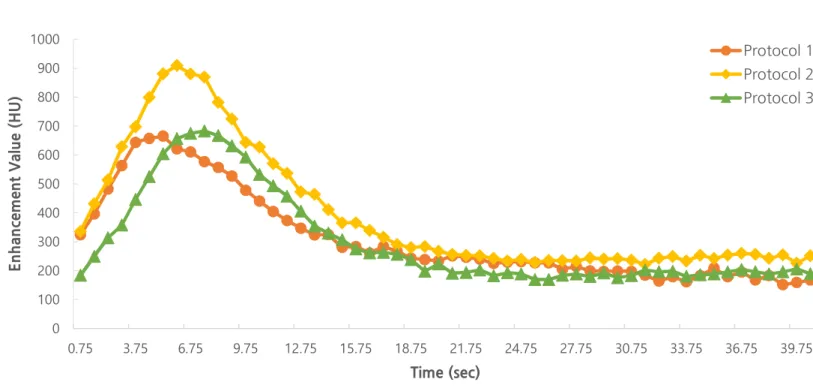
There was no significant difference in the attenuation values obtained from the aorta between the first and the second scans in each dog. The maximum enhancement values (MEV) recorded using protocol 2 were significantly higher than those noted through protocols 1 and 3 (p<0.05); no significant difference was found between the protocols 1 and 3 (Figure 2, Table 1). Further, time to maximum enhancement value (tMEV) was not significantly different among the protocols (Table 2).
10
Figure 2. Mean time-intensity curves for the aorta. The MEVs recorded for protocol 2 are significantly higher than those noted for protocols 1 and 3 (p<0.05). There is no significant difference between protocols 1 and 3.
0 100 200 300 400 500 600 700 800 900 1000
0.75 3.75 6.75 9.75 12.75 15.75 18.75 21.75 24.75 27.75 30.75 33.75 36.75 39.75
EnhancementValue(HU)
Time (sec)
Protocol 1 Protocol 2 Protocol 3
11
2. Attenuation of the Portal Vein
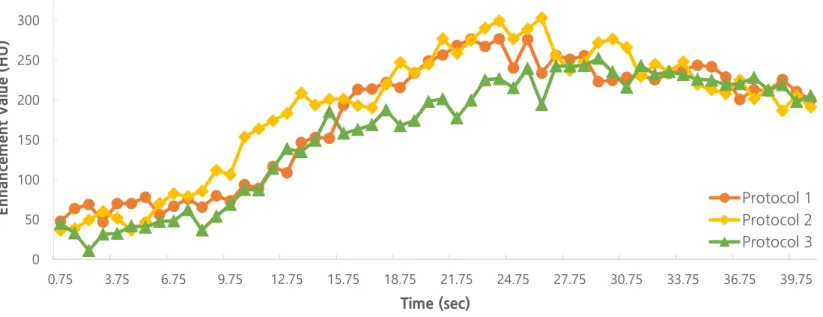
There was no significant difference in the attenuation values obtained from the portal vein between the first and the second scans in each dog. Further, there was no significant difference in the MEVs of the portal vein among the protocols (Figure 3, Table 1). The tMEV values were not significantly different among the protocols (Table 2).
12
Figure 3. Mean time-intensity curves for the portal vein. There is no significant difference in the MEVs among the three protocols.
0 50 100 150 200 250 300
0.75 3.75 6.75 9.75 12.75 15.75 18.75 21.75 24.75 27.75 30.75 33.75 36.75 39.75
EnhancementValue(HU)
Time (sec)
Protocol 1 Protocol 2 Protocol 3
13
3. Attenuation of the Liver Parenchyma
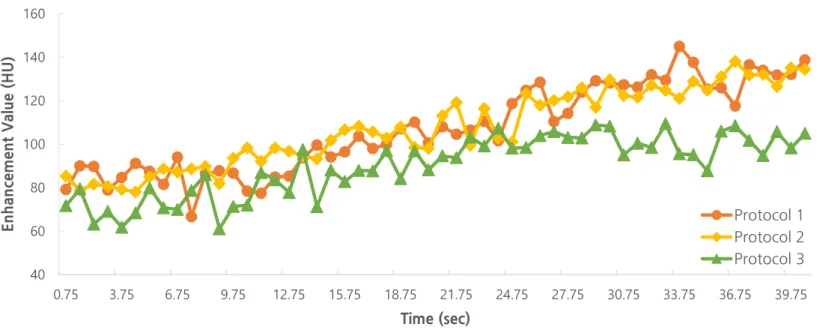
There was no significant difference in the attenuation values obtained from the liver parenchyma between the first and the second scans in each dog. The MEVs obtained from protocol 3 were significantly lower than those from protocols 1 and 2; there was no significant difference between the protocols 1 and 2 (p<0.05) (Figure 4, Table 1). Further, tMEV was not significantly different among the three protocols (Table 2).
14
Figure 4. Mean time-intensity curves obtained for the liver parenchyma. The MEVs recorded for protocol 3 are significantly lower than those noted for protocols 1 and 3 (p<0.05). There is no significant difference between protocols 1 and 2.
40 60 80 100 120 140 160
0.75 3.75 6.75 9.75 12.75 15.75 18.75 21.75 24.75 27.75 30.75 33.75 36.75 39.75
EnhancementValue(HU)
Time (sec)
Protocol 1 Protocol 2 Protocol 3
15
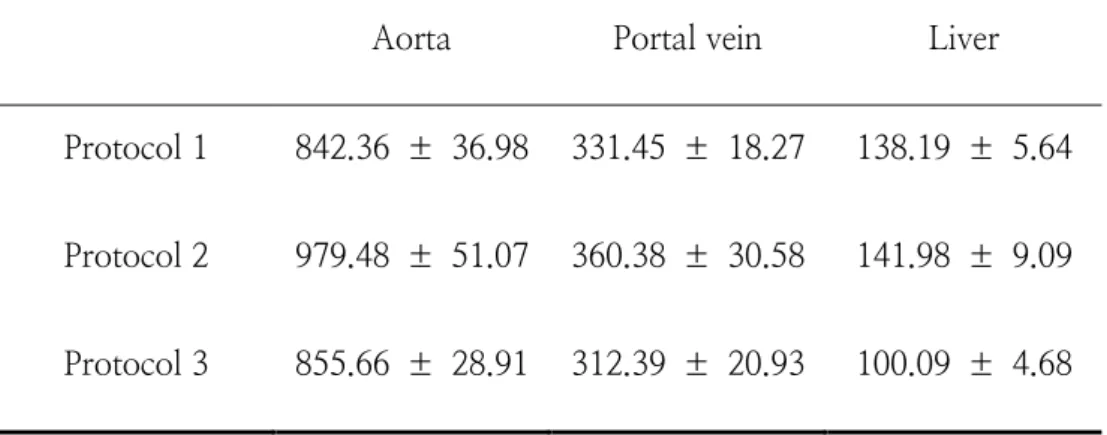
Table 1. Mean maximum enhancement values (MEV) according to protocols at each region of interest (ROI) in five beagle dogs
(Unit: HU)
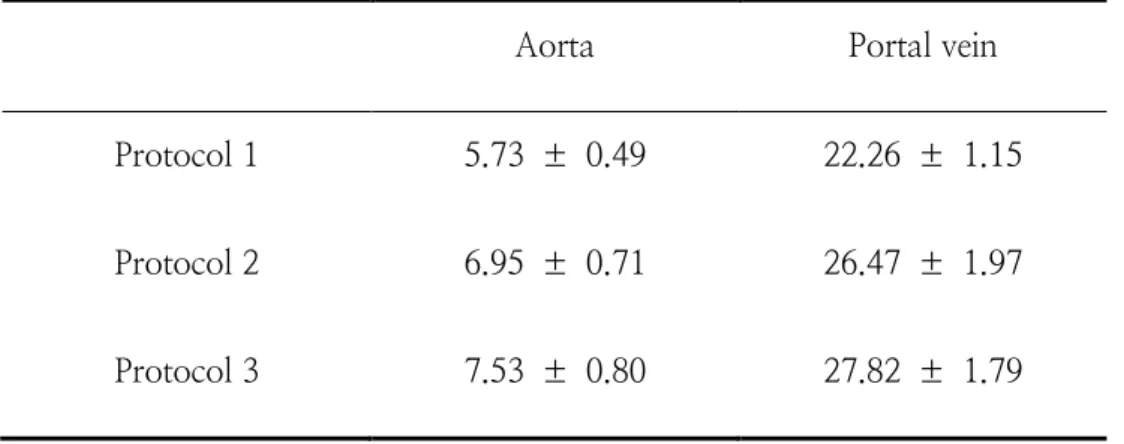
Table 2. Mean time to maximum enhancement value (tMEV) according to protocols at the aorta and portal vein in five beagle dogs
Aorta Portal vein
Protocol 1 5.73 ± 0.49 22.26 ± 1.15
Protocol 2 6.95 ± 0.71 26.47 ± 1.97
Protocol 3 7.53 ± 0.80 27.82 ± 1.79
(Unit: seconds)
Aorta Portal vein Liver
Protocol 1 842.36 ± 36.98 331.45 ± 18.27 138.19 ± 5.64 Protocol 2 979.48 ± 51.07 360.38 ± 30.58 141.98 ± 9.09 Protocol 3 855.66 ± 28.91 312.39 ± 20.93 100.09 ± 4.68
16
Discussion
Various effects of the saline chaser technique have been reported since its introduction in medical imaging. This method increases the peak attenuation and reduces the artifacts produced by contrast materials (Hopper et al., 1997;
Lee et al., 2007; Lee, Kishimoto, et al., 2010; Marin et al., 2011; Schindera et al., 2008; Schoellnast et al., 2004; Yoon et al., 2006) and the amount of the contrast material used in the imaging procedures (Dorio et al., 2003; Haage et al., 2000; Schoellnast et al., 2003; Tatsugami et al., 2007; Tatsugami et al., 2006).
A human medicine-based research using a canine experimental model conducted experiments by modifying various protocols involved in saline chaser.
According to the report, peak enhancement increased upon increasing the flow rate and the volume with no significant difference observed with the use of different chaser fluids (Behrendt et al., 2011). Based on these results, it was estimated that the dose required for appropriate contrast enhancement can be reduced by the saline chaser. For the purpose of the practical clinical application, the focus was maintained on reducing the dose of the contrast material used in abdominal CT. Previous studies have shown a possibility of reduction of 15%
to 40% reduction in the dose of contrast material when saline chaser was used in helical CT of the thorax and the abdomen in humans (Haage et al., 2000;
Hopper et al., 1997; Schoellnast et al., 2003; Tatsugami et al., 2007). A
17
veterinary study suggests that the saline chaser allows a 30% reduction in the dose of the contrast material used without significantly decreasing the vascular enhancement during CT examination of the heads of cattle (Lee, Ikeo, et al., 2010). Since there are no studies focused on reducing the contrast material dose in dogs so far, based on preliminary experimental results, the comparison was drawn between the enhancement values obtained after reducing the contrast material dose by 30% and 40% and applying saline chaser. Further, there was no significant difference noted in the enhancement values with the use of different chaser fluids in the previous research, the most commonly used fluid, 0.9% sterile normal saline, was applied as the fluid type.
In this study, there was no significant difference in maximum enhancement values (MEV) between protocols 1 and 3 in the aorta. In fact, protocol 2 with 30% reduction in the applied contrast material and saline chaser showed significantly higher MEVs in the aorta than those noted through other protocols.
This result is due to the “pushing effect” of the saline chaser pushed the remaining contrast material into the peripheral veins and the injection tubing into the heart (Cademartiri et al., 2004; Dorio et al., 2003; Hopper et al., 1997;
Lee et al., 2011; Lee, Kishimoto, et al., 2010; Orlandini et al., 2006). There was no significant difference among the protocols in the MEV values recorded for the portal vein. This implies that there was no significant difference in contrast enhancement by decreasing the amount of contrast material in the major vessels by 40%.
18
However, in the liver parenchyma, the HU values recorded during protocol 3 with 40% reduction in the contrast material dose in the saline chaser technique were significantly lower than those recorded with other two protocols. This is because the visualization of the parenchymal organ is likely to have occurred after that of the blood vessels, implying limitations in assessing liver parenchyma when reducing contrast material dose by 40% as compare with that used in conventional contrast material protocol without a chaser. The liver parenchymal enhancement results indicate that the saline chaser allows a 30% reduction in the dose of contrast material without decreasing the vascular and hepatic parenchymal enhancement.
Similar to the results of previous studies, pushing the contrast material with a saline fluid would cause an effect that is similar to increasing the amount of contrast material. As a result, saline chaser increases peak attenuation and results in a significant delay in the time to maximum enhancement value (tMEV) (Bae, 2010; Lee et al., 2007; Lee, Kishimoto, et al., 2010; Marin et al., 2011;
Rajagopalan, 2007; Schoepf, 2005). In this study, the peak time displayed a pattern of slight increase after the application of the saline chaser. However, there was no statistical difference in tMEV for the aorta and portal vein among the protocols. This result may due to the differences in the total dose of the contrast material used in each study, as opposed to previous studies that injected the same dose of contrast material (Lee, Ikeo, et al., 2010).
19
There are several limitations in this study. This study included relatively fewer numbers of animals and failed to monitor blood pressure in them. Further, since the breath-hold protocol was used to prevent motion artifacts, each dynamic scan was performed for 40 seconds; as a result, the peak time for the hepatic parenchyma could not be evaluated. Also, since each scan was performed at a fixed level, the assessment of the complete liver parenchyma and other parenchymal organs was not possible. Furthermore, the evaluation of the technique in other organs and its application in the clinical patients with decreased renal functions would be relevant for the increased understanding of the topic. In addition, determining the effect of a saline chaser on tumor conspicuity and attenuation would be required.
In conclusion, the saline chaser technique allows a 30% reduction in the dose of the contrast material used in abdominal computed tomography without significantly decreasing the vascular and hepatic parenchymal enhancement.
20
References
Bae, K. T. (2010). Intravenous contrast medium administration and scan timing at CT: considerations and approaches. Radiology, 256(1), 32-61.
Behrendt, F. F., Jost, G., Pietsch, H., Keil, S., Mottaghy, F. M., Gunther, R. W.,
& Mahnken, A. H. (2011). Computed tomography angiography: the effect of different chaser flow rates, volumes, and fluids on contrast enhancement. Invest Radiol, 46(4), 271-276.
Cademartiri, F., Mollet, N., van der Lugt, A., Nieman, K., Pattynama, P. M., de Feyter, P. J., & Krestin, G. P. (2004). Non-invasive 16-row multislice CT coronary angiography: usefulness of saline chaser. Eur Radiol, 14(2), 178-183.
Dorio, P. J., Lee, F. T., Jr., Henseler, K. P., Pilot, M., Pozniak, M. A., Winter, T.
C., 3rd, & Shock, S. A. (2003). Using a saline chaser to decrease contrast media in abdominal CT. AJR Am J Roentgenol, 180(4), 929-934.
Goldenberg, I., & Matetzky, S. (2005). Nephropathy induced by contrast media:
pathogenesis, risk factors and preventive strategies. Cmaj, 172(11), 1461-1471.
Haage, P., Schmitz-Rode, T., Hubner, D., Piroth, W., & Gunther, R. W. (2000).
Reduction of contrast material dose and artifacts by a saline flush using a double
21
power injector in helical CT of the thorax. AJR Am J Roentgenol, 174(4), 1049- 1053.
Hopper, K. D., Mosher, T. J., Kasales, C. J., TenHave, T. R., Tully, D. A., &
Weaver, J. S. (1997). Thoracic spiral CT: delivery of contrast material pushed with injectable saline solution in a power injector. Radiology, 205(1), 269-271.
Kirberger, R. M., Cassel, N., Carstens, A., & Goddard, A. (2012). The effects of repeated intravenous iohexol administration on renal function in healthy beagles--a preliminary report. Acta Vet Scand, 54, 47.
Lee, C. H., Goo, J. M., Bae, K. T., Lee, H. J., Kim, K. G., Chun, E. J., Park, C.
M., & Im, J. G. (2007). CTA contrast enhancement of the aorta and pulmonary artery: the effect of saline chase injected at two different rates in a canine experimental model. Invest Radiol, 42(7), 486-490.
Lee, K., Ikeo, S., Iwasaki, T., & Yamada, K. (2011). Comparison of varying injection rates of saline chasers on intravascular contrast enhancement for dynamic CT in cattle. Vet Rec, 168(12), 327.
Lee, K., Ikeo, S., Kishimoto, M., Shimizu, J., Iwasaki, T., Miyake, Y., & Yamada, K. (2010). Use of a saline chaser to reduce the dose of contrast material for dynamic CT in cattle. Vet Rec, 167(5), 170-172.
22
Lee, K., Kishimoto, M., Shimizu, J., Iwasaki, T., Miyake, Y., & Yamada, K.
(2010). Effect of a saline chaser for contrast enhancement of computed tomographic angiography in cattle. Vet Rec, 166(5), 137-139.
Marin, D., Nelson, R. C., Guerrisi, A., Barnhart, H., Schindera, S. T., Passariello, R., & Catalano, C. (2011). 64-section multidetector CT of the upper abdomen:
optimization of a saline chaser injection protocol for improved vascular and parenchymal contrast enhancement. Eur Radiol, 21(9), 1938-1947.
Orlandini, F., Boini, S., Iochum-Duchamps, S., Batch, T., Zhu, X., & Blum, A.
(2006). Assessment of the use of a saline chaser to reduce the volume of contrast medium in abdominal CT. AJR Am J Roentgenol, 187(2), 511-515.
Rajagopalan, Sanjay. (2007). X-ray contrast agents and contrast timing considerations CT and MR Angiography of the Peripheral Circulation (pp. 53- 61): CRC Press.
Schindera, S. T., Nelson, R. C., Howle, L., Nichols, E., DeLong, D. M., &
Merkle, E. M. (2008). Effect of varying injection rates of a saline chaser on aortic enhancement in CT angiography: phantom study. Eur Radiol, 18(8), 1683- 1689.
Schoellnast, H., Tillich, M., Deutschmann, H. A., Deutschmann, M. J., Fritz, G.
A., Stessel, U., Schaffler, G. J., & Uggowitzer, M. M. (2003). Abdominal
23
multidetector row computed tomography: reduction of cost and contrast material dose using saline flush. J Comput Assist Tomogr, 27(6), 847-853.
Schoellnast, H., Tillich, M., Deutschmann, H. A., Stessel, U., Deutschmann, M.
J., Schaffler, G. J., Schoellnast, R., & Uggowitzer, M. M. (2004). Improvement of parenchymal and vascular enhancement using saline flush and power injection for multiple-detector-row abdominal CT. Eur Radiol, 14(4), 659-664.
Schoepf, U. J. (2005). Contrast Material Injection Techniques for CT Angiography of the Coronary Arteries CT of the heart : principles and applications (pp. 237-245). Totowa, N.J.: Humana Press.
Tatsugami, F., Matsuki, M., Inada, Y., Nakai, G., Tanikake, M., Yoshikawa, S.,
& Narabayashi, I. (2007). Usefulness of saline pushing in reduction of contrast material dose in abdominal CT: evaluation of time-density curve for the aorta, portal vein and liver. Br J Radiol, 80(952), 231-234.
Tatsugami, F., Matsuki, M., Kani, H., Tanikake, M., Miyao, M., Yoshikawa, S.,
& Narabayashi, I. (2006). Effect of saline pushing after contrast material injection in abdominal multidetector computed tomography with the use of different iodine concentrations. Acta Radiol, 47(2), 192-197.
Yoon, D. Y., You, S. Y., Choi, C. S., Chang, S. K., Yun, E. J., Seo, Y. L., Park, S. J., Lee, Y. J., Moon, J. H., Rho, Y. S., & Kim, J. H. (2006). Multi-detector
24
row CT of the head and neck: comparison of different volumes of contrast material with and without a saline chaser. Neuroradiology, 48(12), 935-942.
25
국문초록
Saline chaser protocol 은 혈관 내 조영제 주입 후 바로 saline 을 주입하는 방법으로, 인의에서는 이를 이용한 연구가 오랫동안 진행되어 왔으며 saline chaser 를 이용하여 조영제 용량을 줄일 수 있다고 보고되어 있다. 따라서 이 연구에서는 정상 개의 복강 CT 촬영에서 조영제 용량을 줄이는데 있어서 saline chaser 의 유용성에 대해 평가하고자 하였다.
5 마리의 건강한 개를 이용하여 전신마취 하에 간문 (porta hepatis) 수준에서 dynamic CT 촬영을 진행하였다. 총 3 가지의 조영제 주입 프로토콜이 적용되었으며, 프로토콜 1 의 경우 기존 조영 방식으로 600 mg iodine/kg 를 주입하였으며 프로토콜 2 의 경우는 조영제 양을 30% 줄인 420 mg iodine/kg 를 주입하고 바로 이어서 saline chaser 10 ml 을 주입하였다.
프로토콜 3 의 경우 조영제 양을 40% 줄인 360 mg iodine/kg 의 조영제와 saline chaser 10 ml 을 주입하였다. 대동맥, 간문맥 그리고 간 실질에서 attenuation parameter 를 얻었으며, time-intensity curve 를 구성하였다.
대동맥에서는 프로토콜 2 가 프로토콜 1 과 3 에 비해 유의적으로 더 높은 maximum enhancement value (MEV) 를 보였다. 간문맥에서는 세 프로토콜 간의 유의적인 차이가 없었으며, 간 실질에서는 프로토콜 3 가 프로토콜 1 과 2 에 비해 유의적으로 더 낮은 MEV 를 보였다.
즉, 혈관의 조영 증강 정도만 보았을 때는 40%까지 조영제를 줄여도 기존 조영 방식과 비교 시 유의적인 차이는 없었다. 그러나 간 실질에서는 40%를
26
줄였을 때 유의적으로 조영 증강 정도가 낮게 측정되었으므로 혈관 및 간 실질의 조영 정도의 감소가 없는 수준에서는 30%까지 조영제 양을 줄일 수 있을 것으로 판단되었다. 따라서 개의 복강 CT 촬영 시에 saline chaser 의 사용이 추천되며, 이를 이용하여 조영제 총량을 줄임으로써 조영제와 관련한 부작용 및 비용을 감소시킬 수 있을 것으로 생각된다.
주요어 : computed tomography (CT), saline chaser, contrast material, abdomen,
dog
학번 : 2015-21831