저작자표시-비영리-변경금지 2.0 대한민국 이용자는 아래의 조건을 따르는 경우에 한하여 자유롭게
l 이 저작물을 복제, 배포, 전송, 전시, 공연 및 방송할 수 있습니다. 다음과 같은 조건을 따라야 합니다:
l 귀하는, 이 저작물의 재이용이나 배포의 경우, 이 저작물에 적용된 이용허락조건 을 명확하게 나타내어야 합니다.
l 저작권자로부터 별도의 허가를 받으면 이러한 조건들은 적용되지 않습니다.
저작권법에 따른 이용자의 권리는 위의 내용에 의하여 영향을 받지 않습니다. 이것은 이용허락규약(Legal Code)을 이해하기 쉽게 요약한 것입니다.
Disclaimer
저작자표시. 귀하는 원저작자를 표시하여야 합니다.
비영리. 귀하는 이 저작물을 영리 목적으로 이용할 수 없습니다.
변경금지. 귀하는 이 저작물을 개작, 변형 또는 가공할 수 없습니다.
공학석사 학위논문
Microfluidic platform to generate dynamic and diverse profiles of
chemical for long time to study biology at single cell level
화학물질의 시공간적으로 동적이고 다양한 프로파일 생성 및 단일 세포 수준 분석을 위한
미세유체소자 개발
2016년 8월
서울대학교 대학원
협동과정 바이오엔지니어링
송 지 영
1
Abstract
Microfluidic platform to generate dynamic and diverse profiles of
chemical for long time to study biology at single cell
Jiyoung Song Interdisciplinary program for Bioengineering College of Engineering Seoul National University
Significant advances in micro technology has been made to study cellular behavior, but there is still absence of robust profile generating device for mammalian cells. Unlike the unicellular organism, mammalian cell needs longer period of stimulation at least 6 hours more. Moreover, previous research revealed the limitation of petri-dish based conventional experiment. Since the cells are exposed to “dynamic environment” rather than static, conventional method can’t represent our real world. There has been lots of studies to generate versatile gradient for long-time, but the stimulation time is too short to employ to mammalian cells. In addition to this point, we could only generate one type of profile such as pulsing, gradient. Here we propose the microfluidic device that can generate all kinds of user defined profiles sequentially through computer controlled system. With this versatile device, we could generate pulsatile, ramping up/down, various gradient switching for long time.
Moreover, recent study discovered heterogeneous behavior of single cells, which has never stood out before with average-based analysis. Based on the result, the
2
single cells exhibit heterogeneity in ERK activation under the EGF or NGF stimulation. In this thesis, when the cells exposed to EGF gradient, some of the cells showed sustained activation. In contrast, the others behaved like the stimulation without any growth factors. It implies the cells might be switched on when they reached their threshold. Moreover, we observed that decay of activation was also delayed. Further studies are needed to determine what exactly affect this phenomena and rewire the signaling molecules. However, this work is still meaningful in the aspect of building long term multi-functional microfluidic platform. We expect this novel device to be used to study dynamic stimulation and their related cellular response in diverse filed of biology.
Keywords: Microfluidics, Ramping up and down, Gradient switching, Single- cell analysis, FRET biosensor, Heterogeneity, ERK dynamics
Student Number: 2014-20594
3
Contents
Abstract………..………..………….2
Contents……….………….4
List of Figures……….5
1. Introduction……….…………7
1.1 Microfluidic in Cell Biology………....7
1.2 Spatiotemporal dynamic stimulation and ERK signaling network 10
2. Methods and Materials ….………16
2.1 Generation of FRET biosensor transfected cell-line and culture ...16
2.2 Design of microfluidic device………..………..17
2.3 Fabrication of microfluidic device ……….…………..19
2.4 Soft lithography and Device preparation.………. 22
2.5 Cell seeding.……..……….……….………..25
2.6 Live cell Imaging..………..………...26
2.6 Image analysis..…….……….……...27
4
3. Result and
Discussion………29
3.1 Ramping up and down profiles ………....29 3.2 Gradient switching profiles and Single cell ERK activation…....33
4. Conclusion………….………36
References………….………37
Abstract (Korean) .…….………..……..……..39
Acknowledgement (Korean) .…….……..….………..41
5
List of Figures
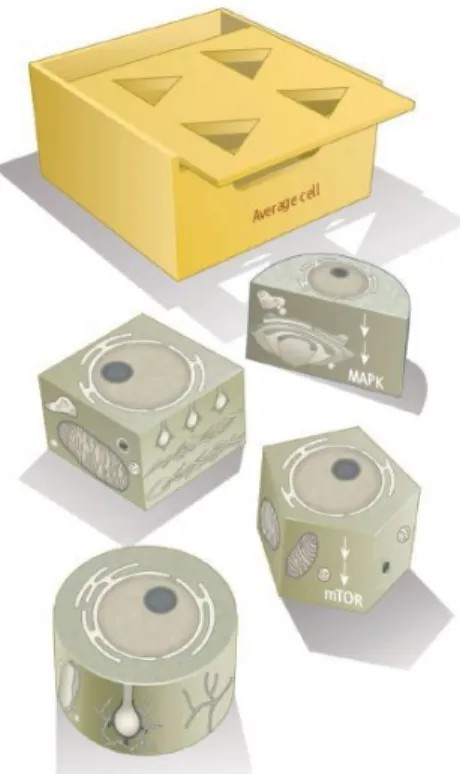
Figure 1.1 Individual cells present cell-to-cell variabilities in MAPK and mTOR system. It suggests that average based cellular response can not explain
heterogeneity among single
cells..………9
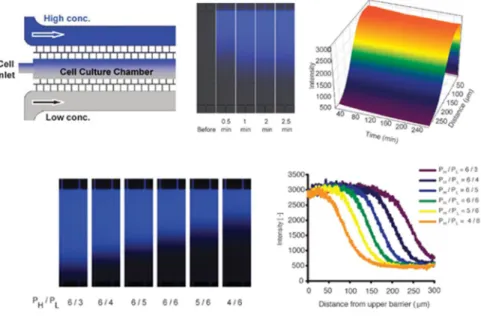
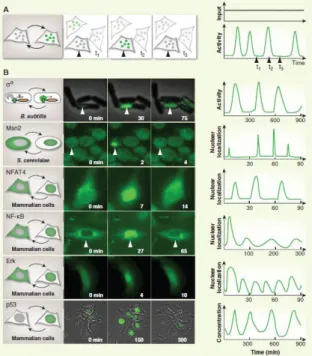
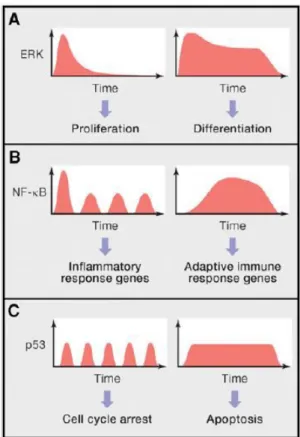
Figure 1.2 Microfluidic device for studying chemotaxis in yeast. The device is able to generate robust gradient ..………..………….………..10 Figure 1.3 Time-lapse microscopy techniques provides a direct view of circuit dynamics in individual living cells. It revealed pulsatile frequency modulation enables sequential combination of cellular response …………..……….…………12 Figure 1.4 Cell kinetics can be different even though it was evoked by the same molecule. The cellular response is determined by cellular dynamics
………13
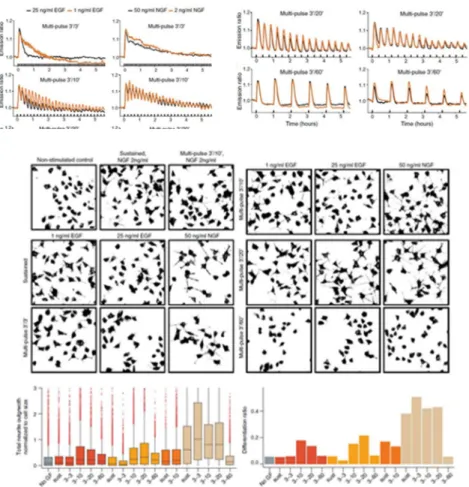
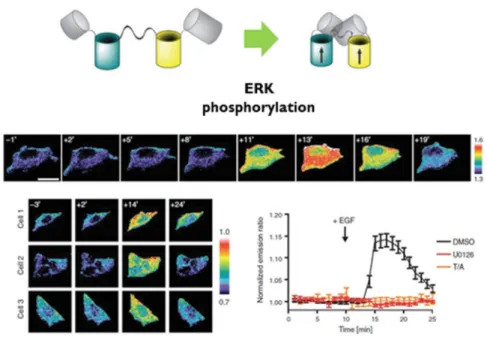
Figure 1.5 Pulsatile EGF/NGF stimulation homogenizes ERK activity dynamics and increases differentiate rate. It shows the possibility to regulate cell fate through frequency modulation………...15 Figure 2.1 Real time ERK kinetics in single cell. EKAR2G transfected HEK293 cells were stimulated using 50ng/ml of EGF at time 0. ERK activities are continuously changed and can be observed over time …….……….……..18 Figure 2.2 Image of microfluidic device and scheme of system. (A) Image of the microfluidic device for ramping and pulsing (B) Image of the microfluidic device for ramping, pulsing and gradient switching. (C) Inverted fluorescence microscope and pneumatic pump are computer controlled. Pre-defined profile can be generated
in cell culture
chamber….……….………21
6
Figure 2.3 Scheme of device fabrication. (A) Protocol for Photolithography (B) Protocol for soft lithography. It depicts the fabrication steps for the reservoir embedded microfluidic device. ………..…...24 Figure 3.1 Ramping up/Ramping down profile in cell chamber region. (A,B) Fluorescence image of gradient profile, which were visualized by the fluorescent dye(FITC-dextran). Intensity of the fluorescence is quantified by measuring mean intensity of cell chamber by Image J. Ramping up/down steps were 5(C) and 10
(D) for each
………31
Figure 3.2 Ramping up/Ramping down profile in cell chamber region. (A, B) Fluorescence image of gradient profile, which were visualized by the fluorescent dye (FITC-dextran). (B) Intensity of the fluorescence is quantified by measuring mean intensity of cell chamber by Image J. (C) Ramping up/down steps can be different. In this case, 5 steps for ramping up and 10 steps for ramping down were set by adjusting gap of pressure change. (D) The interval and the number of steps
and gaps can be controlled by user-defined
protocol………...32
Figure 3.3 Surface plot of fluorescence intensity when the gradient changed. It can be used as a powerful tool to study chemotaxis in mammalian
……….34
Figure 3.4 Single cell ERK activity kinetics. The cells were exposed to stimulation in shapes of (A) control, without EGF (B) global (C) gradient respectively. Each line(gray) indicates individual cells………..35
7
1. Introduction
1.1 Microfluidic in Cell Biology
Cell is the basic structural and functional unit of any living thing. To understand cell, Biologist has been used conventional plastic petri- dish cell culture methods. However, micro-environment in culture dish is different from in vivo. Cells experience harsh condition such as stiff plastic bottom, air exposure, and confined medium. Recent advances in micro technology enable to fabricate complex microfluidic device to study cellular behavior. Lee et al. designed a microfluidic chip to regulate the gradient profile at any given time, and allows quantitative monitoring of cell morphology and the localization and expression of specific marker proteins. [1] It offers opportunity to investigate cellular behavior under dynamic gradient at single cell level but, there is still absence of robust gradient generating device for systematic analysis of mammalian cell. Mammalian cell
8
needs longer stimulation time, compared to yeast due to their complexity.
Meanwhile, Biologists have focused on small elements inside cell using immune-blotting, ELISA (Enzyme-Linked Immunosorbent Assay), etc. to understand molecular signaling pathway. Recent study, however, revealed understanding of each component cannot explain cell system. Against reductionist, pluralism through quantitative measure and understanding of complex interaction of cellular networks becomes new paradigm in cell biology. [2, 3] The system- level understanding of the molecular signaling pathway would help predict the cellular response precisely, and be expected to open novel avenues for regenerative medicine, disease research and diagnostics.
[4, 5]
9
Figure 1.1. Individual cells present cell-to-cell variabilities in MAPK and mTOR system. It suggests that average based cellular response can’t explain heterogeneity among single cells. [2]
10
Figure 1.2. Microfluidic device for studying chemotaxis in yeast. The device is able to generate robust gradient. [1]
1.2 Spatiotemporal dynamic stimulation and ERK signaling network
RTKs(Receptor tyrosine kinase), and their downstream signaling programs such as the MAP kinase ERK are key regulators of different cell fates such as proliferation, differentiation, cell death. [6] Many different RTKs exist, and when stimulated by their cognate ligands
11
such as EGF, FGF PDGF, most of them will activate the MAPK (Mitogen-activated protein kinase) pathway. An important question is therefore how specific cell fates are specified. Previous study of our group described how the cell fate and ERK (Extracellular signal- regulated kinase) activation related. It is well-known that stimulation with EGF (Epidermal growth factor) or NGF (Nerve growth factor) lead to transient or sustained ERK activation dynamics, which specifically triggers proliferation or differentiation.[7] It has therefore been proposed that the duration of ERK signaling determines cell fate.
[5, 8] ERK signal duration is sensed and induces the specific transcriptional programs leading to the different cell fates.
12
Figure 1.3. Time-lapse microscopy techniques provides a direct view of circuit dynamics in individual living cells. It revealed pulsatile frequency modulation enables sequential combination of cellular response. [9]
13
Figure 1.4. Cell kinetics can be different even though it was evoked by the same molecule. The cellular response is determined by cellular dynamics. [10]
14
When it comes to the ways of stimulation, dropping the target matter such as drug, hormones, growth factor to culture dish has been used widely as the classic biochemical methods. However, our in-vivo system is more complex and spatiotemporally dynamic. According to our previous study, we demonstrated that dynamic control of ERK activation dynamics using pulsed GF stimulation. [11] It provides a rationale to rewire and homogeneous cell type. We employed our novel insight to this study. Here, we propose versatile microfluidic device that provides all kinds of profiles such as pulsatile, linear gradient, ramping up and down. We used NIH 3T3 fibroblast cells and MDA-MB-231 cells, which is standard cell line to study cell migration and wound healing. We observed ERK dynamics for initial 60 minutes under the linear EGF gradient. Then, we compared the ERK dynamics with global stimulation of EGF.
15
Figure 1.5. Pulsatile EGF/NGF stimulation homogenizes ERK activity dynamics and increases differentiate rate. It shows the possibility to regulate cell fate through frequency modulation. [11]
16
2. Material and Methods
2.1. Generation of FRET biosensor transfected cell-line and culture
Through the lentiviral transfection, we could generate stable cell line expressing EKAR2G1. We purchased 3T3 Fibroblast cells. (Invitrogen, USA) were purchased and transfected with lentivirus and following constructs. Supernatant was then collected and concentrated with a Lenti-X concentrator kit (Clontech, Japan). These cells were subsequently cultured in presence of 1μg/ml puromycin (Sigma, Germany) in order to select only transfected cells. We cultured this stable cell line in DMEM (Sigma, Germany) supplemented with 10%
fetal bovine serum (FBS, Sigma, Germany), 1% pen-strep (Sigma, Germany) and 1μg/ml puromycin. Cells were sub-cultured at 70%
confluence with 0.25% Trypsin-EDTA (Sigma, Germany). 1 hour
17
prior to imaging experiment, we change the medium to Ham’s F-12 Medium supplemented with 0.5% 10% fetal bovine serum (FBS, Sigma, Germany) to reduce basal activity of cells.
2.2. Design of microfluidic device
Microfluidic device was modified from the previous research.
Stimulation time of the first generation was too short to be used in mammalian cell. Its second generation has been developed to mammalian cell culture, but it wasn’t able to generate different concentration of target matter, due to their lack of mixing channel. By adding mixing channel, gradual mixing of 2 fluids has been perfectly performed. This device also has been designed to minimize physical interruption to cell such as shear stress by convection flow. Unlike the previous device, this device consists of two different height. Lower channel, approximately 10μm, prevents back flow and helps achieving the exact desired concentration. Higher channel is designed to 55μm,
18
which is necessary to mix two laminar flow fluids and suitable for mammalian cell culture.
Figure 2.1. Real time ERK kinetics in single cell. EKAR2G transfected HEK293 cells were stimulated using 50ng/ml of EGF at time 0. ERK activities are continuously changed and can be observed over time. [12]
19
2.3 Fabrication of microfluidic device
To make the microfluidic device consisting of 2 two different height, Photo-mask films were drawn individually with CAD program (AutoCAD 2010, DE). A silicon wafer for master mold was prepared with plasma treatment. (FEMTO Science, Korea). Then, the wafer was spin-coated with SU-8 5 (Microchem, US) achieving 10μm approximately (1800rpm, 60sec). After spin-coating procedure, the wafer was soft baked on a hot plate. ; 1minute at 65°C and 15 minutes at 95°C. Film mask (Han&All tech, Korea) is then tightly contacted to the surface of wafer. The wafer was exposed UV radiation with 405nm wavelength and 250 mJ using 500 W mercury lamp (Osram, DE) for 40 seconds (Shinu MST, Korea). After exposure, the wafer was baked at 65°C for 1 minute and 95°C for 5 minutes consequently.
SU-8 developer (Microchem, USA) was used to remove the photoresist of unexposed part. If the first layer was perfectly
20
fabricated, photoresist for second layer (SU-8 50, Microchem) was spin-coated again on the wafer (2200rpm, 50 sec). The wafer was soft- baked on a hot plate at 65°C for 5 minute and 95°C for 30 minutes.
Film mask was precisely aligned over a square-shaped align pattern on the first layer by using microscopy (Han&All tech, Korea). After the wafer was exposed to UV radiation for 70 seconds, hard-baking procedure were followed at 65°C for 1 minute and 95°C for 15 minutes. Finally, the wafer was dipped into the developer to get rid of the unexposed part. The completely fabricated wafer was baked on the hot plate to evaporate residual solvent.
21
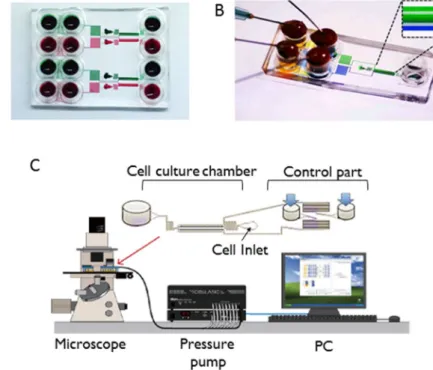
Figure 2.1. Image of microfluidic device and scheme of system. (A) Image of the microfluidic device for ramping and pulsing (B) Image of the microfluidic device for ramping, pulsing and gradient switching.
(C) Inverted fluorescence microscope and pneumatic pump are computer controlled. Pre-defined profile can be generated in cell culture chamber.
22
2.4. Soft lithography and device preparation
Poly dimethyl siloxane (PDMS) was used to replicate the silicon master. The precursor (Slygard 184, Dow Corning, US) was mixed at a 10:1 ratio. PDMS is well-known for its biocompatible, transparent, gas permeable and flexible property. Caster the 7g of mixed PMDS on the silicon wafer and degassed in a vacuum chamber for 30 minutes.
By mixing the PDMS a couple of hours before casting, time degassing can be reduced. The degassed PDMS was baked on the hot plate for 20 minutes. After solidifying the PDMS, plastic reservoir from the 8- well strip (Evergreen, USA) was glued on top of the first layer using PDMS. These reservoirs not only offer the connection to ONIX Pneumatic pressure pump (Millipore), but also provide sufficient medium to cells through the micro channel. Once the reservoir firmly
23
attached, the second layer of PDMS caster on the first later. In this process, degassing in the vacuum chamber is avoided to prevent a separation between the silicon mold and the first layer. PDMS replica was then cut and punched using biopsy punch (Miltex, US). Bonding surface of the PDMS was cleaned with sticky tape and a coverslip (Tasumi, Japan) was sterilized with 70% EtOH (Sigma, Germany).
The PDMS replica and the Coverslip was treated with plasma etcher for 1 minute to bond each other enough to overcome the high pressure applied during experiment. To enhance the bonding strength, the device was incubated at 75 °C dry oven for 15 minutes. Finally, by adding 1 ml of PBS to each reservoir to prevent the hydrophilic surface recovering into hydrophobic, the device preparation was completed.
24
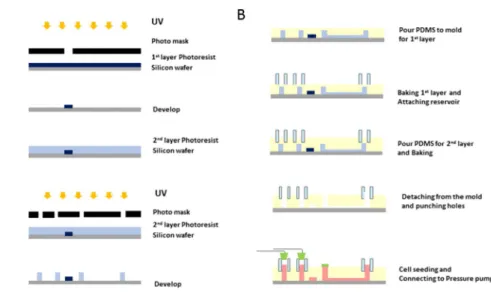
Figure 2.2. Scheme of device fabrication. (A) Protocol for Photolithography (B) Protocol for soft lithography. It depicts the fabrication steps for the reservoir embedded microfluidic device.
25
2.5. Cell seeding
Before cell seeding, a device should be coated with 50μg/ml of fibronectin. A fibronectin from bovine (Sigma, Germany) was diluted with PBS. (GE Healthcare, US) The final concentration of fibronectin is 50μg/ml. The device stored at 4°C degree overnight. The 3T3 Fibroblasts, which described above were gently detached from culture dish using 2ml of Trypsin EDTA and cell scraper. (SPL Lifescience, Korea) The cell density was adjusted to around half million. 40μl of prepared cell suspension were loaded to outlet. Through the inlet at the middle of the device, 7μl of fibronectin were aspirated. The cells were seeded inside using this fluid flow. After incubation for 30 min, the residual cell suspension in outlet were removed and refilled with
26
fresh completed medium.
6 hours prior to the experiment, the medium in outlet was replaced with a starvation medium. The starvation medium consists of DMEM and 0.5% FBS. After starvation, the reservoir was filled with either starvation medium only or starvation medium containing 25ng/ml of EGF. Then, we connected the device to pneumatic pump (Millipore, USA). Connecting the device to pneumatic pump using custom-made connector and reservoir (Evergreen, USA) let us to control the fluid flow inside the device. We used a program provided by Millipore to control the pressure. By programming the sequence of the pressure from the pump, we could build computer-controlled, pre-defined profile of GFs. We generated gradient inside the cell chamber and observed how they ERK kinetics behaved. To prevent unwanted fluid flow through inlet channel, sealing tape were attached on the inlet.
2.5 Live cell imaging
27
All images in this paper were captured using epi-fluorescence Eclipse TI-e inverted microscope (Nikon, Japan) with Plan Apo air 20x objective and Plan Apo air 40x. Hamamatsu Orca flash 4.0 CCD at 16-bit resolution were used and Microscope system includes filter wheel, and motorized stage were controlled by NIS software (Nikon, Japan). Donor, FRET and Rhodamine imaging were sequentially obtained by using external filter (Chroma, USA) and shutter system (Sutter Instrument, USA), dichroic mirror. These are the excitation dichroic mirror, and emission filters were used for each channel.
Donor channer : 430/24×, Q465LP, 480/40m; FRET channel: 430/24×, Q465LP, 535/30m; mCherry channel: ET572/35, 89006bs, 632/60m for rhodamine imaging. Rhodamine image were used to confirm gradient profile inside the cell chamber. Acquisition time were 300 ms for donor and FRET channel and 200ms for rhodamine channel at 2x2 binning.
28
2.7 Image analysis
All FRET ratio imaged were analyzed by using Cell profiler. We built the sequence of image process and analyzed the images automatically.
Following analysis modules we used; CorrectIlluminationCalculate.
IdentifyPrimaryObjects, ExpandOrShirinkObjects, MaskImage, ImageMath, TrackObjects, MeasureObjectIntensity, ExportToSpreadsheet, and Save Images. We measured the mean intensity of background and substrate the value from each Donor and FRET images. The FRET image were divided by donor image and multiplied by 1000 to produce 16-bit ratio images. Each cells were segmented based on a Mask image. The Mask image were provided by stacking the separated time-lapse images. The cells located at the edge of the ROI and aggregated each other were disregarded. Average value of calculated single cell ratio images were exported to excel file.
The average value of initial 30 minutes were used for normalization.
As a result, each lines referred to ERK activity of each cells. The
29
rhodamine images were stacked and measured average intensity of ROI. Through this, we could confirm the sptio-temporally defined profile of growth factor exposure in cell chamber.
3. Result and Discussion
3.1 Ramping up and down profiles
We confirmed that mixing channel that has 240 μm of width, 55 μm of height and 27 mm of total length let us mix two laminar flow each other. Through the mixing channel, we were able to generate various profiles of GF in microfluidic device for up to 11 hours. The gradient generation time is dependent on the size of reservoir and the pressure that applied to control part. We applied 1 psi for each reservoir in this experiment. We expect to increase the stimulation time by reducing the pressure of control part. We confirmed that the gradient is stable at
30
minimum pressure level (0.25 psi for each). By programming the sequence of pump operation, we could generate diverse ramping up and down profiles. (Figure 9A-13A) We also measured the mean intensity of the cell chamber and plotted. Figure 9B-13B) Figure 9 and 10 show ramping up and down profile of 5 steps and 10 steps respectively. Compared to the profile of Figure 9(A), Figure 10(A) displays more elaborate changes in intensity. It can be used to test cellular sensitivity of specific GF. Figure 11 also shows ramping up and down profiles, but has different step. The protocol has been designed to have different steps. It has 5 steps of ramping up and 10 steps of ramping down profiles. It also can combined with pulsatile stimulation, as shown in Figure 11A. Besides, we could generate arbitrary sinusoidal profiles. (Figure 12 A)
31
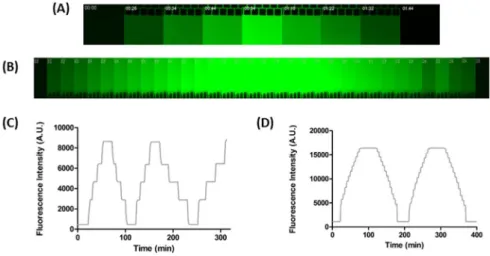
Figure 3.1. Ramping up/Ramping down profile in cell chamber region. (A, B) Fluorescence image of gradient profile, which were visualized by the fluorescent dye (FITC-dextran). Intensity of the fluorescence is quantified by measuring mean intensity of cell chamber by Image J. Ramping up/down steps were 5(C) and 10 (D) for each.
32
Figure 3.2. Ramping up/Ramping down profile in cell chamber region.
(A, B) Fluorescence image of gradient profile, which were visualized by the fluorescent dye (FITC-dextran). (B) Intensity of the fluorescence is quantified by measuring mean intensity of cell chamber by Image J. (C) Ramping up/down steps can be different.
In this case, 5 steps for ramping up and 10 steps for ramping down were set by adjusting gap of pressure change. (D)The interval and the number of steps and gaps can be controlled by user-defined protocol.
33
3.2. Gradient switching profiles and Single cell ERK activation
In addition to ramping profiles, we also could generate switching profiles that has different rate of gradient change. We expect this device to be used to study chemotaxis in mammalian cells. Especially, there is no report of a mammalian cell migration when the gradient changes. In this paper, I used our device to study ERK dynamics when the cells exposed to EGF gradient. We first the cells exposed to starvation medium without any growth factor. The cells showed quite stable baseline during the experiment. Then, we let the cells expose to EGF stimulation. The cells experienced the EGF like step function. In this case, the cells exhibited heterogeneous behaviors. Some cells showed transient activation. In contrast, the others showed sustained activations. It’s already revealed in previous research. Based on the previous result, we examined how the cells behave under the gradient.
30 minutes after the initiation, we let the cells experience the EGF gradient.
34
Figure 3.3. Surface plot of fluorescence intensity when the gradient changed. It can be used as a powerful tool to study chemotaxis in mammalian cells
35
Figure 3.3. Surface plot of fluorescence intensity when the gradient changed. It can be used as a powerful tool to study chemotaxis in mammalian cells
36
4. Conclusion
We demonstrated a platform for investigate cells under diverse profiles of chemicals. By adding lower layer to reduce the flow rate and prevent back flow to reservoir, we could generate robust profiles including pulsing, ramping up/down, and gradient switching. Since the cells in-vivo experience spatio-temporal dynamic stimulation of chemicals, the microfluidic device we built would be a powerful tool kit to understand cellular behavior in diverse aspect of biology.
Moreover, the analyzing the cells in single cell level, which is one of the outstanding feature of microfluidic device, we could observed their heterogeneous behavior.
We expect this new approach to cell would open a new sight to elucidate various cellular responses in cell biology.
37
References
1. Lee, S.S., et al., Quantitative and dynamic assay of single cell chemotaxis. Integr Biol (Camb), 2012. 4(4): p. 381-90.
2. Pelkmans, L., Using Cell-to-Cell Variability—A New Era in Molecular Biology. Science 2012. 425(336): p. 425-426.
3. Uhlendorf, J., et al., Long-term model predictive control of gene expression at the population and single-cell levels. Proc Natl Acad Sci U S A, 2012. 109(35): p. 14271-6.
4. Citri, A. and Y. Yarden, EGF-ERBB signalling: towards the systems level. Nat Rev Mol Cell Biol, 2006. 7(7): p. 505-16.
5. Chen, J.Y., et al., A two-dimensional ERK-AKT signaling code for an NGF-triggered cell-fate decision. Mol Cell, 2012. 45(2):
p. 196-209.
6. Avraham, R. and Y. Yarden, Feedback regulation of EGFR signalling: decision making by early and delayed loops. Nat Rev Mol Cell Biol, 2011. 12(2): p. 104-17.
7. Marshall, Specificity of receptor tyrosine kinase signaling Transient versus sustained extracellular signal-regulated kinase activation. Cell, 1995. 80: p. 179-185.
8. Frances A Brightman, D.A.F., Differential feedback regulation of the MAPK cascade underlies the quantitative differences in EGF and NGF signalling in PC12 cells. FEBS Letters, 2000.
482(3): p. 169-174.
9. Joe H. Levine, Y.L., Michael B. Elowitz, Functional Roles of Pulsing in Genetic Circuits. Science, 2013. 342: p. 1193-1200.
10. Purvis, J.E. and G. Lahav, Encoding and decoding cellular information through signaling dynamics. Cell, 2013. 152(5): p.
38 945-56.
11. Ryu, H., et al., Frequency modulation of ERK activation dynamics rewires cell fate. Mol Syst Biol, 2015. 11(11): p. 838.
12. Fritz, R.D., et al., A versatile toolkit to produce sensitive FRET biosensors to visualize signaling in time and space. Sci Signal, 2013. 6(285): p. rs12.
39
국 문 초 록
마이크로 기술의 비약적인 발전은 세포의 행동을 연구하기 위한 다양한 미세유체 소자 시스템의 개발을 이루어냈지만, 동물 세포를 위한 장시간의 프로파일을 생성하는 디바이스는 여전히 부재한다.
단세포 생물과 달리 동물 세포는 최소 6시간 이상의 긴 자극시간을 필요로 한다. 현재까지 장시간의 견고한 농도 구배를 형성하기 위한 많은 연구가 진행되었지만, 동물 세포 실험에 사용하기에는 여전히 부적합한 하다. 또한 이전 선행연구에서 지적한 기존의 배양접시 수준의 전통적인 실험 방식의 한계점은 실제 세포는 “동적인 환경”에 노출되어 있기 때문에 정적인 환경을 대표하는 기존의 전통적인 방식은 실제 세포의 환경을 반영하지 못한다는 것이다.
이러한 문제를 해결하기 위한 디바이스들이 개발되었지만, 이는 여전히 펄스, 혹은 화학적 농도 경사 만이 가능하였으며, 장시간 자극에 한계가 있었다. 이에 장시간 펄스, 농도 경사, 점진적 농도 증가 및 감소 프로파일이 형성 가능한 시스템을 개발하였다.
또한 미세유체소자 기술로 인해 기존의 평균 기반의 분석 기법으로는 밝혀지지 않았던 세포의 이질성이 밝혀지면서 단일세포수준의 세포 관찰 및 분석의 중요성이 대두되었다. 이는 세포가 성장인자에 노출되었을 때 각각의 세포가 서로 다른 이질성을 보인다는 선행연구를 통해 확인된 바 있으며, 이 논문을 통해 세포의 상피세포 성장인자의 농도 경사에 따른 반응을
40
분석하였다. 결과에 대한 분자세포 생물학 수준에서의 정확한 메커니즘 분석을 위해서는 추가 연구를 필요로 하지만, 다양한 프로파일을 장시간에 걸쳐서 생성할 수 있는 플랫폼을 개발하였다는 것만으로도 충분히 의미가 있다. 우리는 이 미세유체 소자가 동적 자극에 따른 세포의 반응과 관련된 다양한 생물학 분야에서 사용될 수 있기를 기대한다.
주요어: 미세유체소자, 점진적 농도증감, 동적농도구배, 단일세포분석, 형광공명에너지전달, 바이오센서, 이질성, 생분자동역학
학 번: 2014-20594