저작자표시-비영리-변경금지 2.0 대한민국 이용자는 아래의 조건을 따르는 경우에 한하여 자유롭게
l 이 저작물을 복제, 배포, 전송, 전시, 공연 및 방송할 수 있습니다. 다음과 같은 조건을 따라야 합니다:
l 귀하는, 이 저작물의 재이용이나 배포의 경우, 이 저작물에 적용된 이용허락조건 을 명확하게 나타내어야 합니다.
l 저작권자로부터 별도의 허가를 받으면 이러한 조건들은 적용되지 않습니다.
저작권법에 따른 이용자의 권리는 위의 내용에 의하여 영향을 받지 않습니다. 이것은 이용허락규약(Legal Code)을 이해하기 쉽게 요약한 것입니다.
Disclaimer
저작자표시. 귀하는 원저작자를 표시하여야 합니다.
비영리. 귀하는 이 저작물을 영리 목적으로 이용할 수 없습니다.
변경금지. 귀하는 이 저작물을 개작, 변형 또는 가공할 수 없습니다.
공학박사 학위논문
Modulation of Electrochemical Properties of Organic and Inorganic
Electrode Materials of Lithium Batteries
리튬이온전지의 유 / 무기 전극의 전기화학적 특 성 조절 연구
2020년 2월
서울대학교 대학원
화학생물공학부
유 영 근
i
Abstract
Modulation of Electrochemical Properties of Organic and Inorganic Electrode Materials of
Lithium Batteries
Young Geun Yoo School of Chemical and Biological Engineering The Graduate School Seoul National University
Among the various types of secondary batteries, lithium ion battery (LIB) is most widely utilized energy storage system in various electric devices due to its distinctively high energy and power density. Since its first commercialization around 1990s, LIB has been adopted in many portable devices such as mobile phone and laptop, and presented great conveniences to human beings. Recently, LIB with ever higher energy and power density is under vigorous research as the demands of electrified transportations are dramatically increasing. Because the energy and power density of LIB is directly related to the driving mileage and performance of the electric vehicles (EVs), those two properties always have been come first in developing next- generation secondary batteries.
ii
Beside the energy and power efficiency, however, the importance of precise input voltage has usually been ignored which is directly related to the energy-efficient usage of devices. Therefore, precise tuning of operating potential of electrode material is also an important research issue. Also, because the relationship between power and energy density is generally a trade-off each other, it is an important issue to modulate those electrochemical properties depending on the usage of the applied devices. In this thesis, case study on the precise tuning of electrochemical properties in inorganic and organic electrode materials will be introduced.
Metal lithium titanate, MLi2Ti6O14 (MLTO, M=2Na, Sr, Ba, Pb etc.) can afford various metal species in M site, and diverse electrochemical properties can be obtained depending on the metal species. Using this characteristic property of MLTO, precise modulation of electrochemical properties was achieved by varying stoichiometry of M species. In this study, sodium and strontium were adopted as M species and their stoichiometry were modulated during synthesis procedure. When the sodium content increases, potential vs.
lithium decreased and specific capacity decreased, and opposite phenomena were observed when the strontium content increases. Density functional theory calculations revealed that the potential tunability in MLTO is originated from the change of Bader charge of titanium atom depending on the coordinating M environment.
Graphene is well known as a chemically inert material in room temperature.
iii
Even though, after undergoing a strong oxidation reaction, various functional groups can be attached via organic synthetic routes in relatively mild conditions. Using this property, brand-new type electrode material with high lithium electroactivity was rationally designed and synthesized, named as graphene sulfide framework (GSF). In addition to graphene, various types of linker molecules with disulfide bonds, which could undergo structural self- healing mechanism, were linked between graphene layers as building blocks.
As a result, distinctive electrochemical properties, especially rate capability, were observed depending on the linker molecules. Various electrochemical and instrumental analyses revealed the lithium storage mechanism of GSF, that at a low current density, lithium can be intercalated between graphene layers when only absorb outer layers of graphene at a higher current density.
Keywords: Energy storage system, Lithium-ion battery, Electrochemical property modulation, Metal lithium titanate, Graphene, Inorganic electrode material, organic electrode material
Student number:2014-21578
iv
Contents
Chapter 1. Introduction ... 1
1.1 Importance of tunable electrochemical property in lithium- ion batteries ...1
1.1.1 Toward Next-Generation Lithium Batteries: What is the key point?... 1
1.1.2 Relationship between input voltage and device efficiency ... 2
1.1.3 Development of high power and energy density LIBs ... 3
1.2 Development of inorganic-based, potential-tunable anode material ...7
1.3 Transition metal-free graphene-based organic electrode materials ...8
1.4 Objectives ...10
Chapter 2. Tuning the Li
+storing properties in MLi
2Ti
6O
14via stoichiometric modulation of M species 13 2. 1 Experimental
... 132.1.1 Synthesis of Na2-2xSrxLi2Ti6O14 ... 13
2.1.2 Characterization ... 14
2.1.1 Electrochemical Test ... 14
2.1.1 Density Functional Theory (DFT) calculations ... 15
2. 2 Results and Discussion
... 162.2.1 Materials Characterization ...16
2.2.2 Formation energy calculation of NaSrLTO via DFT ...17
2.2.3 Electrochemical Characterizations ...18
2.2.1 Bader charge calculation of Ti atom via DFT ...19
v
Chapter 3. Graphene Sulfide Framework for the transition metal-free anode material with distinctive
electrochemical performance ... 30
2. 1 Experimental
... 302.1.1 Synthesis Method of GSF ... 30
2.1.2 Characterizations ... 32
2.1.1 Electrochemical Measurements ... 32
2. 2 Results and Discussion
... 332.2.1 Materials Characterization ...33
2.2.2 Electrochemical Performance Evaluation ...35
2.2.3 Li+storage mechanism analysis of GSFs ...37
Chapter 4. Summary and Conclusions ... 59
Chapter 5. Recommendations on Further Research .... 61
Bibliography ... 62
국 문 초 록 ... 69
vi
List of Tables
Table 2-1. Calculated binding energy and formation energy of reaction (1- x)Na2Li2Ti6O14+ xSrLi2Ti6O14 → Na2-2xSrxLi2Ti6O14(x=0, 0.25, 0.5, 0.75, 1) by density functional theory. ...24 Table 2-2.Actual stoichiometry of synthesized NaSrLTOs with various Na/Sr ratios determined by inductively coupled plasma (ICP) analysis. ...29 Table 3-1Measured BET surface area of GSFs. ...53 Table 3-2 Resultant parameters of EIS data by fitting simulations. ...56 Table 3-3 Comparison of GSF with previous researches on the graphene- based anode materials for LIBs. ...58
vii
List of Figures
Fig. 1-1Ragone plot of various types of electric energy storage systems. .... 5 Fig. 1-2 Simplified diagram of commonly used LIB composed of LiCoO2 as cathode and graphite as anode material. ... 6 Fig. 2-1SEM images of Na2-2xSrxLi2Ti6O14: (a) x=0.0, (b) x=0.25, (c) x=0.5, (d) x=0.75 and (e) x=1.0. ... 21 Fig. 2-2XRD patterns of the Na2-2xSrxLi2Ti6O14samples, (a) plotted from 10º to 80º and (b) magnified plot of Fig. 2-2(a) from 10º to 15º. The red arrows on (b) indicate (111) plane of SrLi2Ti6O14. ... 22 Fig. 2-3Simulated XRD patterns of the Na2-2xSrxLi2Ti6O14 samples, (a) plotted from 10oto 80oand (b) magnified plot of Fig. 2-3(a) from 10oto 15o. ... 23 Fig. 2-4 Galvanostatic charge/discharge curves of Na2-2xSrxLi2Ti6O14: (a) x=0.0, (b) x=0.25, (c) x=0.5, (d) x=0.75 and (e) x=1.0. The green dashed lines indicate potential plateau regions of the samples. ... 25 Fig. 2-5 Galvanostatic charge profiles (left) and their corresponding differential capacity data (right) of Na2-2xSrxLi2Ti6O14 samples: plotted at (a) 1.25 – 1.50 V and (b) 1.05 – 1.25 V. ... 26 Fig. 2-6 Diagram of peak positions and its intensity of differential capacity plotted versus x of Na2-2xSrxLi2Ti6O14. ... 27
viii
Fig. 2-7 (a) Crystal structures of Na2Li2Ti6O14, NaSr0.5Li2Ti6O14 and SrLi2Ti6O14 and (b) calculated Bader charge of titanium atom of different Na/Sr ratio of NaSrLTOs. ... 28 Fig. 3-1 Schematic illustration of the synthetic procedure for a GSF.
GSF/BDT is shown as a representative. ... 43 Fig. 3-2Graphic images, TEM and SEM images of (a) SSGO, (b) GSF/EDT, (c) GSF/BDT, (d) GSF/BPDT and (e) GSF/TPDT. ... 44 Fig. 3-3. XRD patterns of SSGO, GSF/EDT, GSF/BDT, GSF/BPDT and GSF/TPDT from 5o to 35o. Raw data are expressed as hollow dots and solid lines indicate smoothed values. Adjacent-averaging was utilized for smoothing, and the point of windows was set as 50. ... 45 Fig. 3-4. XRD patterns of intermediate materials: (a) Graphite and (b) GO, bwGO and SHGO. ... 46 Fig. 3-5 XPS spectra and deconvoluted peaks for C1s and S2p of (a) SHGO, (b) SSGO and (c) GSF/BDT. ... 47 Fig. 3-6Normalized XPS S2p peak of SHGO, SSGO and GSF/BDT from 161 to 166 eV. Red and blue arrows indicate peak shift of SSGO and GSF/BDT, respectively. ... 48 Fig. 3-7 Galvanostatic charge/discharge results of SSGO and GSFs: (a) 1st cycle charge/discharge profiles, (b) Specific capacities measured at various current densities from 0.05 to 5 A g-1 for 5 cycles each and (c) long term stability test. ... 49
ix
Fig. 3-8 (a) 1st cycle Charge/discharge profile of GSF/BDT at the current density of 0.05 A g-1 and the selected potential points for ex-situ electrode analysis and (b) C1s XPS spectra obtained from disassembled electrodes. . 50 Fig. 3-9 1st cycle charge/discharge profiles of (a) SSGO, (b) GSF/BDT (c) GSF/BPDT, (d) GSF/TPDT and (e) GSF/EDT at various current densities. 51 Fig. 3-10 1stcycle charge/discharge profiles of (a) graphite, (b) bwGO and (c) SHGO. (d) Specific capacity at various current densities of graphite, bwGO, SHGO. ... 52 Fig. 3-11 (a,b) Differential capacity analyses during Li extraction at current density of (a) 50 mA g-1 and (b) 250 mA g-1, (c) Nyquist plots analyzed at frequencies ranging from 100 mHz to 100 kHz at a 10 mV amplitude and (d) applied equivalent circuit model for parameter fitting. ... 54 Fig. 3-12 S2p XPS spectra of GSF/BDT electrodes after various charge or discharged at various current densities, between 156 and 165 eV. Hollow dots, dash lines and solid lines indicate raw data, background and deconvoluted peaks, respectively. ... 55 Fig. 3-13Schematic illustrations explaining the Li+storing mechanisms with various GSF materials at different current rates. ... 57
1
Chapter 1. Introduction
1.1 Importance of tunable electrochemical property in lithium-ion Batteries
1.1.1 Toward next-generation lithium batteries: What is the key point?
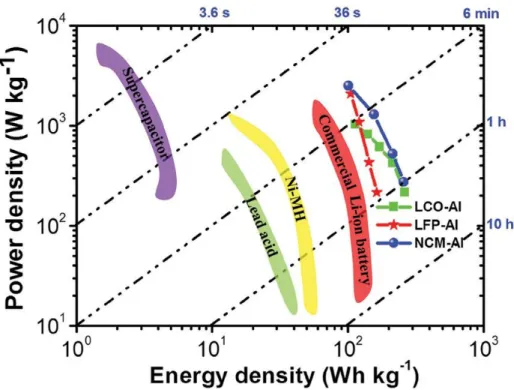
Lithium ion battery (LIB) is one of the widely applied electric energy storage devices in various industrial fields due to its high power and energy density compared to other types of secondary batteries, such as Ni-MH, alkaline or lead-acid battery (Fig. 1-1).[1] From microscale (e. g. smartwatch, mobile phone) to macroscale (e. g. electric vehicle (EV), energy storage system (EES)), the coverage of utilization of LIB is keep increasing without boundary. Most importantly, as the commercialization of EVs is rapidly processed in these days, the development of LIB with advanced performance is an urgent project to improve the safety and driving mileage of EVs.
For the LIB with high performance and reliability, many requisites - power density, energy density, safety, life expectancy, processability, etc. - should be accomplished. Among them, the most important two parameters of certain electric energy storage system to exhibit its excellence would be power and energy density. High power density, determined by operating potential and current rate capability, allows LIBs to be applied in various electric devices, especially on macro-scale devices. The high power density
2
also means that the battery could be recharged within short time period, and therefore is one of the important prerequisite for application in EVs. High energy density means higher capability of energy storage, therefore make possible to extend hours of use of applied devices.
Nevertheless, high power and energy density would not always be the solution, in case of certain device which requires precise input voltage to achieve the highest energy efficiency.[2,3] Also, in many cases, power and energy density is in a trade-off relationship each other. Therefore, it is important to select proper electrode materials or systems for the appropriate usage of the devices. However, almost all of the existing inorganic electrode materials have fixed thermodynamic chemical potential vs.Li and theoretical capacity. This elucidates the necessity of electrode material with finely tuned electrochemical properties.
1.1.2 Relationship between input voltage and device efficiency
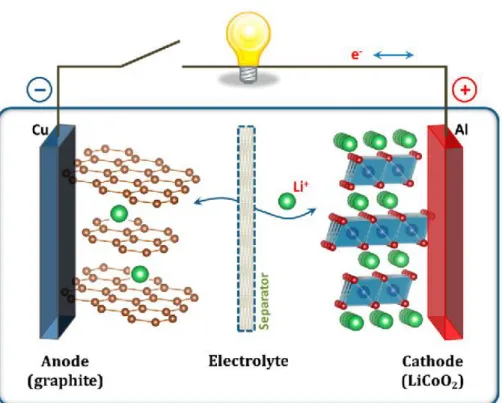
The most common configuration of the commercialized LIBs is composed of graphite and LiCoO2 (LCO) as anode and cathode material, respectively (Fig. 1-2). This kind of cell usually shows the initial voltage of 4.4 V and specific energy up to 240 Wh kg-1.[4] Even this type of LIB has been used over 20 years as a standard type, the demands on the diverse property of LIB, especially the working potential, is often neglected. However, in the viewpoint of the applied device, finely tuned working potential is also an
3
important requisite for the efficient usage of device (e. g. OLED).[2,3]
However, as explained, battery systems cannot always satisfy the optimized potentials of every device because the output potential of batteries is always fixed. Therefore, the tunability of operating potential of battery systems at the material level is highly desirable. However, strategies for adjusting the electrochemical properties of certain electrode materials have rarely been reported due to the general assumption that the intrinsic thermodynamic property of these materials cannot be easily adjusted.
1.1.3 Development of high power and energy density LIBs
As power and energy density usually trade-off each other in electrode materials of LIBs, it is important to balance those two properties depending on its usage. For example, high power density would be more important in case of EVs for fast recharge, and high energy density in case of EESs for larger capability of electric energy storage. In case of power density, various strategies have been tried, such as introducing conducting agent with ever higher electric conductivity,[5] nano-sized electrode material synthesis for reduced bulk Li+ pathway[6] or nano-arrayed electrode structure.[7]
Meanwhile, developing or discovering new-type electrode material or system are the main strategies for high energy density LIBs. The electrode materials with distinctively high energy density are usually store lithium ion via alloying reaction, which contains silicon anode (4,200 mAh g-1),[8] tin anode
4
(994 mAh g-1)[9] and sulfur cathode (1,675 mAh g-1).[10] In addition, discovering new energy storage system such as lithium oxygen battery (LOB) gives another opportunity to develop lithium secondary battery with extremely high theoretical energy density (3,458 Wh kg-1), which is more than 10 times higher than conventional LIBs composed of graphite and LCO.[11]
Even these strategies for the next-generation LIBs have been made great progress in research fields, it is still challenging for their commercialization because of the unpredicted failure mechanisms for these types of materials or system. More specific, in case of designing nano-sized electrode material, their inhomogeneity with conducting agent and binder is most serious problem. In addition, nano-arrayed electrode is far from commercial viability because of its difficulty in mass production and high cost. Also, the alloying anodes and cathodes usually include fragmentations result from high volumetric changes, which seriously worsen the cyclability of the cell. These challenging points suggests that a new strategy would be required for the development of high energy and power density material.
5
Fig. 1-1 Ragone plot of various types of electric energy storage systems.
Adapted from B. Ji et al.[1]
6
Fig. 1-2 Simplified diagram of commonly used LIB composed of LiCoO2 as cathode and graphite as anode material. Adapted from J. B. Goodenough et al.
[4]
7
1.2 Development of inorganic-based, potential-tunable anode material
MLi2Ti6O14(MLTO) anode materials have unique characteristics. They are composed of the same TiO6framework, and various species of M atoms (M = 2Na, Sr, Ba, Pb etc.) can be adopted in M position. Most importantly, their electrochemical properties vary depending on the M species, which is complementary to each other. Previous studies dealing with the characterization of MLTOs revealed that the structures of all MLTOs are built upon the same edge- and corner-sharing TiO2 octahedral structure.[12-15]
This suggests that it would be possible to prepare MLTOs by mixing different M species for electrode material with various electrochemical properties.
The working potentials of titanate-based compounds are determined by the redox energy of Ti3+/Ti4+ coupling reaction with Li+ ion.[16] Because the electronic structure of a Ti atom is affected by its interaction with adjacent atoms, its internal energy is dependent on the composition of the neighboring atom species and their relative positions. Therefore, the hypothesis that the operating potential of a MLTO can be tuned by M atoms, by their species and stoichiometry could be established. In addition, it has been reported that an additional lithium insertion site is available in certain M species. Due to these unique characteristics of MLTO, a variety of operating potential and
8
gravimetric capacity can be obtained by controlling the stoichiometry of the M atoms in MLTO preparations.
1.3 Transition metal-free graphene-based organic electrode materials
The exploitation of Li electrochemistry has resulted in great progress in the field of electric energy storage system (EES), and large-scale electric devices (electric vehicles and grid-energy storage systems) are now operated using LIBs. Despite the advantageous power and energy density of LIBs over other kinds of EES, the increasing demand for ever-higher levels of performance drives the continuous development of advanced electrode materials for LIBs.
Current LIBs are mainly composed of two types of materials for electrodes:
graphite for anode and inorganic crystals containing transition metals (TM), such as LiCoO2, LiMnO2, or LiFePO4Among these, the TM-based electrodes feature greater levels of energy density and cyclic stability, which has attracted intensive research on this electrode material.[17-32] However, most TM-based materials have the disadvantageous aspect of gravimetric capacity due to high atomic mass. In addition, detrimental effects on eco-systems and low cost-effectiveness have increased concerns about the use of TM- containing materials.[33-35] Consequently, the development of a TM-free
9
electrode material is highly anticipated for a variety of aspects.
Graphene has been investigated for use as a TM-free electrode material due to its high capacity.[36-56] Although the theoretical capacity of graphene as LIB anodes is usually calculated as high as 744 mAh g-1, which is simply double the value of graphite, many studies have reported that more than 1,000 mAh g-1can be achieved via the chemical modification of graphene. The most widely used method for improving the electrochemical activity of graphene involves heteroatom doping with compounds such as nitrogen, boron, and sulfur.[36-39] However, the doping processes usually require high reaction temperatures of approximately 800 °C that demands a high use of energy at great cost. Recently, several studies showed that graphene materials can be functionalized under mild conditions (<100 °C) using simple synthetic methods (e.g. thiolation, acylation, and Grignard reaction) that are common in the field of organic chemistry.[57-59] Therefore, the adoption of such synthetic methods could be useful for the construction of high-performance graphene-based electrode material at a lower production cost. Recent important researches on the simple organic molecules as LIB electrode material has provided great potential for their synergism with functionalized graphene.[60-63]
10
1.4 Objectives
In the chapter 2, synthesis of MLTOs with two co-existing M species for use as anode materials in LIBs will be discussed, and tuning of the electrochemical properties of the material by combining different kind of M atoms with different stoichiometry. Recent studies have focused on MLTO with single M species and tried to improve their electrochemical performance.[64-69] However, using MLTOs with analogous structures, gradual modulation of the internal energy is possible by controlling the composition of M atoms, which results in the quantitative control of the operating potential. To prove our concept, we used sodium, strontium- coexisting MLTO (Na2-2xSrxLi2Ti6O14, NSLTO) to control the operating potential by varying the ratio of sodium and strontium. The potential plateau changed from 1.25 V to 1.4 V and the equivalent amounts of reversible lithium ion change from 2.0 to 2.5 Li equiv.-1 when the amount of Sr in the NSLTO was increased. Changing the electrochemical properties by adjusting the stoichiometry of the M element in MLTO is a distinctive phenomenon that has not been previously reported. Tuning of the operating potential is important to devices which have dramatic efficiency change depending on applied voltage. For example, the current efficiency of an OLED dramatically changes with the applied voltage.[70,71] The energy which is not converted to
11
emitted light is wasted on other forms of energy. Therefore, a tunable operating potential would be highly desirable in terms of improving the lifespan of such devices.
In the chapter 3, graphene sulfide framework (GSF) with graphene sheets connected by disulfide bridges that can act as a TM-free and high- performance anode material for LIBs will be discussed. We adopted functionalized graphene and organic compounds to serve as building blocks for a GSF. An understanding of the structure-property relationships of the GSF is necessary to achieve the optimized electrochemical performance of a GSF. The gap between graphene layers should be emphasized, as it determines Li ion mobility inside the material and the amount of surface area available for Li adsorption. The introduction of organic compounds for bridging the gap between graphene sheets enables one to control the inter- sheet distance and prevent the undesired restacking of individual sheets. Two essential design criteria include the presence of structural diversity and the existence of functional groups located at both ends of the organic linkers.
Those functional groups are supposed to be responsible for the potential- sensitive redox reaction of Li, which affects the voltage profile during Li incorporation/extraction into/from synthesized material. To investigate the effects of the structure of a linker component on electrochemical performance, 1,2-ethanedithiol (EDT), 1,4-benzenedithiol (BDT), biphenyl-4,4’-dithiol (BPDT), and p-terphenyl-4,4’’-dithiol (TPDT) were used as functional
12
organic linkers in the GSF. The synthesized GSFs showed distinctive electrochemical performance, which depends on linkers that feature reversible cleavage/formation of disulfide bonds upon lithiation/delithiation.[72,73] The optimized GSF exhibited a specific capacity of more than 1,000 mAh g-1 and stable cyclability during 100 charge-discharge cycles.
13
Chapter 2. Tuning the Li
+storing properties in MLi
2Ti
6O
14(M= 2 Na or Sr) via stoichiometric modulation of M species.
2.1 Experimental
2.1.1. Synthesis of Na2-2xSrxLi2Ti6O14
All chemical reagents used for sample preparation were of analytical grade.
All of the Na2-2xSrxLi2Ti6O14(NaSrLTOs) with different stoichiometric ratios were prepared with CH3CO2Na∙3H2O (Sodium Acetate Trihydrate, Junsei Chemical Co., Ltd.), (CH3CO2)2Sr∙0.5H2O (Strontium acetate hemihydrate, 98%, Alfa Aesar), CH3CO2Li∙2H2O (Lithium acetate dihydrate, Kanto Chemical Co., Inc.), TiO2 (Aeroxide® TiO2 p25, EVONIK) with an appropriate amount for achieving a molar balance of each material, and oxalic acid (dehydrate, 99%, Sigma-Aldrich) as a chelating agent (CH3CO2Na : (CH3CO2)2Sr : CH3CO2Li : TiO2 : oxalic acid = 2-2x : x : 2 : 6: 2, x=0, 0.25, 0.5, 0.75, 1). The mixture of precursors was finely ground in an agate mortar with few drops of deionized water to produce a homogeneous white slurry.
The resulting sample was dried at 60 oC for 12 hours and ground finely to obtain a white powder. The powder was calcined in an air muffle furnace, first at 700 oC for 3 hours to remove organic residues in the precursors, and then at
14
1000 oC for 24 hours to obtain final Na2-2xSrxLi2Ti6O14sample.
2.1.2 Characterization
The X-ray diffraction (XRD) patterns were measured in the range of 10-80o with a scan speed of 10o min-1 by using an X-ray diffractometer (Rigaku, D/Max2500/PC) using Cu Kα radiation, operating at 50 kV and 100 mA.
Elemental analysis is performed with inductively coupled plasma (ICP) mass spectrometer (Thermo Scientific, Finnigan Element 2). The surface morphologies of the samples were characterized by scanning electron microscopy (SEM, Carl Zeiss, SUPRA 55VP).
2.1.3 Electrochemical Test
Electrochemical properties were measured with CR2032 type coin-cells at room temperature. Electrodes were fabricated with 80 wt% of active material, 10 wt% Super P as a conductive agent, and 10 wt% of poly(vinylidene difluoride) (PVdF) as a binder. These three components were mixed in N- methyl-2-pyrrolidone (NMP) for 1 hour to produce a grey-colored slurry. A uniform layer of the slurry was applied to the copper foil with a doctor-blade.
The fabricated electrodes were dried at 120 oC for 12 hours under a vacuum.
After drying, each electrodes were roll-pressed and cut into circular shape for coin-cell component. The electrodes were assembled into coin-type cell in Ar- filled glove box vs. 0.75 mm lithium metal (Alfar Aesar, 99.9 %). Porous
15
polypropylene film was employed as a separator and 1.15 M LiPF6 in EC:EMC:DMC = 2:4:4 for electrolyte. The Galvanostatic charge/discharge test was performed with multichannel automatic battery cycler (WonATech, WBCS3000).
2.1.4 Density Functional Theory (DFT) calculations
Periodic density functional theory (DFT) calculations were conducted by the Vienna ab initio simulation package (VASP). The Perdew-Burke- Ernzerhof (PBE) exchange-correlation functional was used for generalized gradient approximation (GGA).[74,75] Ionic cores were calculated by the projector augmented wave (PAW) method.[76] The energy cutoff of the wave functions was set as 400 eV and Monkhorst-Pack k-point mesh for the sampling of brillioun zone was 1 × 1 × 1. Convergence of the forces on all atoms was set as 0.03 eV/Å for all calculations and the convergence of the electronic optimization steps was 0.0002 eV.
The supercell of Na2-2xSrxLi2Ti6O14was consist of 16 Li atoms, 48 Ti atoms, 112 O atoms, 8(2-2x) Na atoms and 8x Sr atoms (x=0, 0.25, 0.5, 0.75 and 1).
The lattice parameters were a = 16.821 Å, b=11.45 Å and c = 11.693 Å with α
= β = γ = 90º. Onsite coulomb interactions of localized d-orbital or Ti was calculated with Ueff= 3.5 by DFT+U within Dudarev’s approach.[77] This U value was used to calculate the oxygen vacancy of TiO2,[77] and O2
16
adsorption on TiO2.[78] This U value was used to calculate the surface reactivity derived by the oxygen vacancy of anatase TiO2,[77] and the stability of the peroxide species caused by the electron transfer of the adsorbed O2on anatase TiO2.[78]
The formation energy of Na2-2xSrxLi2Ti6O14 from pure Na2Li2Ti6O14 and SrLi2Ti6O14was defined by
= − (1 − ) −
Where is the formation energy of NaSrLTO and , and are total energy of NaSrLTO, NaLTO and SrLTO, respectively.
2. 2 Results and Discussion
2.2.1 Materials Characterization
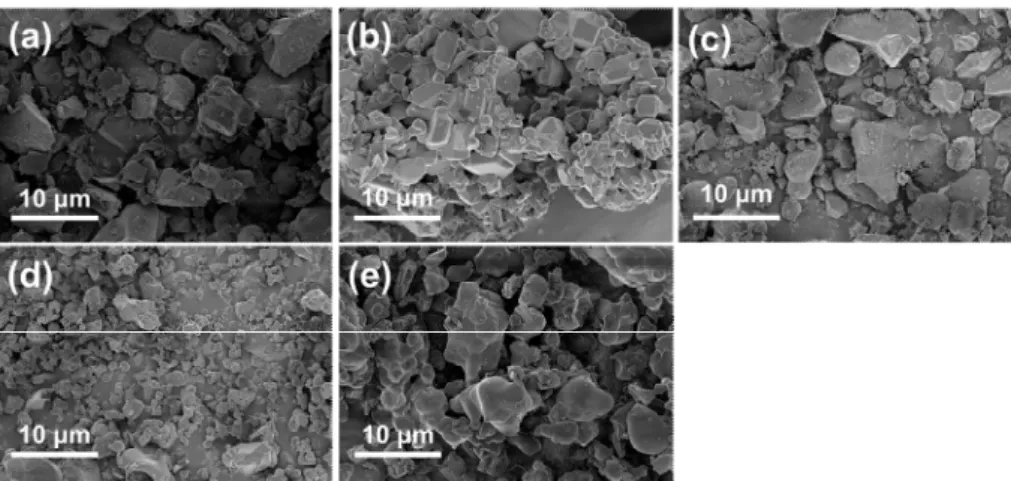
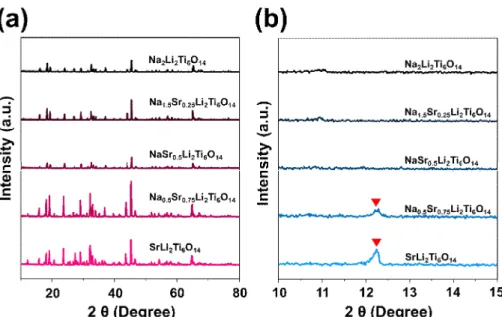
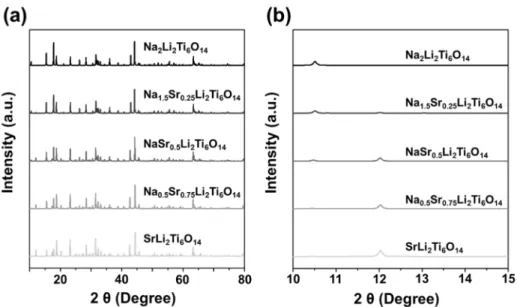
The surface morphologies of NaSrLTOs were investigated by scanning electron microscopy (Fig. 2-1). The sizes of the NaSrLTOs are 1 – 10 μm, which is larger than starting p 25 particle due to the sintering during heat- treatment. Fig. 2-2 shows XRD patterns of the NaSrLTOs. For all of the prepared samples, neither a precursor nor an impurity peak was observed, which means the temperature of solid-state reaction is appropriate for each sample. The patterns of Na2Li2Ti6O14(NaLTO) and SrLi2Ti6O14 (SrLTO) are
17
well matched with previously reported findings for MLTOs.[12,14,15] These two samples show the same pattern in intense peaks due to the fact that NaLTO and SrLTO have analogous crystal structures. The differences in minor peaks can be attributed to differences in the stoichiometry of sodium and strontium atoms in the MLTO, in which two sodium atoms occupy an 11- fold-coordinated site, while only one strontium atom could exists at the site.
In the case of samples that contain both Na, Sr, the positions of the major peaks with NaLTO and SrLTO are the same, despite the presence of minor peaks corresponding to SrLTO, which gradually appear with increasing Sr content (Fig. 2-2(b)). We also found that these experimental XRD patterns are in good agreement with simulated patterns (Fig. 2-3). It can be concluded in the XRD analyses that, in spite of minor differences in the lattice structure between NaLTO and SrLTO, NaSrLTOs are able to form stable, well- crystallized structures.
2.2.2 Formation energy calculation of NaSrLTO via DFT
Density Functional Theory (DFT) calculations were conducted to verify the formation of stable NaSrLTO samples (Table 2-1). The feasibility of alloying two materials can be generally obtained by a comparison between the energy of Na, Sr-coexisting MLTOs and two pure NaLTO and SrLTO materials. Therefore, the formation energy of NaSrLTO represents a potential parameter that is indicative of the stability of the synthesized material. A
18
negative value of the formation energy indicates that a Na, Sr-mixed form is more stable than any of the separated phases. The results show that all of the formation energies of the NaSrLTOs have negative values. Therefore, it is clear that the synthesis of NaSrLTO with single crystallinity is thermodynamically reasonable.
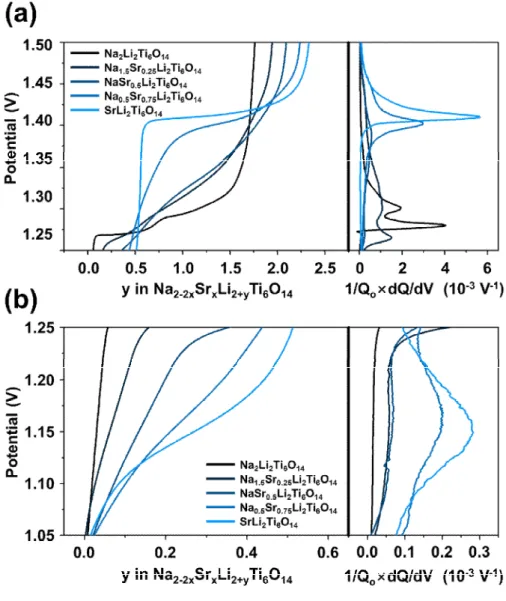
2.2.3 Electrochemical Characterizations
Galvanostatic charge/discharge results of samples with current densities of 10, 50, 100, 500 and 1000 mA g-1at a potential window of 1.0 – 3.0 V are shown on Fig. 2-4. The equivalent amount of lithium ions reversibly inserted into NaLTO is 2 Li equiv.-1and a potential plateau at 1.25 V at 10 mA g-1, where SrLTO of 2.5 Li equiv.-1, at 1.4 V and additional sloped plateau between 1.1 – 1.2 V. It is noteworthy that, by increasing the Sr content in the NaSrLTO sample, the working potential gradually moves upward, and insertable lithium ions increase linearly. (Fig. 2-4(a)). Aspects of the structural differences of NaLTO and SrLTO with lithium insertion sites are discussed below.
Differential capacity analyses of charge curve were conducted for a detailed investigation in the shift of the potential plateau of NaSrLTO samples (Fig. 2-5). The peak for the oxidation potential for NaLTO appeared at 1.27 V.
Whereas, the peak potential of SrLTO is located mainly at 1.42 V, and additional minor peak at 1.15 V, which corresponds to two distinctive voltage
19
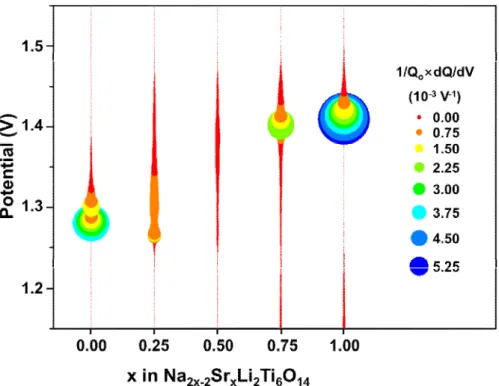
plateaus in SrLTO. The peak intensities tend to decrease as the degree of coexisting sodium and strontium increases in the samples. This is due to the distortion of the crystal structure originating from the different lattice constants of NaLTO and SrLTO, which results in a decrease in the sensitivity of the potential. Nevertheless, it is obvious that all oxidizing peaks of the samples are gradually shifted to a higher potential. In addition, the shoulder peak, which corresponds to SrLTO at 1.15 V, gradually fades out as the content of strontium decreases. Fig. 2-6 shows a collective plot showing the peak position for each sample and its intensity. The larger circle indicates a higher peak intensity. It should also be noted that a gradual shift in the peak potential from NaLTO to SrLTO is evident.
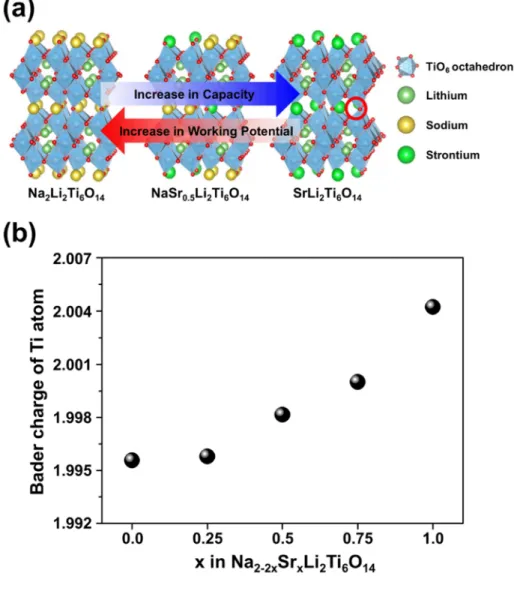
2.2.4 Bader charge calculation of Ti atoms in NaSrLTO via DFT
The origin of the change of voltage and reversible lithium of the samples is due to the atomic structure of the MLTO. Fig. 2-7(a) shows the octahedral TiO6 frameworks of the NaSrLTOs. Lithium ions are located on tetrahedral sites of void tunnels and M atoms fill the 8f Wyckoff positions. In NaLTO, the 8f Wyckoff position is fully occupied by two sodium atoms, and in SrLTO, it is half occupied by one strontium atom. Due to the similarity of the structure between the NaLTO and SrLTO, 2 equivalent of sodium atoms and 1 equivalent of a strontium atom can substitute for each other, as evidenced by the inductively coupled plasma (ICP) analysis (Table 2-2). By
20
gradually substituting sodium atoms with strontium atoms, the operating potential gradually increases from 1.25 V (operating potential of NaLTO) to 1.4 V (operating potential of SrLTO) because the energy of the Ti3+/Ti4+redox reaction, which is affected by adjacent M atoms, also gradually changes. Fig.
2-7(b) provides clear evidence for the change in the energy of Ti atoms. The Bader charge of a Ti atom gradually increases with increasing Sr ratio.
Because the property of Ti atoms adopts more ionic characteristics, the interaction between the inserted Li and active materials becomes stronger.14 Therefore, the operating potential of NaSrLTO increases with increasing Sr/Na ratio. NaLTO can host two Li ions per molecular weight at the 4a, 4b, 8c positions of the structure. Comparing with NaLTO, SrLTO has additional empty space in the 8f Wyckoff position, which is available for lithium insertion. Regarding this characteristics of the NaSrLTO structure, the red- circled position of the Fig. 2-7(a) on SrLTO corresponds to one unit of substitution. Due to the extra position for lithium insertion, SrLTO is able to store more lithium than NaLTO but shows 2 different potential plateaus.
21
Fig. 2-1SEM images of Na2-2xSrxLi2Ti6O14: (a) x=0.0, (b) x=0.25, (c) x=0.5, (d) x=0.75 and (e) x=1.0.
22
Fig. 2-2XRD patterns of the Na2-2xSrxLi2Ti6O14samples, (a) plotted from 10º to 80º and (b) magnified plot of Fig. 2-2(a) from 10º to 15º. The red arrows on (b) indicate (111) plane of SrLi2Ti6O14.
23
Fig. 2-3Simulated XRD patterns of the Na2-2xSrxLi2Ti6O14 samples, (a) plotted from 10oto 80oand (b) magnified plot of Fig. 2-3(a) from 10oto 15o.
24
Table 2-1. Calculated binding energy and formation energy of reaction (1- x)Na2Li2Ti6O14+ xSrLi2Ti6O14 → Na2-2xSrxLi2Ti6O14(x=0, 0.25, 0.5, 0.75, 1) by density functional theory.
Total Energy (eV)
Formation Energy (ΔG, kJ mol-1)
Na2Li2Ti6O14 -1.21 × 10³ 0.00
Na1.5Sr0.25Li2Ti6O14 -1.21 × 10³ -16.2
NaSr0.5Li2Ti6O14 -1.19 × 10³ -19.9
Na0.5Sr0.75Li2Ti6O14 -1.15 × 10³ -7.25
SrLi2Ti6O14 -1.12 × 10³ 0.00
25
Fig. 2-4 Galvanostatic charge/discharge curves of Na2-2xSrxLi2Ti6O14: (a) x=0.0, (b) x=0.25, (c) x=0.5, (d) x=0.75 and (e) x=1.0. The green dashed lines indicate potential plateau regions of the samples.
26
Fig. 2-5 Galvanostatic charge profiles (left) and their corresponding differential capacity data (right) of Na2-2xSrxLi2Ti6O14 samples: plotted at (a) 1.25 – 1.50 V and (b) 1.05 – 1.25 V.
27
Fig. 2-6 Diagram of peak positions and its intensity of differential capacity plotted versus x of Na2-2xSrxLi2Ti6O14.
28
Fig. 2-7 (a) Crystal structures of Na2Li2Ti6O14, NaSr0.5Li2Ti6O14 and SrLi2Ti6O14 and (b) calculated Bader charge of titanium atom of different Na/Sr ratio of NaSrLTOs.
29
Table 2-2.Actual stoichiometry of synthesized NaSrLTOs with various Na/Sr ratios determined by inductively coupled plasma (ICP) analysis.
Sr/Na ratio Stoichiometry
Na2Li2Ti6O14 ∞ Na2Li2Ti6O14
Na1.5Sr0.25Li2Ti6O14 5.44 Na1.46Sr0.27Li2Ti6O14
NaSr0.5Li2Ti6O14 1.75 Na0.93Sr0.53Li2Ti6O14 Na0.5Sr0.75Li2Ti6O14 0.55 Na0.43Sr0.78Li2Ti6O14
SrLi2Ti6O14 0 SrLi2Ti6O14
30
Chapter 3. Graphene Sulfide Framework (GSF) for the transition metal-free and high performance anode material
3. 1 Experimental
3.1.1 Synthesis Method of GSF
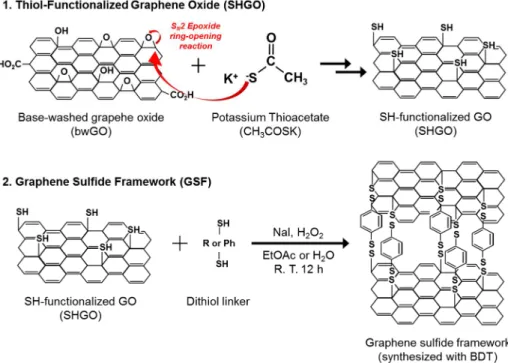
Graphene oxide (GO) was synthesized using the improved Hummer’s method reported by Marcano et al.[79] The pre-treatment of GO with a base solution and the synthesis of thiol-functionalized graphene oxide (SHGO) were in reference to procedures reported by Thomas et al.[80]
500 mg GO was dispersed in 500 ml deionized water by sonication for 30 min. Then the solution was stirred gently and 10 ml of a 1.25 M NaOH solution was slowly added until a dark brown color had formed. The solution was further stirred at 70 °C for 1 h. The NaOH-treated GO was collected by centrifuge at 12,500 rpm for 30 min. After washing with deionized water, the samples were re-dispersed in 500 ml of a 0.05 M HCl solution for reprotonation, and stirred at 70 °C for 1 h. After centrifuge and washing by the same procedure, the resultant sample was dried under 0.1 Torr vacuum at 60 °C for 12 h. The obtained base-washed GO (bwGO) sample was collected and grinded in agate mortar.
200 mg of bwGO in 50 ml DMSO solution was sonicated for 1 h. The
31
dispersed solution was sealed and then moved into an Ar-filled glove box.
After adding 20 mg of potassium thioacetate (CH3COSK), the solution was tightly sealed and reacted at 50 °C for 5.5 h. After cooling to room temperature, 10 ml of a 1 M HCl solution was added and then centrifuged at 12,500 rpm for 30 min. The sample was washed according to the following procedure: acetone (20 min, 3 times), diethyl ether (10 min, 2 times) and deionized water (2 h, 3 times). The SHGO was finally obtained after drying the sample under 0.1 Torr vacuum at RT.
The disulfide bond formation method reported by M. Kirihara et al. was adopted.[81] First, 100 mg of SHGO was dispersed in 30 ml ethyl acetate (CH3CO2C2H5, EtOAc). After dispersed by intensive sonification (duty cycle:
50 %, output: 60 W) for 10 min, the solution was cooled at room temperature.
The amounts of added linker molecules were calculated as follows: 20.5, 31.5, 42.4, and 13.6 mg of BDT, BPDT, TPDT and EDT, respectively. After a linker was added, the SHGO/linker mixed solution was stirred for 10 min.
After adding 3 mg sodium iodide (NaI) with stirring for 10 min, 0.22 ml of 30%
H2O2 was added, and stirred for 24 h at room temperature. The synthesized sample was membrane-filtered and washed with 10 ml EtOAc, 20 ml ethanol, and 10 ml acetone. After drying under 0.1 Torr vacuum at 60 °C for 12 h, the resultant GSF samples were obtained. A schematic diagram of the synthetic procedures for SHGO and GSF is shown in Fig. 3-1.
32 3.1.2 Characterizations
The gap distances of the GSFs were analyzed via Cs-corrected Transmission electron microscopy (Cs-TEM, JEM-ARM200F). Also, field- emission scanning electron microscopy (FESEM, AUGIRA) was used to analyze the surface morphology. To analyze the elemental components and chemical states of the samples, X-ray photoelectron spectroscopy (XPS, Sigma Probe, Thermo) was performed. An X-ray diffractometer (XRD, Rigaku, D/max-2200, Cu Кα1 radiation) was used to investigate the diffraction patterns of the synthesized samples. BET surface areas were measured using a Micrometrics ASAP 2010 instrument.
3.1.3 Electrochemical Measurements
All of the electrodes for the electrochemical performance measurement were fabricated by mixing active material:Super P:poly(vinylidene difluoride) (PVdF, Sigma-Aldrich) in an 8:1:1 weight ratio. The mixed components were dispersed homogeneously in a few drops of N-methyl-2-pyrrolidone (NMP) in an agate mortar. The dark-greyish slurry mixtures were uniformly casted onto Cu foils with doctor blade and dried under 0.1 Torr vacuum at 60 °C for 12 h.
Then the electrodes were roll-pressed, cut into 1 cm2 round discs, and assembled into a button-type coin cell (CR2032). Li foil (0.75 mm thickness, Alfa Aesar) and 1.15 M LiPF6 in a 2:4:4 volumetric ratio of ethyl carbonate/ethyl-methyl carbonate/dimethyl carbonate solution were used as
33
counter electrode and electrolyte, respectively. Galvanostatic charge/discharge properties were characterized with multichannel battery cycling equipment (WBCS3000, WonATech). Electrochemical impedance spectroscopy (EIS) was conducted using potentiostat equipment (ZIVE SP2, WonATech). The electrochemical parameters of the equivalent circuit were obtained using ZMAN software.
3. 2 Results and Discussion
3.2.1 Materials Characterizations
Fig. 3-2 shows a graphical image of the GSFs with different linkers along with their TEM and SEM images. As a control sample, a GSF without a linker was also prepared for comparison, and is referred to as SSGO. As shown in the TEM images, the gaps between the graphene layers became wider as longer linker molecules were incorporated in the GSFs (SSGO = 0.37 nm, GSF/EDT = 0.42 nm, GSF/BDT = 0.45 nm, GSF/BPDT = 0.49 nm, GSF/TPDT = 0.52 nm). The observed gap distance values of the GSFs showed differences in the molecular length of the adopted linkers. The bonding angle of -S-S- was 103°, so the linkers were attached between graphene layers in an inclined configuration, rather than in a straight-standing form. In SEM analysis, all of the samples showed highly porous morphologies, which means that restacking between graphene sheets was prevented during
34 the synthesis processes for all samples.
Fig. 3-3 shows the XRD patterns of the GSFs. The main peak positions of SSGO, GSF/EDT, GSF/BDT, GSF/BPDT, and GSF/TPDT appeared at 23.7, 22.0, 21.3, 20.8, and 19.5°, respectively. These results correlated well with TEM analysis showing that the gap distances widened as longer linkers were used. The diffraction patterns at 23.7° corresponded to GSF/BPDT and GSF/TPDT because of the partial nature of the disulfide bond formation between SHGOs when there was no insertion of either linkers or unreacted thiols. As described above, the main diffraction peak of SSGO was observed at 23.7o. However, this unspecific formation of a disulfide bond was observed neither in GSF/EDT nor in GSF/BDT. Diffraction patterns of other intermediate materials such as graphite, GO, bwGO, and SHGO are also shown in Fig. 3-4.
XPS analysis was used to observe the chemical state of carbon and sulfur before and after the disulfide formation reaction. Fig. 3-5(a), (b), and (c) show the C1s spectra of SHGO, SSGO and GSF/BDT, respectively. Each of the deconvoluted peaks in these spectra represent commonly known functional groups on GO such as C-C bonds (284.2 eV), hydroxyls (285.4 eV), carbonyls (286.8 eV), and esters (288.7 eV). The C1s spectra of SHGO and SSGO show no remarkable difference in either peak position or intensity, which means that disulfide bond formation had a negligible effect on the chemical state of the carbon-containing functional groups on SHGO. In
35
GSF/BDT, however, a higher peak intensity of C-C was observed compared with that of the other two materials, which was due to the incorporation of aromatic ring-containing linker molecules. Fig. 3-5(d), (e) and (f) are the results of the S2p analyses of SHGO, SSGO and GSF/BDT, respectively. To distinguish the peaks corresponding to -SH (163.1 and 164.3 eV) and -S-S- (162.1 and 163.0 eV), normalized S2p peaks of these 3 materials from 161 to 166 eV are compared in Fig. 3-6. A slight shift in the peak positions of SSGO and GSF/BDT to a lower binding energy verified that even -SH was dominant from among all three materials, and that a disulfide bond was partially formed in SSGO and even more so in GSF/BDT. Therefore, the peak deconvolution was proceeded based on this observation. The results of S2p analysis were also used to quantify the sulfur content in SHGO. The atomic ratio of sulfur in SHGO was calculated as 4.2%. Based on this value, we determined the amount of linkers required for the construction of GSFs in order to acquire a molar ratio of 1:1 for the thiol groups in SHGO and linkers.
3.2.2 Electrochemical Performance Evaluation
To evaluate the Li storage performances of the synthesized samples, half- cell Galvanostatic charge/discharge tests were carried out using Li metal as an anode. Fig. 3-7(a) shows the first cycle charge/discharge profiles of samples at a current density of 0.05 A g-1, and a potential window from 0.01 V to 3.0 V. Discharge capacities of 703, 1055, 778, 725, and 892 mAh g-1 during the
36
first cycle were recorded for SSGO, GSF/BDT, GSF/BPDT, GSF/TPDT, and GSF/EDT, respectively. All samples showed analogous profiles and a sloped potential plateau below 1.0 V during charge and discharge. The electrochemical behavior of disulfide bonds with Li ions have been well established in previous reports, and the overpotential between oxidation and reduction is relatively high (~1.6 V) due to the low reaction kinetics.[82]
Considering this effect, the discharge plateau that appeared at 1.0 V was due to the lithium-sulfur bond formation. The redox behavior of disulfide was observed in differential analysis (Fig. 5(a) and (b)). In the first cycle, all samples showed a low level of Coulombic efficiency (52.8 ~ 68.8 %). The ex- situ XPS revealed that the formation of Li2CO3, with a main component composed of a solid electrolyte interphase (SEI), on the GSFs during charge/discharge cycles (Fig. 3-8). Therefore, a high irreversible capacity among all materials during the first cycle was due to the formation of SEI.
After the first cycle, the highly reversible nature of lithiation and delithiation was maintained. The charge/discharge profiles of samples at various current densities are presented in Fig. 3-9, and the initial charge/discharge profiles and rate capability of graphite, bwGO, and SHGO are shown in Fig. 3-10.
Charge/discharge test was performed at various current densities to evaluate the rate capability of the GSFs (Fig. 3-7(b)). The GSFs with long linkers, GSF/BPDT and GSF/TPDT, showed a relatively lower capacity in all ranges of current rates due to the higher amount of electrochemically inactive
37
weight of the aromatic rings in the linker molecules. At relatively low current densities, 0.05 and 0.1 A g-1, GSF/BDT showed the highest specific capacity, followed by GSF/EDT, GSF/BPDT, GSF/TPDT, and SSGO. As current density increased by more than 0.25 A g-1, however, the specific capacity of GSF/EDT began to overtake that of GSF/BDT. Also, GSF/BPDT and GSF/TPDT showed values that were even lower than those of SSGO. Details of these results will be discussed later.
Fig. 3-7(c) indicates the long cyclic stability of the SSGO and GSFs. The cells were first cycled at 0.05 A g-1for 2 cycles to promote stabilization, and were then cycled repeatedly at 0.25 A g-1. After 100 cycles, GSF/BDT, GSF/BPDT, and GSF/TPDT retained 78.1, 74.0, and 75.8% of their initial capacities, respectively. However, the reversible capacity of GSF/EDT was quickly degraded in the first 10 cycles, which could be attributed to the innate structural instability of EDT compared with other linkers containing aromatic rings.
3.2.3 Li+storage mechanism analysis of GSFs
As described above, the rate performances differed among the GSFs depending on current density, particularly between GSF/BDT and GSF/EDT.
To clarify the Li storage mechanisms that depended on current rates, N2
adsorption and desorption analyses were first carried out to measure the BET surface area (Table 3-1). There were no remarkable differences in the surface
38
areas between the GSFs, and it could be assumed that the discrepancies in the Li storage performances of GSFs were not significantly affected by the differences in surface areas. Note that no morphological differences were found among the materials, as discussed in SEM analysis (Fig. 3-2). Fig. 3- 11(a) and (b) represent differential capacities during delithiation at 0.05 A g-1 and 0.25 A g-1, respectively. At 0.05 A g-1, cathodic peaks corresponding to disulfide bond formations (-SLi + LiS- → -S-S- + 2Li+) were observed, while the peaks were significantly attenuated at 0.25 A g-1. We speculated that a threshold of current density exists between 0.05 and 0.25 A g-1, which could be related to the accessibility of Li ions toward the interior of GSF structures when thiol redox moieties are present.
To obtain more evidence on linker-dependent Li storage mechanisms, we performed XPS analyses with 4 types of GSF/BDT which include the electrodes charged and discharged at low (0.05 A g-1) and high (0.25 A g-1) current densities. Fig. 3-12 shows the S2p spectra of the prepared electrodes.
Even at a low signal-to-noise ratio, we were able to find the signal corresponding to an S-Li bond (near 160 eV) from the electrode that was discharged at 0.05 A g-1(Note that the low signal-to-noise ratio of XPS data is due to the low atomic concentration of sulfur in GSF). However, there were no noticeable signals in other samples. The XPS data indicates that the formation of S-Li bonds by Li oxidation occurred only within the electrode discharged at low current density. Considering that disulfide bridges exist
39
between the graphene layers in GSFs, this result supports the idea that Li diffusions through interstitial graphene layers and subsequent redox reactions are prominent at low current density. This phenomena is also well-correlated with the previous reports on graphene anode materials for LIBs, whereby the Li storage mechanism of graphene varies depending on the current density.
[48,49]
Electrochemical impedance spectroscopy (EIS) analyses were carried out to analyze the detailed resistive factors in the GSF structures. Fig. 3-11(c) and (d) represent the acquired Nyquist plots of SSGO and GSFs, respectively, for application of the equivalent electrochemical circuit model. The simulated parameters are shown in Table 3-2, where Re is the equivalent series resistance, Ric is the charge transfer resistance between intercrystallites.
Because the electrochemically active part in GSF is graphene layers, Ric is assigned as charge transfer resistance between graphene sheets across the linker molecules. Rct is the charge transfer resistance between an electrode and its active material, and Awis the Warburg coefficient which represents the mass transfer resistance, which is defined as follows:
A
w=
√
where R is the gas constant, T is the temperature, A is the diffusion area, n is the valency, F is the Faraday constant, C is Li ion concentration, D is the diffusion coefficient of Li ion, and θ denotes the fraction of the reduced and
40 oxidized species present.
The high Ricthat is obvious in GSF/EDT could be attributable to a linker molecule without a conjugated aromatic structure. However, considerable values for Ric were also observed in GSF/BPDT and GSF/TPDT. As explained above, during the synthesis of the GSF, the slow reaction kinetics of BPDT and TPDT with SHGOs created a small population of linker pillars between the graphene layers in GSF/BPDT and GSF/TPDT. Consequently, the reduced amount of organic linker resulted in loosely packed structures for GSF/BPDT and GSF/TPDT. The Rct in GSF/BDT had the highest value among the samples. It is possible that the lower graphene content in GSF/BDT, compared with that in SSGO and other GSFs, induces distinctive surface properties (e.g. hydrophobicity, wettability). As the molecular length of the linkers increased, the Awvalues tended to decrease, however, there was a negligible difference between GSF/BDT, GSF/BPDT and GSF/TPDT. To summarize the EIS results, GSF/BDT was favorable in terms of inter-sheets charge transfer and mass transfer, whereas GSF/EDT had the most favorable level of charge transfer between active material and electrode.
Based on the differential analysis, EIS and XPS observations, multiple Li ion storage mechanisms were proposed for the GSFs (Fig. 3-13). Li adsorption on the inner and outer surfaces of graphene and redox reactions with disulfides are possible mechanisms. Both Li adsorption on the inner surface and redox reactions with disulfides should be based on the
41
precondition that the Li ions can diffuse into the graphene layers. Thus, these mechanisms can be categorized into two forms: Li insertion between layers and adsorption on the surface. At low current densities, Li insertion between layers and either the subsequent redox reaction or adsorption occupies a large portion of the overall Li storage. The lower specific capacities of GSF/BPDT and GSF/TPDT are due to the higher content of the electrochemically inactive mass within linker molecules, as discussed above (Fig. 3-5(b)). By contrast, although BDT has a higher molecular weight than EDT, the specific capacity of GSF/BDT surpasses that of GSF/EDT. As presented in the EIS analyses, GSF/EDT shows Ric and Awvalues that are higher than those of GSF/BDT, which indicates that the shorter molecular length and structural instability of EDT increases the electron/mass-transfer resistance within GSF/EDT.
Therefore, at low current density, GSF/BDT represents the optimized structure of the GSF by means of the structural stability of the aromatic linker molecules and moderate amounts of electrochemically inactive elements. The lowest specific capacity of SSGO can also be explained by the fact that, without linker molecules, it is possible to store only small amounts of Li between the graphene layers of SSGO. On the other hand, adsorption of Li ions on the outer surface of materials becomes dominant at relatively high current density. Under this condition, the amount of Li insertion between the layers decreases, and, consequently, the weights of electrochemically inactive elements determine the specific capacities of materials. Therefore, GSF/EDT
42
showed a higher value of specific capacity compared with that of GSF/BDT.
The SSGO was relatively less affected by increases in the current density, which enabled it to exhibit superior specific capacities over GSFs within a high current domain (>0.25 A g-1).
43
Fig. 3-1 Schematic illustration of the synthetic procedure for a GSF.
GSF/BDT is shown as a representative.
44
Fig. 3-2Graphic images, TEM and SEM images of (a) SSGO, (b) GSF/EDT, (c) GSF/BDT, (d) GSF/BPDT and (e) GSF/TPDT.
45
Fig. 3-3. XRD patterns of SSGO, GSF/EDT, GSF/BDT, GSF/BPDT and GSF/TPDT from 5o to 35o. Raw data are expressed as hollow dots and solid lines indicate smoothed values. Adjacent-averaging was utilized for smoothing, and the point of windows was set as 50.
46
47
Fig. 3-4. XRD patterns of intermediate materials: (a) Graphite and (b) GO, bwGO and SHGO.
48
Fig. 3-5 XPS spectra and deconvoluted peaks for C1s and S2p of (a) SHGO, (b) SSGO and (c) GSF/BDT.
49
Fig. 3-6Normalized XPS S2p peak of SHGO, SSGO and GSF/BDT from 161 to 166 eV. Red and blue arrows indicate peak shift of SSGO and GSF/BDT, respectively.
50
Fig. 3-7 Galvanostatic charge/discharge results of SSGO and GSFs: (a) 1st cycle charge/discharge profiles, (b) Specific capacities measured at various current densities from 0.05 to 5 A g-1 for 5 cycles each and (c) long term stability test.
51
52
Fig. 3-8 (a) 1st cycle Charge/discharge profile of GSF/BDT at the current density of 0.05 A g-1 and the selected potential points for ex-situ electrode analysis and (b) C1s XPS spectra obtained from disassembled electrodes.
53
Fig. 3-9 1st cycle charge/discharge profiles of (a) SSGO, (b) GSF/BDT (c) GSF/BPDT, (d) GSF/TPDT and (e) GSF/EDT at various current densities.
54
Fig. 3-101stcycle charge/discharge p