저작자표시-비영리-변경금지 2.0 대한민국 이용자는 아래의 조건을 따르는 경우에 한하여 자유롭게
l 이 저작물을 복제, 배포, 전송, 전시, 공연 및 방송할 수 있습니다. 다음과 같은 조건을 따라야 합니다:
l 귀하는, 이 저작물의 재이용이나 배포의 경우, 이 저작물에 적용된 이용허락조건 을 명확하게 나타내어야 합니다.
l 저작권자로부터 별도의 허가를 받으면 이러한 조건들은 적용되지 않습니다.
저작권법에 따른 이용자의 권리는 위의 내용에 의하여 영향을 받지 않습니다. 이것은 이용허락규약(Legal Code)을 이해하기 쉽게 요약한 것입니다.
Disclaimer
저작자표시. 귀하는 원저작자를 표시하여야 합니다.
비영리. 귀하는 이 저작물을 영리 목적으로 이용할 수 없습니다.
변경금지. 귀하는 이 저작물을 개작, 변형 또는 가공할 수 없습니다.
공학석사학위논문
Hydrogel microfluidic 3D culture of lung cancer cells mimicking cancer
microenvironment
폐암 주변 미세환경을 모사한 하이드로젤에서 마이크로플루이딕 3 차원적 폐암세포 배양
2016 년 8 월
서울대학교 공과대학원
재료공학부
윤 다 영
i
Hydrogel microfluidic 3D culture of lung cancer cells mimicking cancer
microenvironment
지도교수 안 철 희
이 논문을 공학석사 학위논문으로 제출함
2016 년 6 월
서울대학교 공과대학원
재료공학부
윤 다 영
윤 다 영의 공학석사 학위논문을 인준함 2016 년 6 월
위 원 장 선 정 윤 ○인 부위원장 안 철 희 ○인 위 원 전 호 정 ○인
ii
AB-STRACT
Hydrogel microfluidic 3D culture of lung cancer cells mimicking cancer microenvironment
Dayoung Yoon Department of Materials Science and Engineering College of Engineering Seoul National University
In vitro, lung cancer has been studied in 2D, tissue culture plate by many cancer researchers. Recently, changes of study trend in microenvironment have moved 2D to 3D. Many papers have reported differences of results in 2D culture and 3D culture. The in vitro results in 3D culture were more similar to in vivo results than those in 2D. Thus, many researchers have studied cells using hydrogels. One of the hydrogels is collagen type Ⅰ that is a most common extracellular matrix (ECM). However, the composition of ECM in each tissue is different due to the different function. Lungs are organs in respiratory system, and those have elasticity for extension and contraction. The ECM in lungs has known that collagen and elastin are the
iii
major components. Our study focused on lung microenvironment, and using microfluidic devices we demonstrated lung cancer cells in hydrogels mimicking lung ECM which are composed of collagen type Ⅰ, collagen type
Ⅲ, and elastin (CCE). These results have shown that differences of
morphologies and bioactivities in RNA levels, protein levels, and enzyme levels are remarkable. Furthermore, our studies suggest that difference of hydrogel property could affect responses of lung cancer cells.
Keywords: Extracellular matrix (ECM), microenvironment, microfluidics, bio-chip, lung cancer
Student number: 2014-22538
iv
CONTENTS
Abstract ………... i
Contents ……… iii
List of figures and tables ...………... v
1. Introduction ………... 1
2. Experiments ………..……… 3
2.1. Materials ……… 3
2.2. Fabrication of microfluidic device...…..……….. 4
2.3. Gelation of hydrogels………...6
2.4. Cell culture in 2D condition.……….. 6
2.5. Cell culture in microfluidic devices……….7
2.6. Cell proliferation assay (CCK-8)...………7
2.7. Zymography analysis of cells……….……….. 8
2.8. Western blot analysis of cells………9
2.9. RNA extraction from tissues and cDNA synthesis………10
2.10. Real-time PCR………11
2.11. Immunofluorescence staining……….……13
2.12. Live cell imaging……….……13
v
Results and Discussion ……… 15
3.1. Difference of CD44 expression of A549 cells according to the hydrogels..……….15
3.2. Proliferation analysis of A549 cells………...19
3.3. A549 cells in 3D hydrogels produce Matrix Metalloproteinases not produced in 2D culture……….21
3.4. Marked differences in RNA levels………23
3.5. Noticeable results in Protein levels………...25
3.6. Response of A549 cells in CCE gels……….27
4. Conclusions ……….. 29
5. References ……… 30
vi
List of Figures and Tables
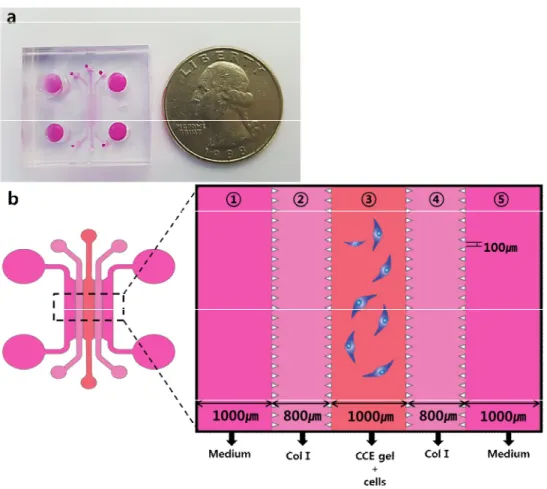
Figure 1. Schematic of the microfluidic device (a) Microfluidic device model (b) Design of microfluidic device; ①and⑤, both side channels contain medium. Collagen typeⅠis in the ②and④ channels, and ③ channel has mixed gel(CCE) and A549 cell suspension.
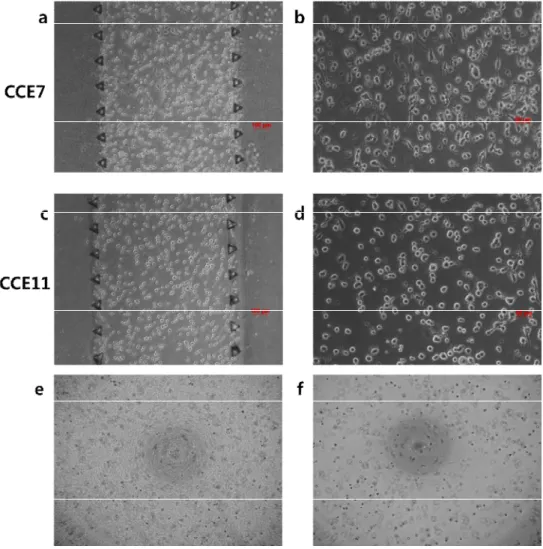
Figure 2. Figure 2. Images of A549 cell morphologies at day1 (a) In the CCE7 gel (5X) (b) In the CCE7 gel (10X) (c) In the CCE11 gel (5X) (d) In the CCE11 gel (10X) (e) morphology at day0 in CCE7 (10X) (e) morphology at day0 in CCE11 (10X)
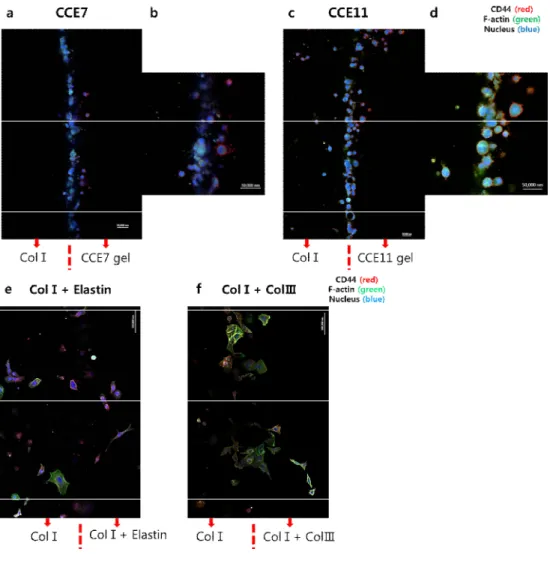
Figure 3. Immunofluorescence staining images at day3 (20X) (a) Tile scan image in the CCE7 gel (b) A part image of (a) image (c) Tile scan image in the CCE11 gel (d) A part image of (c) image (e) Tile scan image in the ColⅠ+elastin gel (f) Tile scan image in the ColⅠ+ColⅢ gel, CD44(red), F-actin(green), Nucleus(blue) (scale bar = 50,000㎚)
Figure 4. Immunofluorescence staining images at day1 (10X) (a) Only CD44(red) in the CCE7 gel (b) Merge image in the CCE7 gel (c) Only
vii
CD44(red) in the CCE11 gel (d) Merge image in the CCE11 gel, CD44(red), F-actin(green), Nucleus(blue) (scale bar = 100㎛)
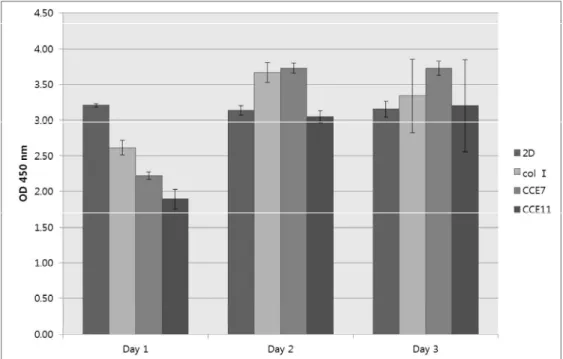
Figure 5. Results of CCK-8 for assessment of A549 cell proliferation. (OD 450㎚)
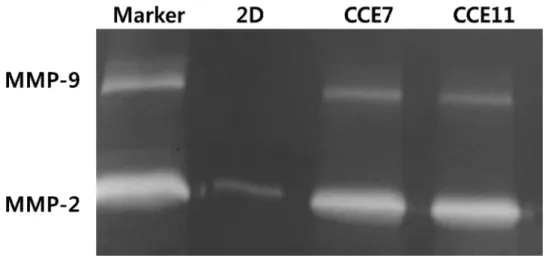
Figure 6. Results of zymography analysis
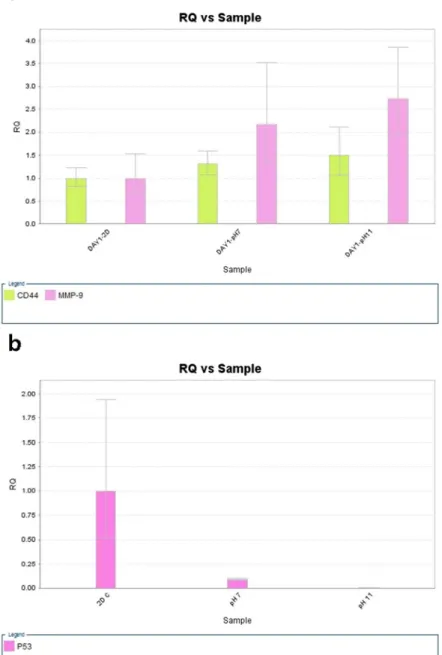
Figure 7. Results of qPCR analysis (a) comparison of CD44 and MMP-9 expression in 2D , CCE7 gel, and CCE11 gel, CD44(green bar), MMP- 9(pink bar) (b) comparison of p53 expression in 2D , CCE7 gel, and CCE11 gel, p53(pink bar)
Figure 8. Results of Western blot analysis (a) MMP-9 (Invasion/ metastasis factor) (b) P-Stat1 (cancer growth transcription factor) (c) P-AKT (cancer proliferation factor) (d) p53 (tumor suppressor factor) (e) Beta-actin, (f) elF4e, (g) Pin1 (e,f,g) are loading controls.
Figure 9. Figures were captured by live imaging. The figure on the left side was about response of A549 cells in CCE7, and the right side figure was about response of A549 cells in CCE11.
1
1. INTRODUCTION
Air pollution including ultrafine particles is our main concern. As the air pollution and smoking were getting worst, diseases related in respiratory system have increased. Lung is a representative of respiratory system, and the study of this organ is necessary. Especially, lung cancer has reported the leading cause of cancer death in both of men and women.1 (In the US in 2015)
Lung cancer is divided by three types as morphology, size, or site which are Non-Small cell lung cancer (NSCLC), Small cell lung cancer (SCLC), and Lung carcinoid tumor. Among them, NSCLC is the most common type of lung cancer and this type has three subtypes;Squamous cell carcinoma, adenocarcinoma, large cell carcinoma. Among the lung cancer types, adenocarcinoma is the top of incidence rate. In this case, it occurs among non-smokers as well as smokers. Incidence rate of lung cancer in non- smokers is increasing because of air pollution. Thus, the research of adenocarcinoma is very important.
Recently, organ-on-a-chip or bio-chip is a popular platform to study biological research. Mostly, In vitro lung cancer research has been studied in 2D, tissue culture plate by many cancer researchers. However, many papers have reported differences of results in 2D culture and 3D culture.2 The in
2
vitro results in 3D culture were more similar to in vivo results than those in 2D. The main purpose of organ-on-a-chip is to mimic our body. When we fabricated devices, we used PDMS (poly-dimethyl-siloxane).3 That material is useful to observe cells due to transparence, and gas exchange is also good.
Microfluidic assays using bio-chips focus on microenvironment. One of the famous bio-chip is lung-on-a-chip.2d The bio-chip mimics physical function of lung.4
Many researchers who have studied microfluidic assay focused on physical system more than the microenvironment. They have used only collagen typeⅠ or matrigel.5 However, those hydrogel have limitation to mimic our tissues.
Extracellular matrix (ECM) is one of the important key in microenvironment. Many researchers have studied cells using hydrogels.
One of the popular hydrogels is collagen type Ⅰ that is a most common extracellular matrix (ECM). However, the composition of ECM in each tissue is different due to the different function. Lungs are organs in respiratory system, and those have elasticity for extension and contraction.
The ECM in lungs has known that collagen and elastin are the major components.6 Also, it is reported that collagen is composed of type Ⅰand
Ⅲ as 2:1 ratio.6b Therefore, it is necessary to study response of cells in different hydrogels. We made mixture of ColⅠ, ColⅢ, and elastin (CCE).
3
When the hydrogels became gelation, difference of pH was a key factor.
According to the increasing pH value, hydrogel got stiffness.7 The change of stiffness in microenvironment induced the response of cells. We think that microenvironment in the high grade of cancer or disease could be hard.
We would like to suggest a new platform that reflects microenvironment of lung.
2. EXPERIMENTS
2.1 Materials
Collagen typeⅠ(rat tail) was purchased from BD Bioscience. Those were two types of collagen typeⅠby each concentration. One was high concentration, 10.21mg/ml, and the other was low concentration, 3.96mg/ml.
Both of collagen typeⅠwere made as 2mg/ml that was final concentration.
Collagen typeⅢ (human placenta) was purchased from Advanced BioMatrix. That was 1.1mg/ml concentration. To make the final ratio of Collagen typeⅠ:Ⅲ=2:1(v/v), the final concentration of collagen typeⅢ was 1mg/ml. Elastin-soluble(bovine neck ligament) was purchased from EPC(Elastin Products Company, Inc., USA). Elastin was dissolved with Dulbecco’s Modified Eagle’s Medium (DMEM) to 10mg/ml. The final
4
concentration of elastin solution was 1mg/ml. 1N NaOH was used to control pH of gels.
2.2 Fabrication of microfluidic device
The design of microfluidic devices was made by AutoCAD software. The microfluidic devices in our study have a 1.0-mm-wide central hydrogel region(③), and both side channels(②, ④) of the central region(③) is 800 ㎛. ②,③, and ④channels are flanked by two lateral media channels(①, ⑤) which are 1.0mm. (Figure 1) The device was fabricated with poly-dimethyl-siloxane(PDMS, Sylgard 184; Dow Corning) using soft lithography from patterned SU-8 silicon wafers. Inlet and outlet ports were created with biopsy punches, and a cover glass was bonded to the PDMS after 60s oxygen plasma treatment to generate 200-um-deep microchannels.
And then, those devices were in the 70℃ oven over 4 hours.
5
Figure 1. Schematic of the microfluidic device (a) Microfluidic device model (b) Design of microfluidic device; ①and⑤, both side channels contain medium. Collagen typeⅠis in the ②and④ channels, and ③ channel has mixed gel(CCE) and A549 cell suspension
6
2.3 Gelation of hydrogels
There were three types of hydrogels in our study. First of all, only collagen typeⅠ(BD Bioscience) that was the most general material in biomaterials was to 2mg/ml by using low concentration collagen typeⅠ(3.96mg/ml). To make this hydrogel, 10X PBS with phenol red was 1/10 of total volume in the hydrogel solution, and 1N NaOH was used to control the pH. The other mixed gels were composed of collagen typeⅠ, collagen typeⅢ, and elastin.
Basically, when these mixed gels were made, collagen typeⅠwas used by high concentration (10.21mg/ml). The final concentration was to 2mg/ml.
Collagen typeⅢ of final concentration was 1mg/ml. After all, the final volume ratio of collagen typeⅠand Ⅲ was 2:1. 10mg/ml of elastin with DMEM was to 1mg/ml. Only difference of mixed gels was pH; pH7 (CCE7) and pH11 (CCE11). Gelation process occurred in 30minutes within humidity boxes in incubation at 37℃ and 5% CO2. After gelation, growth medium (DMEM) was put in wells including gels or both side of channels, and those were in incubation over 24hours.
2.4. Cell culture in 2D condition
The cell source was A549 cell line which is adenocarcinoma human alveolar basal epithelial cell. A549 cells were purchased from ATCC
7
(Manassas, VA, USA). Those cell lines were maintained in Dulbecco’s Modified Eagle’s Medium (DMEM) (Welgene, Daegu, Korea) containing 10% fetal bovine serum (FBS; Welgene, Daegu, Korea), 1% Antibiotic- Antimycotic (gibco, USA) in a humidified 5% CO2 atmosphere at 37℃.
2.5. Cell culture in microfluidic devices
A549 cells were detached by 1X trypsin-EDTA solution (Welgene, Daegu, Korea) for 5 minutes in 37℃ incubation as standard protocols. The cells were collected and counted. Before seeding, A549 cells were suspended at 1.0 x 10⁶ cells/mL in CCE hydrogels. To apply in the microfluidic devices, 2mg/ml of collagen typeⅠwas injected in ②, ④ channels, and 1st gelation process occurred in 30minutes within humidity boxes in incubation at 37℃
and 5% CO2. Then, the ③ channel was filled with the cell suspension to complete the seeding, and 2nd gelation occurred in same condition. After gelation, growth medium (DMEM) was injected in both side channels (①,
⑤), and those were in incubation over 24hours. (Figure 1)
2.6. Cell proliferation assay (CCK-8 assay)
The samples of A549 cells were 4 types; 2D, collage typeⅠ, CCE7 gel, and CCE11 gel (n=3). All those samples were cultured in 96-well plate. To do
8
the cell proliferation assay, CCK-8 assay kit (Dojindo) was used. The cells in 2D or 3D condition had 100 ㎕/well medium (DMEM, in serum) in a 96- well plate, and 10㎕ of the CCK-8 solution was added to each well of the plate. Those treated samples were incubated for 3 hours in the incubator, and the absorbance at 450 ㎚ was measured using a microplate reader.
2.7. Zymography analysis of cells
The A549 cells were cultured in 96-well plate at 2D, CCE7 gel, and CCE11 gel (n=3). In 6 hours, day1, and day3, the supernatants of culture medium (DMEM, serum free) were collected by each sample. To load those samples, running gel was made by 0.6% gelatin, and then stacking gel was fabricated. The 20㎕ of samples were mixed with 5㎕of zymo dye, and those were loaded in each well. After running samples, the gels were washed two times with 2.5% Triton X-100 for 30 min in shaking condition. Then the gels were incubated with zymo incubation buffer containing 10 mM CaCl2, 150 mM NaCl, and 50 mM Tris–HCl, pH 7.5. for overnight at 37℃. The gels were then stained with zymo staining buffer containing 0.2%
Coomassie blue for 2 or 3 h, destained with zymo destaining buffer for 3 hours at room temperature, and photographed on a light box. Proteolysis was detected as a white zone in a dark blue field.
9
2.8. Western blot analysis of cells
The A549 cells were cultured in 96-well plate at 2D, CCE7 gel, and CCE11 gel (n=3). In 6 hours, day1, and day3, the cells in 3D were collected by each sample, washed twice with cold PBS and freeze-thawed in 250 µL lysis buffer (containing, in mmol/L, HEPES [pH 7.5] 50, NaCl 150, EDTA 1, EGTA 2.5, DTT 1, β-glycerophosphate 10, NaF 1, Na3VO4 0.1, and phenylmethylsulfonyl fluoride 0.1 and 10% glycerol, 0.1% Tween-20, 10 g/mL of leupeptin, and 2 µg/mL of aprotinin), and then scraped into 1.5-mL tubes. The lysates were placed on ice for 15 minutes and then centrifuged at 12, 000 rpm for 20 minutes at 4℃. The protein concentration of the supernatant was determined using a Bradford reagent method (Bio-Rad).
Equal amounts of cellular proteins were resolved by electrophoresis on a 0.1% SDS–10% polyacrylamide gel (SDS-PAGE) under denaturing conditions. The proteins were transferred electrophoretically to nitrocellulose membranes (Hybond, Amersham Corp). After blocking in 10 mmol/L Tris-HCl (pH 8.0), 150 mmol/L NaCl, and 5% (wt/vol) nonfat dry milk, the membranes were treated with primary antibodies (#5304, #5303, Cell signaling Tech, USA) for 90 minutes, followed by incubation with peroxidase-conjugated secondary antibodies for 45 minutes. The immunocomplexes were detected using a chemiluminescence reagent kit
10
(Amersham Corp). For the immunoblotting studies, the experiments were repeated at least 3 times.
2.9. RNA extraction from tissues and cDNA synthesis
Total RNA was isolated from tissue using 1 mL of TRIzol (Invitrogen, Carlsbad, CA, USA) and homogenization in a 5 mL glass tube. The homogenate was transferred to a 1.5 mL tube and was mixed with 200 µL chloroform. After incubation for 5 min at 4℃, the homogenate was centrifuged for 13 min at 13,000 g and 4℃. The upper aqueous phase was transferred to a clean tube and 500 µL isopropanol was added, followed by incubation for 60 min at 4℃. The tube was then centrifuged for 8 min at 13,000 g and 4℃. Then, the upper aqueous phase was removed, mixed with 500 µL of 75% ethanol, and centrifuged for 5 min at 13,000 g and 4℃. After the upper aqueous layer was discarded, the pellet was dried at room temperature, dissolved with diethylpyrocarbonate (DEPC)-treated water, and stored at -80℃. The quality and integrity of the RNA were confirmed by agarose gel electrophoresis and ethidium bromide staining, followed by visual examination under ultraviolet light. cDNA was then prepared from 1 µg of total RNA using a First-Strand cDNA Synthesis Kit (Clontech, TAKARA, Otsu, Japan) according to the manufacturer's protocol.
11
2.10. Real-time PCR
The expression of CD44, MMP9 and p53 was quantified by real-time PCR using a Rotor Gene 6000 instrument (Corbett Research, Mortlake, Australia).
Real-time PCR assays using SYBR Premix EX Taq (TAKARA BIO INC., Otsu, Japan) were performed in micro-reaction tubes (Corbett Research, Mortlake, Australia). The primers used for amplification of CD44 (152 base pairs), p53 (125 base pairs), MMP9(111 base pairs) and Beta-actin (183 base pairs) by real-time PCR were as follows: CD44 sense, 5'-
GGCTTTCAATAGCACCTTGC-3' and antisense, 5'-
ACACCCCTGTGTTGTTTGCT-3'; p53 sense, 5'-
CACATGACGGAGGTTGTGAG-3' and antisense, 5'-
ACACGCAAATTTCCTTCCAC-3'; sense, MMP-9 sense, 5'-
AGCGAGGTGGACCGGATG-3' and antisense, 5'-
GGAACTCACGCGCCAGTAG-3, respectively. The PCR reaction was performed in a final volume of 10 µL, comprising 5 µL of 2× SYBR Premix EX Taq buffer, 0.5 µL of each 5' and 3' primer (10 pM/µL), and 1 µL of sample cDNA. The products were purified with a QIAquick Extraction kit (QIAGEN, Hilden, Germany), quantified in a spectrometer (Perkin Elmer MBA2000, Fremont, USA), and sequenced using an automated laser fluorescence sequencer (ABI PRISM 3100 Genetic Analyzer, Foster City, USA). A known concentration of the PCR product was then 10-fold serially
12
diluted from 100 pg/µL to 0.1 pg/µL and used to establish a standard curve.
The real-time PCR conditions were as follows: 1 cycle at 96°C for 20 sec, followed by 40 cycles of 3 sec at 96°C for denaturation, 20 sec at 55°C for annealing, and 20 sec at 72°C for extension. The melting program was performed at 72–95°C at a heating rate of 1°C per 45 sec. Spectral data were captured and analyzed using Rotor Gene Real-Time Analysis Software 6.0 Build 14 (Corbett Research, Mortlake, Australia). All samples were run in triplicate. Gene expression was normalized to the expression of Beta- actin.Total RNA was extracted from each sample prepared at day 1 using Qiagen miniprep kit (Qiagen, Inc., Valencia, CA, USA) according to the manufacturer’ s instructions. The extracted RNA was dissolved in nuclear- free water, and the RNA concentration was quantified using a NanoDrop ND1000 Spectrophotometer (Thermo Fisher Scientific). Complementary DNA synthesis was performed using the Maxime RT PreMix (iNtRon, Korea) following the manufacturer’s instructions. All polymerase chain reaction were carried out using ABI Prism 7500 (Applied Biosystems) and gene expression level was quantified using SYBR Premix EX Taq (TaKaRa, Japan). Relative gene expression level was calculated by the comparative Ct method. All target primer sequences were received from Bioneer (Korea).
CD44, MMP-9, and p53 are commercially available.
13
2.11. Immunofluorescence staining
A549 cells in the microfluidic devices were washed three times with PBS, fixed with 3.7% paraformaldehyde (PFA) for 15 min, and washed three times with PBS. A549 cells in the devices were permeabilized with 0.25%
Triton X-100 for 10 min and washed three times with PBS. To avoid non- specific binding, the cells were blocked with 3% BSA for 30 min and washed three times with PBS. Then the cells incubated with primary antibodies against human CD44 (Abcam) for overnight at 4℃. The cells were then washed three times with PBS and incubated for 1 hour at room temperature with the corresponding fluorescence conjugated secondary antibody in 0.1% BSA (Alexa 546 goat anti-mouse lgG, Life Technologies).
The cells were rinsed three times with PBS and F-actin staining for 20 min at room temperature (Alexa Fluor 488 phalloidin). For nuclear staining, the cells were rinsed three times with PBS and used with 100㎍/㎖ of DAPI for 15 min at room temperature. After that, the cells were examined using a confocal microscope (Carl Zeiss, Germany).
2.12. Live cell imaging
The A549 cells were cultured in microfluidic devices. When the 1st gelation was done by collagen typeⅠ, the cells were mixed with one side of that gel. Then the gels were incubated at standing devices for 30 min, and
14
2nd gelation was processed. After that the cells were cultured over 24 h.
Images were taken every 15 min for 50 h by using a live cell microscope (Carl Zeiss Axio Observer. Z1) with incubation at 37℃ and 5% CO2.
15
3. RESULTS AND DISCUSSION
3.1. Difference of CD44 expression of A549 cells according to the hydrogels
The morphologies of A549 cells in different hydrogels demonstrated different shaped. The A549 cells in CCE7 gel were mostly long and narrow.
On the other hand, the cells in CCE11 gel were usually round shape. (Figure 2) CD44 is a migration and metastasis factor, and this factor was also showed in different expressions. Interestingly, CD44 expression in collagen typeⅠthat many researchers usually used was relatively weak. However, CD44 in CCE7 gel and CCE11 gel expressed strongly. We wondered which factor is the key of this effect. The results showed us synergy effects of ColⅠ, ColⅢ, and elastin. (Figure 3-e, f) CD44 expression in CCE11 gel was stronger than that in CCE7 gel. (Figure 3) On different gels, morphologies and CD44 expression demonstrated other aspects. (Figure 4) Generally as the grade of cancer was higher, Extracellular matrix (ECM) was increased and stiff. Thus we expected that as the gel had high pH value, migration of cancer cells might increase. The results proved response of cells similarly in clinical research.
16
Figure 2. Images of A549 cell morphologies at day1 (a) In the CCE7 gel (5X) (b) In the CCE7 gel (10X) (c) In the CCE11 gel (5X) (d) In the CCE11 gel (10X) (e) morphology at day0 in CCE7 (10X) (e) morphology at day0 in CCE11 (10X)
17
Figure 3. Immunofluorescence staining images at day3 (20X) (a) Tile scan image in the CCE7 gel (b) A part image of (a) image (c) Tile scan image in the CCE11 gel (d) A part image of (c) image (e) Tile scan image in the ColⅠ+elastin gel (f) Tile scan image in the ColⅠ+ColⅢ gel, CD44(red), F-actin(green), Nucleus(blue) (scale bar = 50,000㎚)
18
Figure 4. Immunofluorescence staining images at day1 (10X) (a) Only CD44(red) in the CCE7 gel (b) Merge image in the CCE7 gel (c) Only CD44(red) in the CCE11 gel (d) Merge image in the CCE11 gel, CD44(red), F-actin(green), Nucleus(blue) (scale bar = 100㎛)
19
3.2. Proliferation analysis of A549 cells
In the results of proliferation, A549 cells in 2D were showed in slight change or not. From day 1 to day 3, the values in 3D including collagen typeⅠ, and CCE gels were increased overall. The values in CCE7 and CCE11 gels were increased over 1.5 times until day2. After that the rate of change in CCE7 gel was insignificant, but that in CCE11 gel was relatively increased. The value in collagen typeⅠ was also increased until day 2, but after that decreased.
20
Figure 5. Results of CCK-8 for assessment of A549 cell proliferation. (OD 450㎚)
21
3.3. A549 cells in 3D hydrogels produce Matrix Metalloproteinases not produced in 2D culture
It was reported that human lung cancer cells in an Ex Vivo 3D lung model produce Matrix Metalloproteinases (MMPs) not produced in 2D culture.8 To confirm our hydrogels, Matrix Metalloproteinases (MMPs) were checked using zymography. MMPs are metastasis and invasion factors. MMP-9 was not produced in 2D culture. In the results of zymography, MMP-9 was able to be checked in 3D CCE gels, and that was not checked in 2D culture.
22
Figure 6. Results of zymography analysis
23
3.4. Marked differences in RNA levels
The representative factors related to metastasis are CD44 and MMP-9. On the other hand, p53 is a representative tumor suppressor gene. Those genes of inverse tendency were analyzed by qPCR. As results of qPCR, CD44 and MMP-9 genes were expressed increasingly by the high pH condition. On the contrary, p53 expression was significantly decreased in CCE11 gel. Those results demonstrated our hypothesis.
24
Figure 7. Results of qPCR analysis (a) comparison of CD44 and MMP-9 expression in 2D , pH7 (CCE7) gel, and pH11 (CCE11) gel, CD44(green bar), MMP-9(pink bar) (b) comparison of p53 expression in 2D , pH7 (CCEgel, and pH11 gel, p53(pink bar)
25
3.5. Noticeable results in Protein levels
To check expression of the protein level, some factors were researched by Western blot analysis. The proteins which are Beta-actin, elF4e, and Pin1 are loading control. MMP-9 is an invasion and metastasis factor. P-Stat1 is a cancer growth transcription factor. P-AKT is a cancer proliferation factor.
The p53 is a tumor suppressor factor. Those factors were analyzed. In case of MMP-9, the expression was significantly increased in CCE gel especially in CCE11. The expression of P-Stat1 was able to be checked in 3D condition rather than in 2D culture. The P-AKT was expressed relatively strong in CCE11 gel. However, as the p53 is an opposite aspect factor, that was showed the opposite tendency rather than the others. Through these results, the CCE gels were demonstrated as more mimicking lung microenvironment.
26
Figure 8. Results of Western blot analysis (a) MMP-9 (Invasion/ metastasis factor) (b) P-Stat1 (cancer growth transcription factor) (c) P-AKT (cancer proliferation factor) (d) p53 (tumor suppressor factor) (e) Beta-actin, (f) elF4e, (g) Pin1 (e,f,g) are loading controls
27
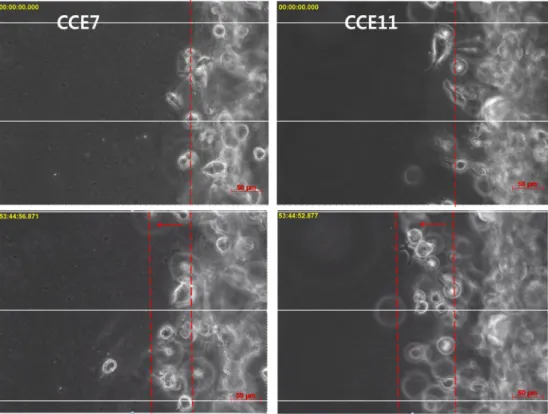
3.6. Response of A549 cells in CCE gels
Live images were taken every 15 min for 50 h by using a live cell microscope (Carl Zeiss Axio Observer. Z1) with incubation at 37℃ and 5%
CO2. A549 cells migrated better in CCE11.
28
Figure 9. Figures were captured by live imaging. The figure on the left side was about response of A549 cells in CCE7, and the right side figure was about response of A549 cells in CCE11.
29
4. CONCLUSION
In this study, we have designed a platform that is able to study lung cancer efficiently. We mimicked lung microenvironment to confirm differences of metastasis on the lung cancer as the high grade of lung cancer occurred changes of the Extracellular Matrix (ECM). Our study also identified that the response of A549 cells had differences in CCE gels compared with collagen typeⅠ. We induced artificial properties of gels using different pH, and the results of these changes showed that the factors related to metastasis were expressed strongly in CCE11 gel that was mimicked as dense microenvironment.
As a result, our research demonstrated that the new platform using mixed gels could be an effective tool in lung cancer analysis.
30
5. REFERENCES
1. Ettinger, D. S.; Akerley, W.; Borghaei, H.; Chang, A. C.; Cheney, R.
T.; Chirieac, L. R.; D'Amico, T. A.; Demmy, T. L.; Ganti, A. K. P.; Govindan, R.; Grannis, F. W.; Horn, L.; Jahan, T. M.; Jahanzeb, M.; Kessinger, A.;
Komaki, R.; Kong, F. M.; Kris, M. G.; Krug, L. M.; Lennes, I. T.; Loo, B.
W.; Martins, R.; O'Malley, J.; Osarogiagbon, R. U.; Otterson, G. A.; Patel, J.
D.; Pinder-Schenck, M. C.; Pisters, K. M.; Reckamp, K.; Riely, G. J.;
Rohren, E.; Swanson, S. J.; Wood, D. E.; Yang, S. C.; Hughes, M.; Gregory, K. M.; Lung, N. N.-S. C., Non-Small Cell Lung Cancer. J Natl Compr Canc Ne 2012, 10 (10), 1236-1271.
2. (a) Polacheck, W. J.; Zervantonakis, I. K.; Kamm, R. D., Tumor cell migration in complex microenvironments. Cellular and molecular life sciences : CMLS 2013, 70 (8), 1335-56; (b) Bersini, S.; Jeon, J. S.; Dubini, G.; Arrigoni, C.; Chung, S.; Charest, J. L.; Moretti, M.; Kamm, R. D., A microfluidic 3D in vitro model for specificity of breast cancer metastasis to bone. Biomaterials 2014, 35 (8), 2454-2461; (c) Bersini, S.; Jeon, J. S.;
Kamm, R. D.; Moretti, M., Human 3D Vascularized Organotypic Microfluidic Models for the Study of Breast Cancer Cell Extravasation.
Tissue Eng Pt A 2015, 21, S207-S207; (d) Huh, D.; Matthews, B. D.;
Mammoto, A.; Montoya-Zavala, M.; Hsin, H. Y.; Ingber, D. E.,
31
Reconstituting organ-level lung functions on a chip. Science 2010, 328 (5986), 1662-8.
3. Takayama, S.; Ostuni, E.; Qian, X. P.; McDonald, J. C.; Jiang, X.
Y.; LeDuc, P.; Wu, M. H.; Ingber, D. E.; Whitesides, G. M., Topographical micropatterning of poly(dimethylsiloxane) using laminar flows of liquids in capillaries. Advanced materials 2001, 13 (8), 570-+.
4. (a) Stucki, A. O.; Stucki, J. D.; Hall, S. R. R.; Felder, M.; Mermoud, Y.; Schmid, R. A.; Geiser, T.; Guenat, O. T., A lung-on-a-chip array with an integrated bio-inspired respiration mechanism. Lab on a chip 2015, 15 (5), 1302-1310; (b) Doryab, A.; Amoabediny, G.; Salehi-Najafabadi, A.,
Advances in pulmonary therapy and drug development: Lung tissue engineering to lung-on-a-chip. Biotechnol Adv 2016, 34 (5), 588-96; (c) Nesmith, A. P.; Agarwal, A.; McCain, M. L.; Parker, K. K., Human airway musculature on a chip: an in vitro model of allergic asthmatic
bronchoconstriction and bronchodilation. Lab on a chip 2014, 14 (20), 3925-36; (d) Sellgren, K. L.; Butala, E. J.; Gilmour, B. P.; Randell, S. H.;
Grego, S., A biomimetic multicellular model of the airways using primary human cells. Lab on a chip 2014, 14 (17), 3349-3358; (e) Benam, K. H.;
Villenave, R.; Lucchesi, C.; Varone, A.; Hubeau, C.; Lee, H. H.; Alves, S.
E.; Salmon, M.; Ferrante, T. C.; Weaver, J. C.; Bahinski, A.; Hamilton, G.
A.; Ingber, D. E., Small airway-on-a-chip enables analysis of human lung
32
inflammation and drug responses in vitro. Nature methods 2016, 13 (2), 151-+.
5. Hughes, C. S.; Postovit, L. M.; Lajoie, G. A., Matrigel: a complex protein mixture required for optimal growth of cell culture. Proteomics 2010, 10 (9), 1886-90.
6. (a) Lang, M. R.; Fiaux, G. W.; Gillooly, M.; Stewart, J. A.; Hulmes, D. J.; Lamb, D., Collagen content of alveolar wall tissue in emphysematous and non-emphysematous lungs. Thorax 1994, 49 (4), 319-26; (b) Pierce, J.
A.; Hocott, J. B., Studies on the collagen and elastin content of the human lung. The Journal of clinical investigation 1960, 39, 8-14.
7. Sapudom, J.; Rubner, S.; Martin, S.; Kurth, T.; Riedel, S.; Mierke, C.
T.; Pompe, T., The phenotype of cancer cell invasion controlled by fibril diameter and pore size of 3D collagen networks. Biomaterials 2015, 52, 367-375.
8. Mishra, D. K.; Sakamoto, J. H.; Thrall, M. J.; Baird, B. N.;
Blackmon, S. H.; Ferrari, M.; Kurie, J. M.; Kim, M. P., Human lung cancer cells grown in an ex vivo 3D lung model produce matrix metalloproteinases not produced in 2D culture. PloS one 2012, 7 (9), e45308.
33
요약문
많은 암 연구자들은 In vitro 실험에서 일반적으로 2 차원 조건인 tissue culture plate(TCP)에서 실험을 하였다. 하지만 기존 2 차원방식에서의 결과는 임상에서의 결과와 차이가 커서 치료제 개발 및 관련 질병 연구에 많은 문제를 야기하였다. 최근 보고에 따르면 2 차원 조건과 3 차원 환경에서의 실험결과가 분명한 차이를 보여 주었고, 더 나아가 생체 내 조직의 미세한 환경에 따른 차이까지 보고되고 있다. 기존 3 차원 방식에서의 세포배양은 일반적으로 collagen typeⅠ의 하이드로젤을 주로 사용하여 연구하였다. 그러나 각 조직에서의 세포외기질 구성은 그 기능이 각각 다르기 때문에 다른 조성을 갖는다. 폐의 경우, 호흡계의 주요 기관으로 신장과 수축을 해야 하기에 탄성력을 갖는다. 그래서 실제 폐 주변 세포외기질 환경에는 collagen 과 elastin 이 일정 비율로 구성되어 있음이 알려져 왔다. 우리 연구에서는 폐의 미세환경에 중점을 두고 마이크로플루이딕 디바이스를 활용하여 생체와 좀 더 유사한 환경을 모사하고자 하였다. 그리고 세포의 모양차이나 RNA, 단백질, 그리고 효소
34
등의 생물학적 반응들에 비교 분석 및 임상 시 반응과 유사한 결론을 도출하여 기존의 분석 방식보다 효과적인 폐암분석 플랫폼으로서의 가능성을 제시하였다.
주요 어: 세포외기질, 생체유사 미세환경, 마이크로플루이딕, 바이오 칩, 폐암
학번: 2014-22538