저작자표시-비영리-변경금지 2.0 대한민국 이용자는 아래의 조건을 따르는 경우에 한하여 자유롭게
l 이 저작물을 복제, 배포, 전송, 전시, 공연 및 방송할 수 있습니다. 다음과 같은 조건을 따라야 합니다:
l 귀하는, 이 저작물의 재이용이나 배포의 경우, 이 저작물에 적용된 이용허락조건 을 명확하게 나타내어야 합니다.
l 저작권자로부터 별도의 허가를 받으면 이러한 조건들은 적용되지 않습니다.
저작권법에 따른 이용자의 권리는 위의 내용에 의하여 영향을 받지 않습니다. 이것은 이용허락규약(Legal Code)을 이해하기 쉽게 요약한 것입니다.
Disclaimer
저작자표시. 귀하는 원저작자를 표시하여야 합니다.
비영리. 귀하는 이 저작물을 영리 목적으로 이용할 수 없습니다.
변경금지. 귀하는 이 저작물을 개작, 변형 또는 가공할 수 없습니다.
공학박사학위논문
장수거북의 종방향 릿지:
유체역학적 역할과 컨셉카 디자인 응용
Longitudinal ridges on a leatherback turtle:
hydrodynamic role and application to concept-car design
2017 년 8 월
서울대학교 대학원
기계항공공학부
Longitudinal ridges on a leatherback turtle:
hydrodynamic role
and application to concept-car design
Kyeongtae Bang
Department of Mechanical & Aerospace Engineering Seoul National University
Abstract
Leatherback sea turtles (Dermochelys coriacea) are known to have a superior diving ability and be highly adapted to pelagic swimming. They have five longitudinal ridges on their carapace and these ridges are one of remarkable morphological features distinguished from other marine turtles. Although it was conjectured that these ridges might be an adaptation for flow control, no rigorous study has been performed to understand their hydrodynamic roles.
Therefore, to elucidate the hydrodynamic role of these ridges in the leatherback turtle swimming, in Part I, I model a carapace with and without the ridges by using three dimensional surface data of a stuffed leatherback turtle in the Na- tional Science Museum, Korea. The experiment is conducted in a wind tunnel in the ranges of the real leatherback turtle’s Reynolds number (Re) and angle of attack (α). The ridges are slightly misaligned to the streamlines around the body to generate streamwise vortices, and suppress flow separation on the cara- pace, resulting in enhanced hydrodynamic performances during different modes of swimming. At high negative angles of attack and relatively low swimming
speed corresponding to a vigorous swimming condition of hatchlings, the ridges significantly decrease the drag and increase the lift. At high positive angles of attack and relatively high swimming speed that represents the conditions of ascending swimming of adults, the ridges enhance the lift and lift-to-drag ratio while increasing the drag. This study is the first experimental demonstration that the longitudinal ridges on the carapace of leatherback sea turtle, which are locally misaligned to the streamlines around the body, suppress flow separation on the carapace by generating streamwise vortices. These results suggest that shapes of some morphological features of living creatures, like the longitudinal ridges of the leatherback turtles, need not be streamlined for excellent hydro- or aerodynamic performances, contrary to our common physical intuition.
From this conceptual approach, in Part II, I develop a newly-designed con- cept car model which has the longitudinal ridges on the surface and investigate the aerodynamic performance of the concept model. At zero yaw angle, the drag coefficient of the concept model is about 5% lower than that of the base model (Hyundai motors). To understand the effect of side wind on the aerodynamic characteristics of the model, I also consider non-zero yaw angles (γ=0◦-30◦) and measure the drag and side forces. At non-zero yaw angles, the drag coefficient on the concept model is lower by upto 13% than that of the base model, and the side force coefficient on the concept model is lower by upto 20% compared to that of the base model. These results support that, unless the yaw angle is very large, the aerodynamic effects of the concept design in terms of drag and side forces are still similar to those of zero yaw angle. Flow-field analysis shows that the ridges on the concept model generate streamwise vortices, and suppress flow separation on the rear slanted surface, resulting in the drag reduction of
the concept model.
Keywords: leatherback turtle, ridge, streamwise vortex, hydrodynamics, bio-mimetic flow control, concept car, lift, drag
Student number: 2011-22888
Contents
Abstract . . . .i
Contents . . . .iv
List of Figures . . . .vi
Nomenclature . . . .xxii
Part I. Hydrodynamic role of longitudinal ridges in a leatherback turtle swimming Chapter 1 Introduction 2 1.1 Behavioral characteristics of adult leatherback turtles . . . 4
1.2 Behavioral characteristics of hatchling leatherback turtles . . . . 4
1.3 Objectives . . . 5
2 Experimental Set-up 13 2.1 Leatherback turtle models . . . 13
2.2 Force measurements . . . 17
2.3 Oil-surface visualization . . . 18
2.4 Digital particle image velocimetry . . . 18
3 Results and Discussion 28 3.1 Lift and drag variations . . . 28
3.2 Importance of the hydrodynamic force variations for hatchlings . 29
3.3 Importance of the hydrodynamic force variations for adults . . . 31
3.4 Flow-filed measurements for the case of hatchlings . . . 31
3.5 Flow-filed measurements for the case of adults . . . 33
3.6 Effect of a yaw angle variation . . . 34
3.7 Effect of a head . . . 35
4 Summary and Concluding Remarks 75 Part II. Development of a bio-mimetic concept car design with low aerodynamic drag Chapter 5 Introduction 78 6 Experimental Set-up 81 6.1 Target model . . . 81
6.2 Development of concept car design . . . 82
6.3 Wind-tunnel measurement . . . 83
7 Results and Discussion 92 7.1 Drag variation on the target model . . . 92
7.2 Drag and side force variations of concept model . . . 93
7.3 Flow-field measurements on both target and concept model . . . 94
8 Summary and Concluding Remarks 120 References . . . .122
List of Figures
Part I. Hydrodynamic role of longitudinal ridges in a leatherback turtle swimming
Figure
1.1 Morphological characteristics and longitudinal dorsal ridges of a leatherback sea turtle. . . 6 1.2 Averaged body length of various sea turtles. . . 7 1.3 (a) Maximum swimming speed of sea turtles (b) Cruise swimming
speed variations of sea turtles. . . 8 1.4 Migration routes of leatherback sea turtles. . . 9 1.5 Schematic diagram of swimming patterns of hatchling leatherback
turtles (Davenport, 1987). . . 10 1.6 Schematic diagram of diving patterns of adult leatherback turtles
(Fossette et al., 2010). . . 11 1.7 Variation of the Reynolds number in leatherback turtle swim-
ming based on the carapace length and different stages of growth.
Carapace length of hatchlings is about 24 cm at Re = 2 × 10⁵ (Davenport, 1987) and carapace length of adults is about 1 m at Re= 5×10⁵ (Eckert, 2002). The present measurement range is drawn in dashed gray line. . . 12 2.1 A stuffed leatherback turtle in National science museum, Dae-
jeon, Korea which is used for three-dimensional surface measure- ment. . . 20
2.2 Construction of the carapace model. (a) Perspective view; (b) Cross-sectional view. . . 21 2.3 Carapace model specification. Characteristic lengths and areas
of the carapace models. . . 22 2.4 (a) Three dimensional drawing of the carapace model; (b) Assem-
bly diagram of the carapace model. Note that the model body is illustrated transparently for clarity. . . 23 2.5 Schematic diagram of the experimental set-up for the force mea-
surement. Here, L, D, and S denote the lift, drag, and side forces, respectively, andγ is the yaw angle. . . 24 2.6 Detailed drawing of the force measurement system. . . 25 2.7 Schematic diagram of the experimental set-up for the velocity
measurement with DPIV. . . 26 2.8 Carapace models with the head. (a) Perspective view; (b) Top
and side views. The shape of the head was constructed based on the three-dimensional surface data of a stuffed leatherback turtle. 27 3.1 Results of force measurements (γ=0◦). (a) Variations of the drag
coefficients (CD) on the models with (solid symbols) and without (open symbols) the ridges depending on the angles of attack (α) and Reynolds numbers (Re); (b) Variations of the drag coeffi- cients with three Reynolds numbers (Re = 2 × 10⁵, 5 × 10⁵, 8
× 105) for clarity. . . 37
3.2 Results of force measurements (γ=0◦). (a) Variations of the lift coefficients (CL) on the models with (solid symbols) and without (open symbols) the ridges depending on the angles of attack (α) and Reynolds numbers (Re); (b) Variations of the lift coefficients with three Reynolds numbers (Re= 2 × 10⁵, 5 × 10⁵, 8 × 10⁵) for clarity. . . 38 3.3 Results of force measurements (γ=0◦). (a) Variations of the lift-
to-drag ratio (L/D) on the models with (solid symbols) and with- out (open symbols) the ridges depending on the angles of attack (α) and Reynolds numbers (Re); (b) Variations of the lift-to-drag ratio with three Reynolds numbers (Re= 2 × 10⁵, 5 × 10⁵, 8 × 10⁵) for clarity. . . 39 3.4 Results of force measurements (γ=0◦). (a) Variations of the
drag coefficient (CD) by the ridges. Here, ∆CD=CD,withtheridges- CD,withouttheridges; (b) Variation rates of CD by the ridges. Here,
∆CD(%)=(CD,withtheridges-CD,withouttheridges)/CD,withouttheridges×100.
The white dots in these figures represent the points where the ex- periments were conducted. . . 40 3.5 Results of force measurements (γ=0◦). (a) Variations of the
lift coefficient (CL) by the ridges. Here, ∆CL=CL,withtheridges- CL,withouttheridges; (b) Variation rates of CL by the ridges. Here,
∆CL(%)=(CL,withtheridges-CL,withouttheridges)/CL,withouttheridges×100.
The white dots in these figures represent the points where the ex- periments were conducted. . . 41
3.6 Results of force measurements (γ=0◦). (a) Variations of the lift- to-drag ratio (L/D) by the ridges. Here, ∆L/D=L/Dwiththeridges- L/Dwithouttheridges; (b) Variation rates ofL/Dby the ridges. Here,
∆L/D(%)=(L/Dwiththeridges-L/Dwithouttheridges)/L/Dwithouttheridges
×100. The white dots in these figures represent the points where the experiments were conducted. . . 42 3.7 Results of flow-field measurements at α=-22◦ and Re=2×10⁵
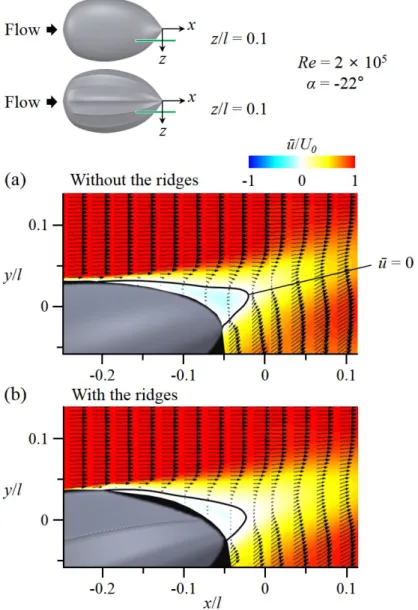
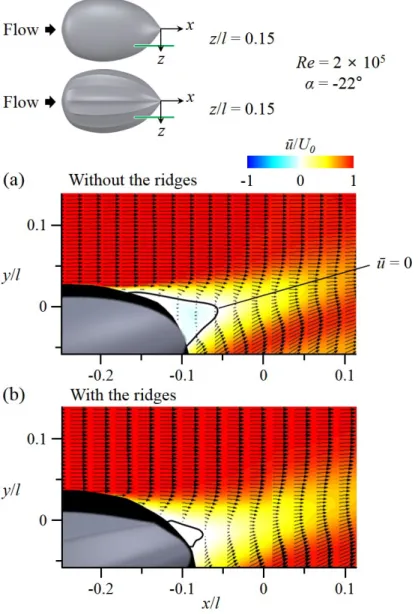
that represents the vigorous swimming of the hatchlings (z/l=0, γ=0◦). (a)Contours of time-averaged streamwise velocity and velocity vectors with absence of the ridges; (b) Contours of time- averaged streamwise velocity and velocity vectors with presence of the ridges. . . 43 3.8 Results of flow-field measurements at α=-22◦ and Re=2×10⁵
that represents the vigorous swimming of the hatchlings (z/l=0.05, γ=0◦). (a)Contours of time-averaged streamwise velocity and ve- locity vectors with absence of the ridges; (b) Contours of time- averaged streamwise velocity and velocity vectors with presence of the ridges. . . 44 3.9 Results of flow-field measurements at α=-22◦ and Re=2×10⁵
that represents the vigorous swimming of the hatchlings (z/l=0.1, γ=0◦). (a)Contours of time-averaged streamwise velocity and ve- locity vectors with absence of the ridges; (b) Contours of time- averaged streamwise velocity and velocity vectors with presence of the ridges. . . 45
3.10 Results of flow-field measurements at α=-22◦ and Re=2×10⁵ that represents the vigorous swimming of the hatchlings (z/l=0.15, γ=0◦). (a)Contours of time-averaged streamwise velocity and ve- locity vectors with absence of the ridges; (b) Contours of time- averaged streamwise velocity and velocity vectors with presence of the ridges. . . 46 3.11 Results of flow-field measurements at α=-22◦ and Re=2×10⁵
that represents the vigorous swimming of the hatchlings (z/l=0, γ=0◦). (a)Contours of Reynolds shear stress and velocity vectors with absence of the ridges; (b) Contours of Reynolds shear stress and velocity vectors with presence of the ridges. . . 47 3.12 Results of flow-field measurements at α=-22◦ and Re=2×10⁵
that represents the vigorous swimming of the hatchlings (z/l=0.05, γ=0◦). (a)Contours of Reynolds shear stress and velocity vectors with absence of the ridges; (b) Contours of Reynolds shear stress and velocity vectors with presence of the ridges. . . 48 3.13 Results of flow-field measurements at α=-22◦ and Re=2×10⁵
that represents the vigorous swimming of the hatchlings (z/l=0.1, γ=0◦). (a)Contours of Reynolds shear stress and velocity vectors with absence of the ridges; (b) Contours of Reynolds shear stress and velocity vectors with presence of the ridges. . . 49 3.14 Results of flow-field measurements at α=-22◦ and Re=2×10⁵
that represents the vigorous swimming of the hatchlings (z/l=0.15, γ=0◦). (a)Contours of Reynolds shear stress and velocity vectors with absence of the ridges; (b) Contours of Reynolds shear stress and velocity vectors with presence of the ridges. . . 50
3.15 Results of flow-field measurements at α=-22◦ and Re=2×10⁵ that represents the vigorous swimming of the hatchlings (x/l=- 0.28, γ=0◦). (a)Contours of instantaneous streamwise vorticity and velocity vectors with absence of the ridges; (b) Contours of instantaneous streamwise vorticity and velocity vectors with presence of the ridges. . . 51 3.16 Results of flow-field measurements at α=-22◦ and Re=2×10⁵
that represents the vigorous swimming of the hatchlings (x/l=- 0.23, γ=0◦). (a)Contours of instantaneous streamwise vorticity and velocity vectors with absence of the ridges; (b) Contours of instantaneous streamwise vorticity and velocity vectors with presence of the ridges. . . 52 3.17 Results of flow-field measurements at α=-22◦ and Re=2×10⁵
that represents the vigorous swimming of the hatchlings (x/l=- 0.18, γ=0◦). (a)Contours of instantaneous streamwise vorticity and velocity vectors with absence of the ridges; (b) Contours of instantaneous streamwise vorticity and velocity vectors with presence of the ridges. . . 53 3.18 Results of flow-field measurements at α=-22◦ and Re=2×10⁵
that represents the vigorous swimming of the hatchlings (x/l=- 0.13, γ=0◦). (a)Contours of instantaneous streamwise vorticity and velocity vectors with absence of the ridges; (b) Contours of instantaneous streamwise vorticity and velocity vectors with presence of the ridges. . . 54 3.19 Schematic diagram for the mechanism of streamwise vortex gen-
eration and separation delay by the ridges. . . 55
3.20 Oil-surface visualization on the model without the ridges atα=18◦ andRe=5×10⁵that represents the active ascending swimming of adults (γ=0◦). Red solid and dashed lines denote the locations of flow separation and reattachment on the front surface of the model, respectively. . . 56 3.21 Oil-surface visualization on the model with the ridges at α=18◦
andRe=5×10⁵that represents the active ascending swimming of adults (γ=0◦). Red solid and dashed lines denote the locations of flow separation and reattachment on the front surface of the model, respectively. . . 57 3.22 Results of flow-field measurements atα=18◦ andRe=5×10⁵ that
represents the active ascending swimming of adults (x/l=-0.75, γ=0◦). (a) Contours of the instantaneous streamwise vorticity and velocity vectors with absence of the ridges; (b) Contours of the instantaneous streamwise vorticity and velocity vectors with presence of the ridges. Here, the spanwise domain is in between the first and second off-center ridges. . . 58 3.23 Results of flow-field measurements atα=18◦ andRe=5×10⁵ that
represents the active ascending swimming of adults (x/l=-0.725, γ=0◦). (a) Contours of the instantaneous streamwise vorticity and velocity vectors with absence of the ridges; (b) Contours of the instantaneous streamwise vorticity and velocity vectors with presence of the ridges. Here, the spanwise domain is in between the first and second off-center ridges. . . 59
3.24 Results of flow-field measurements atα=18◦ andRe=5×10⁵ that represents the active ascending swimming of adults (x/l=-0.7, γ=0◦). (a) Contours of the instantaneous streamwise vorticity and velocity vectors with absence of the ridges; (b) Contours of the instantaneous streamwise vorticity and velocity vectors with presence of the ridges. Here, the spanwise domain is in between the first and second off-center ridges. . . 60 3.25 Results of flow-field measurements atα=18◦ andRe=5×10⁵ that
represents the active ascending swimming of adults (x/l=-0.675, γ=0◦). (a) Contours of the instantaneous streamwise vorticity and velocity vectors with absence of the ridges; (b) Contours of the instantaneous streamwise vorticity and velocity vectors with presence of the ridges. Here, the spanwise domain is in between the first and second off-center ridges. . . 61 3.26 Results of flow-field measurements atα=18◦ andRe=5×10⁵ that
represents the active ascending swimming of adults (x/l=-0.725, γ=0◦). (a) Contours of the instantaneous streamwise vorticity and velocity vectors with absence of the ridges; (b) Contours of the instantaneous streamwise vorticity and velocity vectors with presence of the ridges. Here, the spanwise domain is in between the center and first off-center ridges. . . 62
3.27 Results of flow-field measurements atα=18◦ andRe=5×10⁵ that represents the active ascending swimming of adults (x/l=-0.7, γ=0◦). (a) Contours of the instantaneous streamwise vorticity and velocity vectors with absence of the ridges; (b) Contours of the instantaneous streamwise vorticity and velocity vectors with presence of the ridges. Here, the spanwise domain is in between the center and first off-center ridges. . . 63 3.28 Results of flow-field measurements atα=18◦ andRe=5×10⁵ that
represents the active ascending swimming of adults (x/l=-0.675, γ=0◦). (a) Contours of the instantaneous streamwise vorticity and velocity vectors with absence of the ridges; (b) Contours of the instantaneous streamwise vorticity and velocity vectors with presence of the ridges. Here, the spanwise domain is in between the center and first off-center ridges. . . 64 3.29 Results of flow-field measurements atα=18◦ andRe=5×10⁵ that
represents the active ascending swimming of adults (x/l=-0.65, γ=0◦). (a) Contours of the instantaneous streamwise vorticity and velocity vectors with absence of the ridges; (b) Contours of the instantaneous streamwise vorticity and velocity vectors with presence of the ridges. Here, the spanwise domain is in between the center and first off-center ridges. . . 65
3.30 Results of flow-field measurements atα=18◦ andRe=5×10⁵ that represents the active ascending swimming of adults (z/l=0 (left panel), z/l=0.01 (right panel), γ=0◦). (a) Contours of time- averaged streamwise velocity and velocity vectors at two span- wise locations on the rear part of the model without the ridges;
(b) Contours of time-averaged streamwise velocity and velocity vectors at two spanwise locations on the rear part of the model with the ridges. . . 66 3.31 Results of flow-field measurements atα=18◦ andRe=5×10⁵ that
represents the active ascending swimming of adults (z/l=0.02 (left panel),z/l=0.03 (right panel), γ=0◦). (a) Contours of time- averaged streamwise velocity and velocity vectors at two spanwise locations on the rear part of the model without the ridges; (b) Contours of time-averaged streamwise velocity and velocity vec- tors at two spanwise locations on the rear part of the model with the ridges. . . 67 3.32 Results of flow-field measurements atα=18◦ andRe=5×10⁵ that
represents the active ascending swimming of adults (z/l=0.04 (left panel),z/l=0.05 (right panel), γ=0◦). (a) Contours of time- averaged streamwise velocity and velocity vectors at two spanwise locations on the rear part of the model without the ridges; (b) Contours of time-averaged streamwise velocity and velocity vec- tors at two spanwise locations on the rear part of the model with the ridges. . . 68
3.33 Results of flow-field measurements atα=18◦ andRe=5×10⁵ that represents the active ascending swimming of adults (z/l=0.06 (left panel),z/l=0.07 (right panel), γ=0◦). (a) Contours of time- averaged streamwise velocity and velocity vectors at two spanwise locations on the rear part of the model without the ridges; (b) Contours of time-averaged streamwise velocity and velocity vec- tors at two spanwise locations on the rear part of the model with the ridges. . . 69 3.34 Results of flow-field measurements atα=18◦ andRe=5×10⁵ that
represents the active ascending swimming of adults (z/l=0.08 (left panel),z/l=0.09 (right panel), γ=0◦). (a) Contours of time- averaged streamwise velocity and velocity vectors at two spanwise locations on the rear part of the model without the ridges; (b) Contours of time-averaged streamwise velocity and velocity vec- tors at two spanwise locations on the rear part of the model with the ridges. . . 70 3.35 Results of flow-field measurements atα=18◦ andRe=5×10⁵ that
represents the active ascending swimming of adults (z/l=0.1, γ=0◦). (a) Contours of time-averaged streamwise velocity and velocity vectors on the rear part of the model without the ridges;
(b) Contours of time-averaged streamwise velocity and velocity vectors on the rear part of the model with the ridges. . . 71 3.36 Separation lines on the rear part of the model. (a) Separation
line with absence of the ridges; (b) Separation line with pres- ence of the ridges. These lines are drawn from the velocity fields measured at eleven spanwise locations and detailed information is given in Fiugre 3.30 - 3.37. . . 72
3.37 Variations of the drag (CD), lift (CL), and side force (CS) coeffi- cients with the yaw angle. (a) Vigorous swimming of hatchlings;
(b) Active ascending swimming of adults. . . 73 3.38 Force measurements on the carapace models with the head (γ=0◦).
(a) Vigorous swimming of hatchlings; (b) Active ascending swim- ming of adults. . . 74
Part II. Development of a bio-mimetic concept car design with low aerodynamic drag
Figure
5.1 Aerodynamic drag distribution of various automobiles with re- spect to production year. . . 80 6.1 Target model selection based on the distribution of drag coeffi-
cient according to automobile length-to-height ratio (l/h). . . . 86 6.2 Construction of the experiment model based on I40. (a) Perspec-
tive view; (b) Top view, side view, and front view of the model and characteristic area of the model. . . 87 6.3 Development of concept model based on I40 model and leatherback
turtle model. . . 88 6.4 Construction of the newly-designed concept model. (a) Perspec-
tive view; (b) Top view, side view, and front view of the model and characteristic area of the model. . . 89 6.5 Schematic diagram of the experimental set-up for the force mea-
surement and detailed drawing of the force measurement system.
Here, h, and G denote the model height, and ground clearance, respectively, and γ is the yaw angle. . . 90 6.6 Schematic diagram of the experimental set-up for the velocity
measurement with DPIV. . . 91 7.1 Variations of drag coefficient on the I40 model (target model). . 98 7.2 Variations of drag coefficient on the I40 model and Concept
model (new design). . . 99
7.3 Effect of yaw angle variation (γ=0◦-30◦) on the models atRe=154,000.
(a) Variations of drag coefficient depending on the yaw angle; (b) Variations of side force coefficient depending on the yaw angle. . 100 7.4 Effect of yaw angle variation (γ=0◦-30◦) on the models atRe=257,000.
(a) Variations of drag coefficient depending on the yaw angle; (b) Variations of side force coefficient depending on the yaw angle. . 101 7.5 Effect of yaw angle variation (γ=0◦-30◦) on the models atRe=359,000.
(a) Variations of drag coefficient depending on the yaw angle; (b) Variations of side force coefficient depending on the yaw angle. . 102 7.6 Effect of yaw angle variation (γ=0◦-20◦) on the models atRe=462,000.
(a) Variations of drag coefficient depending on the yaw angle; (b) Variations of side force coefficient depending on the yaw angle. . 103 7.7 Oil-surface visualization on the rear part of the models atRe=154,000,
γ=0◦. (a) I40 model without deflector (no control); (b) Concept model (new design). . . 104 7.8 Contours of the time-averaged streamwise velocity (u) and veloc-
ity vectors at z/h=0, Re=154,000 (γ=0◦). Solid black lines in this figure indicate the locations of u=0. (a) I40 model without deflector (no cnotrol); (b) Concept model (new design); (c) I40 model with deflector. . . 105 7.9 Contours of the time-averaged streamwise velocity (u) and veloc-
ity vectors at z/h=0.1,Re=154,000 (γ=0◦). Solid black lines in this figure indicate the locations of u=0. (a) I40 model without deflector (no cnotrol); (b) Concept model (new design); (c) I40 model with deflector. . . 106
7.10 Contours of the time-averaged streamwise velocity (u) and veloc- ity vectors at z/h=0.2,Re=154,000 (γ=0◦). Solid black lines in this figure indicate the locations of u=0. (a) I40 model without deflector (no cnotrol); (b) Concept model (new design); (c) I40 model with deflector. . . 107 7.11 Contours of the instantaneous streamwise velocity (u) and veloc-
ity vectors atz/h=0,Re=154,000 (γ=0◦). (a) I40 model without deflector (no cnotrol); (b) Concept model (new design); (c) I40 model with deflector. . . 108 7.12 Contours of the instantaneous streamwise velocity (u) and ve-
locity vectors at z/h=0.1, Re=154,000 (γ=0◦). (a) I40 model without deflector (no cnotrol); (b) Concept model (new design);
(c) I40 model with deflector. . . 109 7.13 Contours of the instantaneous streamwise velocity (u) and ve-
locity vectors at z/h=0.2, Re=154,000 (γ=0◦). (a) I40 model without deflector (no cnotrol); (b) Concept model (new design);
(c) I40 model with deflector. . . 110 7.14 Contours of the instantaneous streamwise vorticity (ωx) and ve-
locity vectors at x/h=2.9, Re=154,000 (γ=0◦). (a) I40 model without deflector (no cnotrol); (b) Concept model (new design);
(c) I40 model with deflector. . . 111 7.15 Contours of the instantaneous streamwise vorticity (ωx) and ve-
locity vectors at x/h=3.1, Re=154,000 (γ=0◦). (a) I40 model without deflector (no cnotrol); (b) Concept model (new design);
(c) I40 model with deflector. . . 112
7.16 Contours of the instantaneous streamwise vorticity (ωx) and ve- locity vectors on the concept model (new design) at two cross-flow planes (x/h=2.9, 3.1) with magnification (Re=154,000, γ=0◦).
(a) Flow-field near the second off-center ridge; (b) Flow-field near the first off-center ridge. . . 113 7.17 Contours of the time-averaged streamwise vorticity (ωx) and ve-
locity vectors at x/h=3.5, Re=154,000 (γ=0◦). (a) I40 model without deflector (no cnotrol); (b) Concept model (new design). 114 7.18 Contours of the time-averaged streamwise vorticity (ωx) and ve-
locity vectors at x/h=3.7, Re=154,000 (γ=0◦). (a) I40 model without deflector (no cnotrol); (b) Concept model (new design). 115 7.19 Contours of the time-averaged streamwise vorticity (ωx) and ve-
locity vectors at x/h=3.9, Re=154,000 (γ=0◦). (a) I40 model without deflector (no cnotrol); (b) Concept model (new design). 116 7.20 Contours of the time-averaged streamwise vorticity (ωx) and ve-
locity vectors at x/h=4.1, Re=154,000 (γ=0◦). (a) I40 model without deflector (no cnotrol); (b) Concept model (new design). 117 7.21 Contours of the time-averaged streamwise vorticity (ωx) and ve-
locity vectors at x/h=4.3, Re=154,000 (γ=0◦). (a) I40 model without deflector (no cnotrol); (b) Concept model (new design). 118 7.22 Contours of the time-averaged streamwise vorticity (ωx) and ve-
locity vectors at x/h=4.5, Re=154,000 (γ=0◦). (a) I40 model without deflector (no cnotrol); (b) Concept model (new design). 119
Nomenclature
Roman Symbols
Af frontal area of the model Ap planform area of the model
B buoyancy force
CD drag coefficient
CL lift coefficient CS side force coefficient
D drag force
Fh horizontal force
Fv vertical force
g gravitational acceleration
h height of the model
L lift force
l length of the model
m body mass
Re Reynolds number
Reh Reynolds number based on the model height
u streamwise velocity
U0 free-stream velocity
VO body volume
v vertical velocity
w spanwise velocity
x, y, z cartesian coordinate with the origin at the center of the model
trailing edge in Part I
Cartesian coordinate with the origin at the center of the front edge
in Part II
Greek Symbols
α angle of attack
γ yaw angle
∆ variation rate
θ pitching angle
ν kinematic viscosity
νsea kinematic viscosity of sea water
ρ density of air
ρ density of sea water
ωx streamwise vorticity ωz spanwise vorticity Abbreviations
DPIV digital particle image velocimetry
FoV field of view
Part I
Hydrodynamic role of longitudinal ridges
in a leatherback turtle swimming
Chapter 1
Introduction
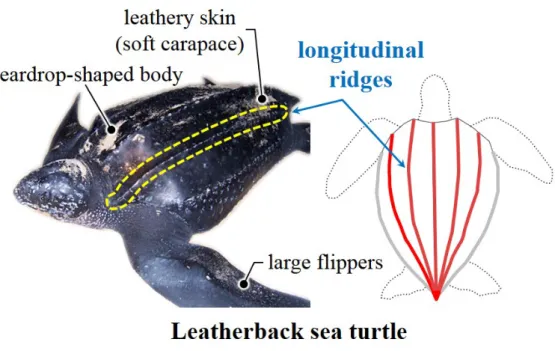
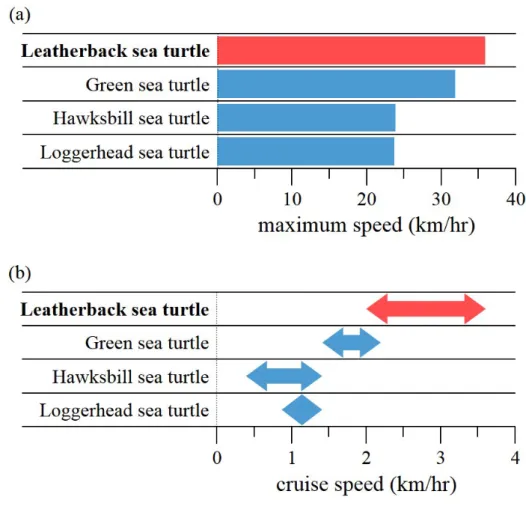
Leatherback sea turtles (Dermochelys coriacea) are known as the largest and heaviest turtle in the earth (Figure 1.1). Despite of their enormous body size, (Figure 1.2) shows that leatherback sea turtles are also known as the fastest swimmer and the deepest diver among marine turtles therefore they are known to have superior diving ability (Lutcavage & Lutz, 1996; Hays, Houghton & My- ers, 2004; Reina et al., 2005). They are also known for long-distance migration (Figure 1.3) and considered to be highly adapted to pelagic swimming (Keinath
& Musick, 1993; Hays, Houghton & Myers, 2004; Fossette et al., 2010; Block et al., 2011; Shillingeret al., 2011). On the body of leatherback turtles, there are a few remarkable morphological features such as soft carapace, big flippers, and longitudinal carapace ridges that distinguish them from other marine turtles (Eckert et al., 1989). Among these, five longitudinal ridges on their carapace are a notable feature (Figure 1.4). Some conjectured that these ridges repre- sent an evolutionary adaptation for keeping the flow around the body laminar (Deraniyagala, 1936; Hendrickson, 1980). However, no study has been made for their hydrodynamic roles yet. Some of natures morphological features have been shown to provide better aero- and hydrodynamic performances. For example, dorsal and ventral keels of a boxfish generate streamwise vortices, and these vor- tices are considered to increase the hydrodynamic stability (Bartol et al., 2002, 2003, 2008); tubercles on the leading edge of a humpback whales flipper increase
the lift by generating streamwise vortices and delaying separation (Miklosovic et al., 2004; Fish & Lauder, 2006; Pedro & Kobayashi, 2008); an alula on the leading edge of a birds wing produces a streamwise vortex and increases the lift (Lee et al., 2015); a serrated leading edge of an owls feather also produces streamwise vortices to fly silently (Anders, 2000; Choi et al., 2012); spade-like protrusions on the trailing edge of a dragonfly wing provide an idea for reducing drag on an airfoil with a gurney flap (Bechert, Meyer & Hage, 2000). All of these morphological features are located on the leading edges of the wing and flipper, on the frontal part of the body, and on the trailing edge of the wing.
Unlike these morphological features, the longitudinal ridges of a leatherback sea turtle are located along the entire body. In this respect, the hydrodynamic roles of ridges in leatherback turtles swimming should be interesting to inves- tigate. Therefore, in the present study, I investigate their hydrodynamic roles in the conditions that represent the swimming modes of hatchling and adult leatherback turtles.
Prior to investigating the effect of the longitudinal ridges in the leatherback turtles’ ecological point of view, it is first necessary to know the behavioral characteristics of leatherback turtles with respect to their stages of growth.
Therefore, in Sec. 1.1, diving behaviors of adult leatherback turtles is briefly reviewed and I describe typical diving characteristics and major hydrodynamic issue of adults. In Sec. 1.2, some previous studies about the swimming pat- terns of hatchling leatherback turtles and I describe representative swimming characteristics and major hydrodynamic issues in hatchlings’ swimming. The objectives of this dissertation are given in Sec. 1.3
1.1 Behavioral characteristics of adult leatherback turtles
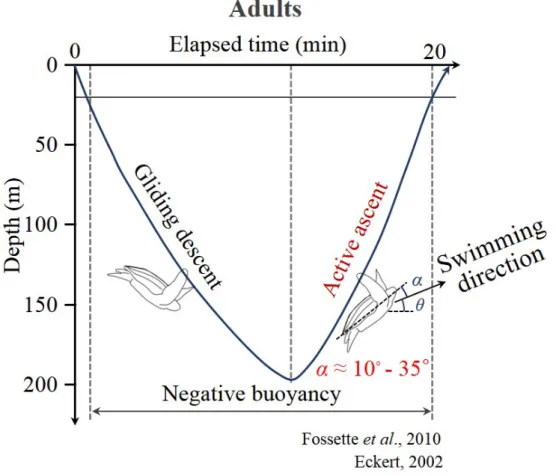
The diving patterns of leatherback turtles are divided into the V-shaped diving, U-shaped diving, and sub-surface swimming according to the shapes of the diving profile (Eckert, 2002; Reina et al., 2005; Casey et al., 2010; Fos- sette et al., 2010) (see, for example, Figure 1.5). The V-shaped diving, used for foraging and transit, is a typical diving pattern of adult leatherback tur- tles(Eckert, 2002; Reina et al., 2005; Casey et al., 2010; Fossette et al., 2010).
Breath-hold divers such as leatherback turtles have no buoyancy-control organ and thus experience negative buoyancy in deep water due to the compression of pulmonary air by water pressure (Davis & Weihs, 2007; Fossette et al., 2010).
This negative buoyancy enables diving, so their descending swim can be largely energy-efficient (Davis & Weihs, 2007; Fossette et al., 2010). In contrast, they have to actively swim up at high pitch angles (or high angles of attack) during the ascending period to overcome the negative buoyancy (Fossette et al., 2010).
Therefore, the hydrodynamic performance in ascending swimming conditions at positive angles of attack can be energetically important for the leatherback turtles.
1.2 Behavioral characteristics of hatchling leatherback turtles On the other hand, hatchling or juvenile leatherback turtles cannot dive as deep as adults since they cannot hold their breath for a long time due to the low tissue volume for oxygen storage and high mass-specific metabolic rates (Wyneken & Salmon, 1992; Salmon, Jones & Horch, 2004). Therefore, hatch- lings swim mainly in shallow water (Salmon, Jones & Horch, 2004). Their swimming patterns are divided into a routine swimming (slow) near the water surface and a vigorous swimming (fast and large energy consuming) underwa-
ter (Davenport, 1987) (see, for example, Figure 1.6). The vigorous swimming is important for hatchlings as it provides a means to overcome positive buoyancy and escape from predators (Davenport, 1987; Bjorndal, Bolten & Chaloupka, 2003). Therefore, the hydrodynamic characteristics during the vigorous swim- ming (swimming at large negative angles of attack) should also be considered to fully understand the roles of the longitudinal ridges.
1.3 Objectives
The main objectives of the present study are to investigate the hydrodynamic role of longitudinal dorsal ridges in a leatherback turtle swimming and reveal the mechanisms responsible for improvement in hydrodynamic performances of both hatchlings and adults. For these purposes, I constructed carapace mod- els of a leatherback turtle with and without the longitudinal ridges based on a geometric information of a stuffed leatherback turtle at National Science Mu- seum, Daejeon, Korea, and the drag and lift forces on both models are directly measured by varying the Reynolds number and angle of attack. The flow fields near the models are observed using oil-surface visualization and DPIV (Digital particle image velocimetry).
This paper is organized as follows. In Chapter 2, details on the experimental set-up for the force measurement, flow visualization and DPIV measurement are described. In Chapter 3, experimental results of the hydrodynamic role of the ridges with respect to each swimming mode of hatchlings and adults are given and discussed. Investigation about the modifications of flow structures by the ridges are also discussed here. Finally, the summary and concluding remarks are followed in Chapter 4.
Figure 1.1. Morphological characteristics and longitudinal dorsal ridges of a leatherback sea turtle.
Figure 1.2. Averaged body length of various sea turtles.
Figure 1.3. (a) Maximum swimming speed of sea turtles (b) Cruise swimming speed variations of sea turtles.
Figure 1.4. Migration routes of leatherback sea turtles.
Figure 1.5. Schematic diagram of swimming patterns of hatchling leatherback turtles (Davenport, 1987).
Figure 1.6. Schematic diagram of diving patterns of adult leatherback turtles (Fossette et al., 2010).
Figure 1.7. Variation of the Reynolds number in leatherback turtle swimming based on the carapace length and different stages of growth. Carapace length of hatchlings is about 24 cm at Re = 2 × 10⁵ (Davenport, 1987) and carapace length of adults is about 1 m at Re = 5 × 10⁵ (Eckert, 2002). The present measurement range is drawn in dashed gray line.
Chapter 2
Experimental Set-up
To investigate the hydrodynamic role of the longitudinal ridges of a leatherback turtle, a carapace model is constructed based on a three-dimensional surface data of a stuffed leatherback turtle. The three-dimensional forces on both mod- els are directly measured using three force sensors. The flow fields near both models are obtained using a oil-surface visualization method and a DPIV (Digi- tal particle image velocimetry). Sec. 2.1 gives an account of how the leatherback turtle models with and without the ridges are constructed. The experimental set-up for the force measurement and the measurement accuracy are discussed in Sec. 2.2. Detailed descriptions of the oil-surface visualization and the DPIV system are followed in Sec. 2.3. and Sec 2.4, respectively.
2.1 Leatherback turtle models
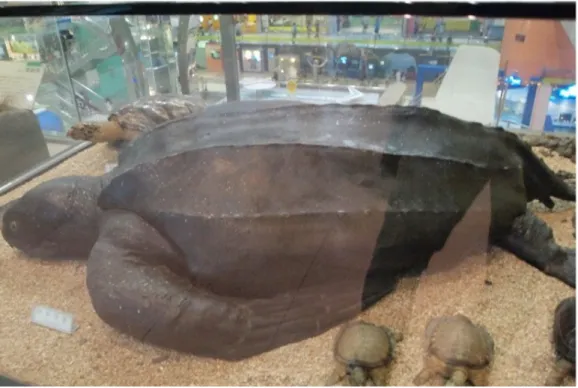
I constructed a carapace model based on three-dimensional surface data obtained by scanning a stuffed leatherback turtle (carapace length of 1.2 m, adult) at National Science Museum, Daejeon, Korea (Figure 2.1). According to previous observations, leatherback turtles have a relatively narrow range of motion in their neck and thus their head does not noticeably move relative to the carapace during swimming (Davenport, 1987; Oliver et al., 2000). As for fore flippers, leatherback turtles show only synchronous flapping during linear
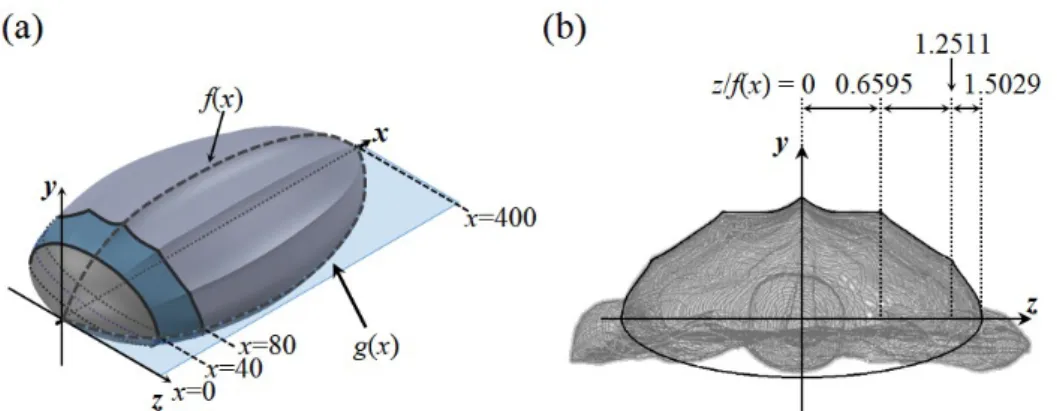
progression (Renous, Bels & Davenport, 2000; Wyneken, 1996). For this reason, I assumed that the motions of head and flippers do not noticeably affect the flow near the carapace, and thus we eliminated the head and limb parts in the process of constructing a carapace model. The carapace model was constructed such that its shape was similar to the body shape of the stuffed leatherback turtle. First, we measured the profile of the longitudinal ridge at the center (z = 0) of the stuffed leatherback turtle, and obtained a smooth profile of the ridge by applying a least square method based on 8th-order polynomials,
f(x) =−(1.063883×10−17)x8+ (2.29149×10−14)x7−(2.01994×10−11)x6 + (9.4706×10−9)x5−(2.57744×10−6)x4+ (4.16672×10−4)x3
−(4.02333×10−2)x2+ 2.330198x+ 8.43726
(2.1) where 0 ≤ x ≤ 400. The spanwise edge of the carapace was located at g(x) = 1.5029f(x) (see Figure 2.2).
The upper surface of the carapace model was divided by three parts in the streamwise direction: 0≤x≤40, 40 < x <80, 80≤x≤400, the carapace has three curved surfaces in the spanwise direction because of the ridges (Figure 2.2(b)), and thus each surface was modeled using a least square method based on 5th-order polynomials:
y(x, z)/f(x) =5.4413(z/f(x))5−8.192(z/f(x))4+ 3.2192(z/f(x))3 + 0.90984(z/f(x))2−0.805812(z/f(x)) + 1,
f or0≤z/f(x)≤0.6595
(2.2)
y(x, z)/f(x) =−9.06338(z/f(x))5+ 47.32(z/f(x))4−97.136(z/f(x))3 + 98.2152(z/f(x))2−49.6478(z/f(x)) + 10.9469, f or0.6595< z/f(x)≤1.2511
(2.3)
y(x, z)/f(x) =−3284.22(z/f(x))5+ 22372.098(z/f(x))4−60931.94(z/f(x))3 + 82938.25(z/f(x))2−56421.49(z/f(x)) + 15347.283,
f or1.2511< z/f(x)≤1.5029
(2.4) For 0≤x≤40, a smooth surface without the ridges was constructed using an ellipse following the body shape of the stuffed leatherback turtle:
y(x, z)/f(x) =0.8925p
1−0.44275(z/f(x))2 f or0≤z/f(x)≤1.5029
(2.5)
For 40 < x < 80, a surface shape of the carapace from smooth (y2, z2) to curved (y1, z1) surface was constructed using a weighting factor between these two surfaces:
y=y2+ (y1−y2) log2 x 40 z =z2+ (z1−z2) log2 x
40
(2.6)
Here, (y1, z1) was first obtained for 40 < x < 80 using Eq. (2.3-2.5), and then (y2, z2) was obtained from
y1/f(x) =0.8925(1−0.44275(z2/f(x))2)1/2(1−2.8355z2/f(x)−z1/f(x) z2/f(x) y2/f(x) =0.8925p
1−0.44275(z2/f(x))2
(2.7) The lower surface of the stuffed leatherback turtle was modeled using an ellipse:
y(x, z)/f(x) =−0.5p
1−0.44275(z/f(x))2
f or0≤x≤400,0≤z/(f(x)≤1.5029
(2.8)
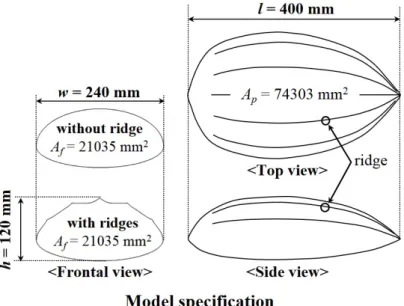
As I show in this paper, I observe that a separation bubble exists in the front part of the carapace surface at the swimming mode of active ascent (Figure 3.20, 21). Therefore, I made another set of carapace models including the head part by scanning a leatherback turtles head (Figure 2.9), to see how the head affects the flow over the carapace. The length of the carapace model (l) was 400 mm, which was 1/3 scale of the carapace of the stuffed leatherback turtle. We also constructed a carapace model without the ridges (i.e. smooth surface model) for comparison by keeping the frontal (Af) and planform (Ap) areas the same as those of the model with the ridges. In my analysis, I also assumed that hatchlings and adults are geometrically similar (Prange, 1976). Thus, I used same carapace models to investigate the hydrodynamic roles of the ridges for different swimming modes of both hatchlings and adults, although the present carapace models were constructed from the geometric information of an adult leatherback turtle.
2.2 Force measurements
The lift (L) and drag (D) forces on the carapace models with and without the ridges were measured in a wind tunnel. Various Reynolds numbers (Re) and angles of attack (α) were chosen considering the swimming conditions of both hatchling and adult leatherback turtles (Figure 1.5, 1.6). The angles of attack (angle between the swimming direction and the body alignment) considered were -22◦ − 22◦, and the Reynolds numbers (Re = U0l/ν) were 0.2 1.2 × 10⁶, where U0 is the free-stream velocity, l is the model length, and ν is the kinematic viscosity of air. The lift (L), drag (D) and side (S) forces on both models were measured simultaneously with three load cells (A&D LCB03-015M for the lift force and A&D LCB03-006M for the drag force and A&D LCB03- 003M for the side force) (Figure 2.7). Resolutions of these three load cells were 0.015 N 0.006 N and 0.003 N with maximum capacities of 150 N, 60 N and 30 N, respectively. The signals from these load cells were digitized by an A/D converter (PXI-6259, National Instruments Co.) and sampled for 60 s at a rate of 10 kHz to obtain the mean value. The repeatability errors of force measurements were within 2%. The lift (CL) and drag (CD) coefficients were defined asCL=L/(0.5ρU02Ap),CD =D/(0.5ρU02Ap),CS =S/(0.5ρU02Ap) respectively, whereρis the air density, andAp is the planform area of the model at α = 0◦. The carapace model was fixed using a strut which was directly mounted to the load cells (Figure 2.5). The wind tunnel used was a closed-type wind tunnel (Gottingen type) whose test section size was 900 mm × 900 mm.
The blockage ratios due to the model were about 2.6% and 4.1% forα= 0◦ and α = 22◦, respectively. To minimize the disturbance from the strut, its cross- section was designed to be an ellipse with a ratio of major to minor axis of 2.
The height of the strut was adjusted to locate the carapace model at the center
of the wind tunnel. The force on the isolated strut was measured separately and used for correction from those measured with the model. In the presence of ocean current or during turning motion of a turtle, the swimming direction does not coincide with the freestream direction. This effect was examined by considering the yaw angle (γ) as shown in Figure 2.5. For non-zero γs, we measured the side forces in addition to the drag and lift forces.
2.3 Oil-surface visualization
In order to obtain qualitative flow features such as the separation of the boundary layer and streamlines on the model surface, the oil-surface visualiza- tion is performed. The wind tunnel used in the experiment is a closed-type wind tunnel that has the cross-section of 900 mm × 900 mm after contraction (see Figure 2.6 for details) and the turbulence intensity is lower than 0.5% at the free-stream velocity of 10 m/s. The blockage ratios of the cross-sectional area of both models to the test-section area are about 2.6% and 4.1% for α= 0◦ and α
= 22◦ respectively, which are below the critical value ensuring negligible block- age effect on the flow field (Achenbach, 1974). The oil used for visualization is made by mixing lamp oil and soybean oil and a dash of titanium dioxide is added to make the oil white. A digital camera (Nikon D7100), whose frame rate is 60 fps at a resolution of 1920 ×1080 pixels, is used to capture the resulting flow field.
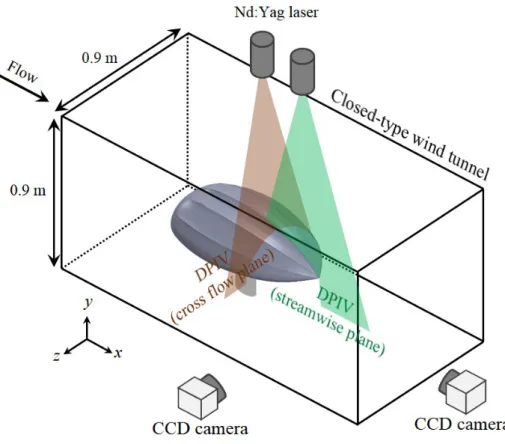
2.4 Digital particle image velocimetry
I used a digital particle image velocimetry (DPIV) to obtain the velocity and vorticity fields around the carapace models with and without the ridges. The measurements were performed for two cases, α= -22◦ and Re= 2 ×10⁵, and α
= 18◦andRe= 5 105, which represent the vigorous swimming of hatchlings and the active ascending swimming of adults, respectively. The same wind tunnel used for force measurements was used. The schematic diagram for DPIV is shown in Figure 2.8. The DPIV system consisted of an Nd:Yag laser (Dual Power 135-15, Litron), a laser optics (Short Mirror Arm, Dantec Dynamics), a pulse generator (IDT USB Timing Hub XS-TH, Integrated Design Tools), a fog generator (F2010, Safex), and a CCD camera mounted with an optical lens (APO MACRO 180mm F2.8, SIGMA). A thickness of a laser sheet generated by the laser optics was about 2 mm. The fog generator produced liquid droplets which were spread inside the wind tunnel and their mean diameter was about 1 µm. The velocity measurements were performed on various planes parallel to the x − y and y − z planes, respectively, where x, y, and z denote the streamwise, vertical, and spanwise directions, respectively, and the origin was located at the center of rear edge of the model. To obtain the velocity field from recorded images, an iterative cross-correlation analysis was performed with an initial window size of 64 × 64 pixels and a final interrogation window size of 16 × 16 pixels. The interrogation window was overlapped by 50%, leading to spatial resolutions of about 0.15 mm (3.75 × 10⁻⁴ l) on x−y planes and 0.23 mm (5.75×10⁻⁴ l) ony−z planes, where lis the model length. To obtain the time-averaged flow field, 2,000 pairs of images were collected and processed.
Figure 2.1. A stuffed leatherback turtle in National science museum, Daejeon, Korea which is used for three-dimensional surface measurement.
Figure 2.2. Construction of the carapace model. (a) Perspective view; (b) Cross-sectional view.
Figure 2.3. Carapace model specification. Characteristic lengths and areas of the carapace models.
Figure 2.4. (a) Three dimensional drawing of the carapace model; (b) Assem- bly diagram of the carapace model. Note that the model body is illustrated transparently for clarity.
Figure 2.5. Schematic diagram of the experimental set-up for the force mea- surement. Here,L, D, andS denote the lift, drag, and side forces, respectively, and γ is the yaw angle.
Figure 2.6. Detailed drawing of the force measurement system.
Figure 2.7. Schematic diagram of the experimental set-up for the velocity mea- surement with DPIV.
Figure 2.8. Carapace models with the head. (a) Perspective view; (b) Top and side views. The shape of the head was constructed based on the three- dimensional surface data of a stuffed leatherback turtle.
Chapter 3
Results and Discussion
I conducted a series of wind tunnel tests to measure the drag and lift forces on the models with and without the ridges (see Experimental Set-up (Force measurements) and Figure 2.5 for detailed setup). The Reynolds numbers con- sidered were Re = 0.2 1.2 × 10⁶ (based on the body length l of each model) with varying the angle of attack from α = -22◦ to 22◦. TheseRe and α ranges include swimming conditions of hatchling and adult leatherback turtles (Fig- ure 1.5, 1.6). I also considered non-zero yaw angles for γ = -22◦ and 18◦, and measured the side forces (Figure 2.5).
3.1 Lift and drag variations
Figure 3.1-3.6 shows the variations of the drag and lift coefficients (CD and CL, respectively; see Experimental Set-up (Force measurements) for their definitions), and lift-to-drag ratio (L/D) depending on the angles of attack (α) and the Reynolds numbers (Re). These figure demonstrates two noticeable hydrodynamic roles of the ridges. First, the ridges significantly reduce the drag and also reduce the negative lift at negative to near zero angles of attack (Figure 3.1, 3.2). Especially, at low Reynolds numbers, the drag is reduced by up to 32% atα = -18◦ (Figure 3.4). In the vigorous swimming, hatchling leatherback turtles adopt a head down/tail up posture at which the attack angle of the body
is about -22◦ (Davenport, 1987). At this large negative angles of attack, the drag is large and the lift is negative (as shown in Figure 3.4,3.5). Our results suggest that the ridges reduce this high drag force generated during the vigorous swimming of hatchlings.
Second, at positive high angles of attack, the ridges increase both the drag and lift forces, and the lift-to-drag ratio (Figure 3.1-3.3). Especially, at relatively high Reynolds numbers, the lift coefficient and lift-to-drag ratio increase by up to 16% and 7%, respectively, whereas the drag coefficient increases by 5.6%
(Figure 3.4-3.6).
3.2 Importance of the hydrodynamic force variations for hatchlings Let me estimate the importance of these drag and negative-lift reductions (Figure 3.4,3.5) for a hatchling leatherback turtle during the vigorous swim- ming. At Re = UOl/ν = 2 × 10⁵, the swimming speed (UO) and body length (l) of a hatchling leatherback turtle are obtained to be UO = 0.783 m/s ( 3.3 l/s) (Davenport, 1987) and l = 23.8 cm (the shortest body length of a hatch- ling leatherback turtle is known to be 9 cm (Davenport, 1987)), where the kinematic viscosity of sea water is νsea = 0.932 10−6 m2/s (El-Dessouky &
Ettouney, 2002) and the density of sea water is ρsea = 1030 kg/m3. Its body mass (m) is 1.89 kg (Jones et al., 2011), body volume (VO) is 1.94 × 10⁻³ m3 (Fossetteet al., 2010; Lutcavage, Bushnell & Jones, 1992), and planform area is Ap = 0.0260 m2. Since I do not find any information of the measured thrust of a leatherback turtle during the vigorous swimming, I estimate it based on the thrust of a vigorously swimming green sea turtle (Chelonia mydas) assuming that the vigorous swimming is a typical swimming pattern of sea turtle hatch- lings (Davenport & Clough, 1986). According to Davenport et al. (Davenport,
Munks & Oxford, 1984), the body length of a green sea turtle hatchling is 11 cm, and its thrust during the vigorous swimming is 0.61 N (average thrust over 5 s). Then, the thrust of a vigorously swimming leatherback turtle is estimated to be about 2.86 N, assuming that the thrust is proportional to the square of the body length (Watson & Granger, 1998). The drag coefficients atRe = 2× 10⁵ and α = -22◦ are 0.127 and 0.15 with and without the ridges, respectively.
Thus, the amount of drag reduction by the longitudinal ridges is about 0.19 N, which is 6.6% of the thrust force during the vigorous swimming. Therefore, the amount of drag reduction by the ridges is quite remarkable during the vigorous swimming.
On the other hand, the lift coefficients during the vigorous swimming (Re
= 2 × 10⁵ and α = -22◦) are -0.291 and -0.331 with and without the ridges, respectively. Then the lift forces during the vigorous swimming with and with- out the ridges are -2.39 N and -2.72 N, respectively. The buoyancy force by sea water on a hatchling leatherback turtle is B =ρseaVOg= 19.6 N. Therefore, the net forces on the hatchling turtles with and without the ridges are B mg +L
= -1.33 N and -1.66 N, respectively. This analysis shows that the longitudinal ridges reduce negative net vertical force by about 20% but still maintain neg- ative value of the vertical force on the body of a hatchling leatherback turtle.
Unnecessarily large net vertical force can make it difficult for hatchlings to con- trol the swimming direction. Therefore, the reduced negative net vertical force can be beneficial for vigorously swimming hatchlings.
On the other hand, vigorously swimming hatchlings show large periodic flip- per motions, resulting in non-uniform swimming speed (Davenport, 1987). The range of swimming speed is 0.738 - 1.714 m/s (3.1 7.2 l/s) (Davenport, 1987) for the body length (l) of 23.8 cm, whose corresponding Reynolds numbers are Re= 1.9 4.4× 10⁵. At these Reynolds numbers and α = -22, the longitudinal
ridges reduce the drag and increase the lift (Figure 3.4,3.5), indicating that the hydrodynamic performance of the ridges is still maintained during the flipper motion.
3.3 Importance of the hydrodynamic force variations for adults During active ascending swimming, the angle between the swimming and horizontal directions (θ in Figure 1.5) is 20◦ − 30◦ (Fossette et al., 2010). So, the changes in the forces opposite and perpendicular to the gravity direction (Fv = Lcosθ −Dsinθ and Fh = Lsinθ +Dcosθ, respectively), and their ratio due to the ridges are also similar to those of L,D and L/D, respectively:
e.g., for θ = 30◦, Fv and Fv/Fh increase by 18% and 5%, respectively. High Reynolds numbers are characteristic of the swimming mode of active ascent by adult leatherback turtles in the V-shaped diving (Fossette et al., 2010). These results suggest that the hydrodynamic performance can be enhanced by the ridges in the V-shaped diving where lift generation is required due to negative buoyancy during most of their ascent. Therefore, the longitudinal ridges on the carapace of leatherback turtles provide superior hydrodynamic performance by reducing the drag in hatchlings swimming and generating additional lift in adults swimming.
3.4 Flow-filed measurements for the case of hatchlings
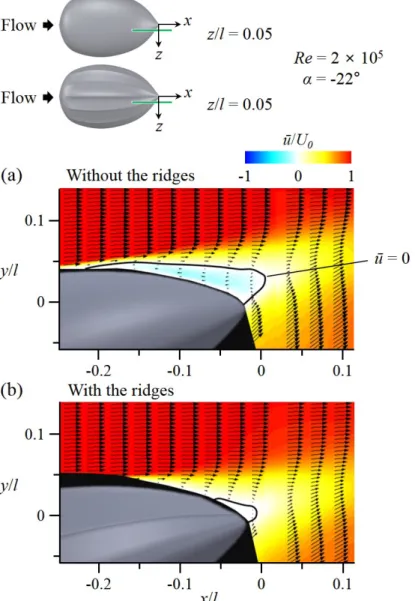
I conducted velocity measurements using DPIV to investigate the modifi- cations of flow structures by the longitudinal ridges. Measurements were per- formed at two conditions, α = -22◦ and Re = 2 × 10⁵, and α = 18◦ and Re
= 5 × 10⁵, that are characteristic of the vigorous swimming of hatchlings and the active ascending swimming of adults, respectively (see Experimental Set-up
(Flow-field measurements) and Figure 2.8 for the experimental set-up). Figure 3.7-3.18 shows the flow fields atα= -22◦ andRe= 2×10⁵(vigorous swimming of hatchlings) at which the ridges reduced the drag by 15.5% and increased the lift by 12% (see Figure 3.4, 3.5). As shown in Figure 3.7-3.10, the flow separates at rear part of the body (separation starts from x/l = -0.21) in the absence of the ridges. With the ridges, flow separation is significantly delayed (there is no separation at z =z1 and separation starts fromx/l = -0.06, -0.18, and -0.12 at z =z2, z3, andz4, respectively), which is the main reason of drag decrease and lift increase by the ridges. To understand the mechanism of separation delay by the ridges, the contours of instantaneous vorticity and velocity vectors on four cross-flow (y−z) planes are drawn in Figure 3.15-3.18. In the absence of the ridges, the shear layer instability occurs after flow separation (see the flow at x
=x3) and strong streamwise vortices are generated at a downstream location (x
=x4). On the other hand, with the ridges, flow locally separates across the first off-center ridge at x =x1 because this ridge is not aligned to local streamlines.
Then, a shear layer evolves, and streamwise vortices are generated at x = x2
and get stronger further downstream. These strong streamwise vortices bring momentum to the flow near the surface, and enable the flow to resist the adverse pressure gradient and to delay the separation. Although the local separation at x=x1 increases the drag, the drag reduction from the main separation delay is much larger than this drag increase, resulting in a significant decrease of total drag. Therefore, the mechanism responsible for main separation delay by the ridges is the generation of streamwise vortices through a local separation by the ridges (figure 3.19).
3.5 Flow-field measurements for the case of adults
Figure 3.20-3.36 shows the flow fields atα = 18◦ and Re= 5 × 10⁵ (active ascending swimming of adults) at which both the drag and lift are increased by 5.6% and 11%, respectively, thereby resulting in the increase of the lift- to-drag ratio by 5% by the ridges. From the oil-surface visualization (Figure 3.20,3.21), separation and reattachment lines denoted as solid and dashed red lines, respectively, are formed at the front part of the body in the absence of the ridges. On the other hand, with the ridges, separation occurs only locally near the centerline of the front part. At the rear part of the body, however, it was almost impossible to identify flow structures from the surface-oil visualiza- tion because the oil moved downward due to the steeply inclined rear surface.
Therefore, separation lines are obtained from velocity measurements above the rear surface (Figure 3.30-3.35). Figure 3.36 shows that the separation line on the rear surface is broadened with the ridges. This result indicates that the ridges suppress the formation of separation bubble existing on the front surface but enhance the separation on the rear surface. Without the ridges, the sepa- ration bubble observed on the front surface is similar to that on a low Reynolds number airfoil causing its performance deterioration (Lissaman, 1983; O’Meara
& Mueller, 1987; Kerho et al., 1993). Thus, with the ridges, the hydrodynamic performance is increased owing to the reduced separation bubble on the front surface. To explain the suppression of front-body separation by the ridges, con- tours of the instantaneous streamwise vorticity on four y−z planes for both models are shown in Figure 3.22-3.29. In these figures, the spanwise domain is in between the first and second off-center ridges (figure 3.22-3.25), where weak separation exists without the ridges and no separation occurs with the ridges (Figure 3.20,3.21). Without the ridges, flow separation is so weak that there
is no strong shear layer evolution. On the other hand, the second off-center ridge which is misaligned with local streamlines produces local flow separation in the spanwise direction at x1. Then, as the fluid flows downstream, strong streamwise vortices are produced at x2 x4. These streamwise vortices enable the flow to resist the adverse pressure gradient by supplying momentum to the flow near the surface, which in turn removes the separation on the front sur- face in between the first and second off-center ridges. Although a part of the separation bubble is suppressed by the ridges, the drag force on the model with the ridges is greater by 5.6% as compared to that without the ridges. This is because the flow separates earlier on the rear surface with the ridges than without the ridges (Figure 3.32-3.38). The early separation at z/l = 0.04 is caused by the ridge itself (Figure 3.34). Therefore, this broadened separated region on the rear surface with the ridges leads to the increase in the form drag because this part of surface is nearly vertical at this high angle of attack. On the other hand, as discussed above, the ridges suppress the separation bubble at the front surface where the surface is nearly horizontal, and thereby enhance the lift force by 11%. This increase in the lift contributes to the increase in the lift-to-drag ratio, although the drag is increased.
3.6 Effect of a yaw angle variation
In the presence of ocean current or during turning motion of a turtle, the swimming direction does not coincide with the freestream direction. To examine this effect, we measure the drag, lift and side forces by varying the yaw angle from γ = 0◦ to 30◦ (Figure 2.25) for both the vigorous and active ascending swimming, and present their variations in Figure 3.37(a). At α = -22◦ and Re
= 2 × 10⁵ (vigorous swimming of hatchlings; Figure 3.37a), the ridges reduce