저작자표시-비영리-변경금지 2.0 대한민국 이용자는 아래의 조건을 따르는 경우에 한하여 자유롭게
l 이 저작물을 복제, 배포, 전송, 전시, 공연 및 방송할 수 있습니다. 다음과 같은 조건을 따라야 합니다:
l 귀하는, 이 저작물의 재이용이나 배포의 경우, 이 저작물에 적용된 이용허락조건 을 명확하게 나타내어야 합니다.
l 저작권자로부터 별도의 허가를 받으면 이러한 조건들은 적용되지 않습니다.
저작권법에 따른 이용자의 권리는 위의 내용에 의하여 영향을 받지 않습니다. 이것은 이용허락규약(Legal Code)을 이해하기 쉽게 요약한 것입니다.
Disclaimer
저작자표시. 귀하는 원저작자를 표시하여야 합니다.
비영리. 귀하는 이 저작물을 영리 목적으로 이용할 수 없습니다.
변경금지. 귀하는 이 저작물을 개작, 변형 또는 가공할 수 없습니다.
치의과학석사 학위논문
Study on control of stem cell differentiation and tissue regeneration by synthetic
peptide
합성 펩타이드에 의한 줄기세포 분화 조절 및 조직재생 연구
2017년 2월
서울대학교 대학원
치의과학과 치의재생생명공학전공 이 동 우
Abstract
Study on control of stem cell differentiation and tissue regeneration by synthetic
peptide
Dong Woo Lee
Dental Regenerative Biotechnology Major Graduate school, Seoul National University (Supervised by Professor Yoon Jeong Park)
Stem cells are undifferentiated cells that can infinitely regenerate and differentiate into cells of all tissues in the body. Currently, research on tissue regeneration using adult stem cells is being actively conducted in the field of regenerative medicine.
However, due to the limitations of extracorporeal proliferation, it is difficult to obtain a sufficient amount of adult stem cells. In addition, their differentiation ability is relatively low, which is a further disadvantage. To solve this problem, induced pluripotent stem cells (iPSCs) with the characteristics of embryonic stem cells have been developed by the Yamanaka group by
dedifferentiating and reprogramming differentiated somatic cells.
Because iPSCs are produced from somatic cells of the adult, there are no ethical issues, and their ability to self-reproduce is excellent, allowing a large number of cells to be supplied.
However, the currently representative iPSCs manufacturing techniques cannot risk using viruses to alter cells, and thus, the cells must be altered by proteins or other methods . However, proteins have been demonstrated to exhibit low cell reprogramming efficiency. To improve the reprogramming efficiency, essential reaction conditions for reverse reprogramming have been explored. In this study, experiments were conducted to promote reprogramming using synthetic peptides.
To apply iPS cells and stem cells in the tissue regeneration field, differentiation into the final tissues, such as bone and cartilage, must be performed.
Recently, it has been reported that NF-κB promotes epithelial-mesenchymal transition (EMT), and mesenchymal-epithelial transition (MET) is essential for reprogramming cells to form iPSCs. To improve the reprogramming efficiency, which is a useful cell therapy technique for clinical application of iPSCs, functional peptides inhibiting NF-κB activity have been identified. It was confirmed
that these peptides activated MET by inhibiting NF-kB, eventually promoting cellular reprogramming. The Yamanaka factors were injected into human dermal fibroblasts using a nucleofection method, and then, cells were further treated with the synthetic peptides.
In the peptide-treated groups, the expression levels of MET markers and pluripotency markers were higher than in the negative control group, and it was confirmed that relatively more iPS cells were formed at an early stage in the peptide-treated groups. At the same time, NF-κB expression was decreased.
Thus, it might be considered that functional peptides have been shown to inhibit the translocation of intracellular NF-κB into the nucleus, thereby inhibiting EMT, resulting in the promotion of the opposite process, MET, followed by enhancement of reprogramming efficiency.
Recently, tissue regeneration through stem cell differentiation has been attempted in the dental field. It has been verified through various experiments that the protein copine 7 (CPNE7) is a key factor for differentiating dental pulp stem cells (DPSCs) into dentin. It is also known that non-dentin mesenchymal stem cells can be differentiated into dentin and cementum using CPNE7 protein. CPNE7 has been applied for dentin regeneration.
However, in this study, CPNE7 was employed as a bone forming substance. In addition, the identification of key amino acid sequences of CPNE7 was of interest in this study. In this study, a CPNE7-derived peptide was used to maximize biocompatibility and increase the regeneration of the jawbone and gum bones in the elderly.
CPNE7 consists of two domains, a C2 domain and a von
Willebrand factor type A (vWA) domain. The C2 domain targets the extracellular lipid membrane and promotes intracellular transfer of specific proteins. It is also known as a domain that is stabilized through the binding of 2 ~ 3 calcium ions. The vWA domain is known to mediate protein-protein interactions. Based on these domains characteristics, 6 functional peptides sequences were designed and tested to determine if any portion of the peptide could replace the activity of CPNE7.
The cytotoxicity and translocation ability of the candidate peptides derived from CPNE7 were examined. The expression of osteogenic protein factors was also measured. The peptides derived from CPNE7 were named CPNE7-derived peptides (CDPs). Among the candidate peptides, peptides that enabled an increase in osteogenic protein markers were selected based on mineral staining assays with alizarin red S and alkaline phosphatase assays. Furthermore, in an animal model, collagen, a representative biocompatible scaffold, was mixed with a CDP or a comparative group protein, and then, the mixtures were transplanted into a calvarial defect mouse model to confirm bone regeneration.
In the future, application of such peptide-based stem cell differentiation inducers and associated reprogramming control techniques will be helpful for tissue regeneration therapy and cell therapy.
--- Keywords : Stem cell, Synthetic peptide, reprogramming, iPSC, Bone regeneration, CPNE7
Student Number : 2014-25091
Contents
Abstract ··· ⅰ List of Figures ··· ⅷ List of Tables ··· ⅹ
Ⅰ. Introduction ··· 2
Ⅱ. Materials and methods ··· 5
2.1. Experiments to promote reprogramming using synthetic peptides ··· 5
2.1.1 Materials ···5
2.1.2 Cell culture ··· 5
2.1.3 The generation of Xeno-Free iPS Cells ··· 5
2.1.4 Identification of colonization: Alkaline phosphatase staining assay ··· 6
2.1.5 Characterization of reprogrammed cells: Flow cytometry ··· 7
2.1.6 Identification of colonization: Immunofluorescence assay ··· 7
2.1.7 Identification of colonization: Western blot assay ··· 7
2.1.8 Identification of colonization: Quantitative real-time polymerase chain reaction assay ··· 8
2.1.9 Characterization of iPS cells: In vitro Embryoid Body differentiation ··· 9
2.2. Experiments for Bone regeneration using CPNE7-derived peptides (CDPs)··· 9
2.2.1 Materials ··· 9
2.2.2 Synthesis and purification of CDPs ··· 10
2.2.3 Cell culture··· 11
2.2.4 Observation internalization of CDPs using confocal microscopy ··· 12 2.2.5 CDP cell toxicity test: MTT assay ··· 12 2.2.6 In vitro osteogenic differentiation induced by CDPs:
Western blot assay··· 12 2.2.7 In vitro osteogenic differentiation induced by CDP4:
Alkaline phosphatase activity assay··· 14 2.2.8 In vitro osteogenic differentiation induced by CDP4:
Alizarin red S stain assay ··· 14 2.2.9 In vitro osteogenic differentiation induced by CDP4:
Quantitative real-time polymerase chain reaction assay ··· 15 2.2.10 In vitro osteogenic differentiation induced by CDP4:
Western blot assay ··· 16 2.2.11 Surgical procedure for application of CDP4-collagen gel in the mouse calvarial defect model ··· 17 2.2.12 In vivo osteogenesis measured by micro-computed tomography analysis ··· 18 2.2.13 Histological analysis of osteogenesis induced by
CDP4-collagen gel in the calvarial defect ··· 18 2.3 Statistical analysis··· 19
Ⅲ. Results ··· 22 3.1 Synthetic peptides for promotion of cell reprogramming 22
3.1.1 Generation of Xeno-Free iPS cells via peptide transduction in a vitronectin-based feeder-independent culture system ··· 22 3.1.2 Characterization of reprogrammed cells using Flow cytometry ··· 24 3.1.3 Identification of colonization using Alkaline phosphatase (ALP) staining and Immunofluorescence ··· 26
3.1.4 Identification of colonization using western blotting 29
3.1.5 Identification of colonization using PCR ··· 31
3.1.6 Characterization of iPS cells treated with peptides···· 33
3.2 CPNE7-derived peptides for bone regeneration ··· 36
3.2.1 Synthesis CDPs··· 36
3.2.2 Cell translocation efficiency of CDPs··· 38
3.2.3 Viability of cells treated with CDPs··· 40
3.2.4 Osteogenic activity of CDPs in vitro ··· 42
3.2.5 Bone formation induced by CDP4 in a collagen gel · 49 Ⅳ. Discussion & Conclusion ··· 55
Ⅴ. Reference ··· 63
Abstract in Korean ··· 69
List of Figures
Figure 1. Generation of iPS cells using synthetic peptide··· 23
Figure 2. Characterization of reprogrammed cells using Flow cytometry··· 25
Figure 3. Identification of colonization using ALP staining··· 27
Figure 4. Identification of colonization using Immunofluorescence ··· 28
Figure 5. Identification of colonization using western blotting· 30 Figure 6. Identification of colonization using PCR··· 32
Figure 7. Characterization of iPS cells treated with peptides using ALP staining and Immunofluorescence··· 34
Figure 8. Characterization of iPS cells treated with peptides using embryoid body differentiation··· 35
Figure 9. LC/MS results for CPNE7-derived peptides··· 37
Figure 10. Cell translocation efficiency of CDPs ··· 39
Figure 11. Viability of cells treated with CDPs ··· 41
Figure 12. Osteogenic-specific protein expression by CDPs··· 44
Figure 13. Effect of ALP expression by CDP4··· 45
Figure 14. Effect of calcium deposition by CDP4··· 46
Figure 15. Gene expression induced by CDP4··· 47
Figure 16. Protein expression induced by CDP4··· 48
Figure 17. 3D-micro CT images··· 51
Figure 18. Bone volume and Bone mineral density··· 52
Figure 19. H&E staining··· 53
Figure 20. Masson’s trichrome stain··· 54
Figure 21. Overall concept of the complete mechanisms··· 56
Figure 22. CPNE7 protein structure and the 6 peptide domains··· ··· 60
List of Tables
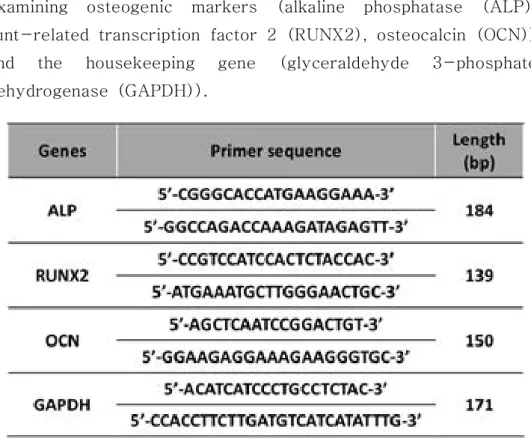
Table 1. The nucleotide sequences of the primers used for examining osteogenic markers··· 20
Table 2. The nucleotide sequences of the primers used for examining fibroblast, EMT, pluripotency and housekeeping gene markers··· 21
Study on control of stem cell differentiation and tissue regeneration by synthetic
peptide
Dong Woo Lee
Dental Regenerative Biotechnology Major Graduate school
Seoul National University
(Supervised by Professor Yoon Jeong Park)
Ⅰ. Introduction
Stem cells are undifferentiated cells capable of unlimited self-renewal and differentiation into cells of all tissues of the body. They are useful tools for developing tissue engineering methods , regenerative medicine and the treatment of human disease. However, despite these advantages, embryonic stem cells still have some challenges for clinical use due to ethical issues and the immune rejection reaction that requires the use of oocytes as cell therapy agents.
To solve this problem, many researchers have been dedicating their efforts on stem cell research, and finally, a new technology for producing iPS (induced pluripotent stem) cells from somatic cells was developed by the Yamanaka group in 2006, and it has caught the world's attention [1, 2].
De-differentiation refers to the process in which already differentiated cells are returned to their undifferentiated state, and this de-differentiation phenomenon is achieved through a series of eugenic regression processes, namely, reprogramming.
Therefore, iPS cells refer to cells that acquire pluripotency similar to embryonic stem cells, which are capable of differentiating into somatic cells through artificial external stimulation. Until now, genetic modification using viruses has been employed for reprogramming of cells. However, using viruses for the production of pluripotent stem cells intended for therapeutic purposes has potential risks. Because the artificial genome enters randomly and very stably, safety issues such as gene mutation are always a concern. In addition, xenopathogens from fetal bovine serum (FBS) and animal-derived feeder cells,
such as mouse embryonic fibroblasts (MEFs), are required for the induction of reprogramming. Therefore, when iPS cell-derived tissue can be transplanted to target organs in the human body, xenopathogens limit the clinical application. After reprogramming adult somatic cells into induced pluripotent stem cells, the embryonic stem cell-specific transcription factors (Oct4, Sox2, c-Myc, and Klf4) are highly induced, but using the gene group as a reprogramming factor is a problem because its efficiency is very low. Therefore, to utilize iPS cells as a cell therapy agent, it is urgently necessary to develop various methods for dramatically improving the efficiency of dedifferentiation and to develop follow-up technologies that can be used for practical applications. Recently, it has been reported that NF-κB promoted epithelial-mesenchymal transition (EMT), and enhancement of mesenchymal-epithelial transition (MET) is necessary for the dedifferentiation of mouse fibroblasts [3, 4].
Therefore, to develop a safe cell therapy agent for clinical applications, functional peptides that inhibit the intracellular NF- κB activity were discovered in this study. Furthermore, it was also confirmed that one of the peptides induces MET and promotes de-differentiation into pluripotent stem cells.
Periodontal regeneration has gained some success with application of bioactive molecules such as bone morphogenetic protein (BMP), platelet-derived growth factor (PDGF) and transcription of intracellular proteins. Although the significant osteogenic potential of growth factors such as BMP and PDGF has been verified, the clinical applications are limited due to possible immunogenicity, alteration of physical properties after
application and complication-related concerns [5, 6]. As an alternative to these proteins, a peptide domain has been suggested because a peptide has sufficient stability and less immunogenicity and is easy to handle when conjugating with biomaterials. [7-9]. In this study, a synthetic peptide derived from CPNE7 protein has been developed.
In a previous study, it was reported that CPNE7, a dental epithelium-derived protein plays an essential role in the commitment of odontoblasts, odontoblast differentiation, and dentin formation [10, 11]. The protein CPNE7 contains two C2 domains and a von Willebrand factor type A domain. The C2 domains of CPNE7 were identified as conventional protein kinase C(PKC) domains and are involved in calcium influx [12-14].
The von Willebrand domain mediates protein-protein interactions [15]. However, these domains of protein CPNE7 have rarely been studied. In this study, peptide domains derived from CPNE7 were synthesized and applied. Because peptides have great advantages, including ease of synthesis and modification and greater penetrating ability than proteins, six domain peptide candidates were developed, and these peptides were compared with CPNE7 protein to assess their differentiation induction ability.
Ⅱ. Materials and methods
2.1 Experiments to promote reprogramming using synthetic peptides
2.1.1 Materials
Eagle’s Minimum Essential Medium (EMEM) was purchased from HyClone (Road Logan, UT, USA). Anti-Oct4, anti-Nanog, anti-Tra-1-60, anti-Cardiomyocyte, anti-Neuron, and anti-Hepatocyte antibodies were purchased from Abcam (Cambridge, UK). Anti-Sox2 was from Santa Cruz Biotechnology, Inc. (Dallas, TX, USA). Human recombinant vitronectin, human dermal fibroblasts, Essential 8 medium and Essential 6 medium kits were purchased from Thermo Fisher Scientific (Waltham, MA, USA). Amaxa Human Dermal Fibroblasts Nucleofector Kit was purchased from Lonza (Basel, Switzerland).
2.1.2 Cell culture
Human dermal fibroblasts were cultivated in Eagle’s Minimum Essential Medium (EMEM) containing 10 % fetal bovine serum (FBS). For iPS cell generation, nucleofected fibroblasts were seeded on vitronectin-coated 6-well plates containing EMEM.
After nucleofection, Essential 8 medium was changed daily until ES cell-like colonies emerged. The fibroblasts and iPS cells were cultured at 37 ℃ under a humidified 95 %: 5 % (v/v) mixture of air and CO2.
2.1.3 The generation of Xeno-Free iPS Cells
To generate iPS cells, first, vectors (Oct4, Sox2, Klf4, cMyc, and Lin28) were transfected into human dermal fibroblasts using Amaxa Human Dermal Fibroblasts Nucleofector Kit (Lonza, Basel, Switzerland). For each vector DNA,2μg per 5X10⁵cells was used for transfection . After nucleofection, fibroblasts were
seeded at a density of
5X10⁵cellsperwellina6-welldishpre-coatedwithvitronectin(10μ g/mL). EMEM was used until fibroblasts were well-seeded in the plates. Then, the medium was changed to hPSC culture medium, Essential 8 medium (Thermo Fisher Scientific, Waltham, MA, USA) with M1, M2 and control peptides (10 μM) added daily. The appearance of iPS cell colonies was monitored every day, and an individual colony was selected after approximately 14~16 days via mechanical methods for further clonal expansion.
2.1.4 Identification of colonization: Alkaline phosphatase staining assay
A capsule of Fast Blue RR salt from an alkaline phosphatase staining kit (Sigma Aldrich, ST. Louis, MO) was dissolved in water to prepare a diazonium salt solution. Naphthol AS-MX phosphate alkaline solution was added to the diazonium salt solution to prepare an alkaline staining mixture. The cells in the 6-well plate were fixed for approximately 30 s and rinsed gently with distilled water for 45 s. After applying the alkaline staining mixture, the cells were incubated at room temperature for 30 min (avoiding sunlight), washed with distilled water, counterstained with a Mayer’s hematoxylin solution for 10 min and rinsed with water for 2 min.
2.1.5 Characterization of reprogrammed cells:
Flow cytometry
Cells were trypsinized, washed once in PBS, and resuspended in fluorescence-activated cell sorting (FACS) buffer (PBS+5
%FBS). Approximately one million cells were resuspended in PBS (phosphate-buffered salt solution with 0.1 % BSA and 0.01
% sodium azide) with 2 mg/ml propidium iodide. Flow cytometric analysis was performed using a flow cytometer (Becton Dickinson, CA, USA).
2.1.6 Identification of colonization: Confocal immunofluorescence assay
Cells were fixed with 10 % NBF at room temperature for 20 min. After fixation, cells were treated with 0.5 % Triton X-100 in PBS for 10 min at room temperature. After blocking with 3 % BSA in PBS for 30 min, cells were incubated at 4 ℃ overnight with primary antibody, followed by washing in PBS and incubation at room temperature for 1 hour with the corresponding secondary antibody. For immunofluorescence, the primary antibodies used were as follows: anti-Oct4, anti-Sox2, anti-Nanog, anti-Tra-1-60, anti-Cardiomyocyte, anti-Neuron, and anti-Hepatocyte.
2.1.7 Identification of colonization: Western blot assay
At the end of the culture period, cells were lysed for 30 min at room temperature in lysis buffer (M-PER™ Mammalian Protein
Extraction Reagent, Thermo Fisher Scientific, Waltham, MA, USA) containing protease inhibitor cocktail (Roche, Penzberg, Germany) and phosphatase inhibitor cocktail 2 (Sigma-Aldrich, St. Louis, MO, USA). Then, 50 μg of cell lysate was separated on 10 % SDS-polyacrylamide gel electrophoresis (PAGE) gels and transferred to nitrocellulose membranes. Each membrane was washed with 1x TBS-T (20 mM Tris-HCl pH 7.6, 137 mM NaCl, and 0.1 % Tween 20), blocked for 1 hour at room temperature in 1x TBS-T with 5 % skim milk and probed with the following primary antibodies: anti-Oct4, anti-Nanog, anti-N-cadherin, anti-E-cadherin, anti-p65, and anti-GAPDH.
Signals were detected with HRP-conjugated goat anti-mouse IgG or HRP-conjugated goat anti-mouse IgG (1:2000). Protein bands were visualized with chemiluminescence reagent (Super Signal West Pico Chemiluminescent Substrate, Thermo Fisher Scientific, Waltham, MA, USA).
2.1.8 Identification of colonization: Quantitative real-time polymerase chain reaction assay
The total RNA from fibroblasts was isolated using TRIzol (Thermo Fisher Scientific, Waltham, MA, USA) and then quantified by ultraviolet (UV) spectroscopy. A cDNA library was synthesized using DNase I-treated total RNA (1 μg) by oligo dT priming using a Super Script II pre-amplification system (Thermo Fisher Scientific, Waltham, MA, USA). PCR (polymerase chain reaction) was performed using a GeneAmp PCR 9700 thermocycler. Real-time quantitative PCR analysis was performed on an ABI PRISM 7500 system (Applied
Biosystems, CA, USA) using SYBR Green I dye detection. The reactions were performed according to the manufacturer’s instructions. The primers for PCR analysis are listed in Table 2.
2.1.9 Characterization of iPS cells: In vitro Embryoid Body differentiation
To test pluripotency, the iPS cell colonies were mechanically detached and cultured in suspension in EB dishes (Thermo Fisher Scientific, Waltham, MA, USA) with Essential 6 medium (DMEM/F12, 10 % KnockOut SR XenoFree CTS, 1x NEAA, 1x P/S, and 0.1 mM β-mercaptoethanol; all from Thermo Fisher Scientific, Waltham, MA, USA). After 7 days of 3D culture, the EBs were attached to geltrex (Thermo Fisher Scientific, Waltham, MA, USA)-coated dishes and further cultured for 21 days in Essential 6 medium. Several representative markers specific for derivatives of these three germ layers were used for immunostaining after differentiation.
2.2 Experiments for bone regeneration using CPNE7-derived peptides (CDPs)
2.2.1 Materials
Rink amide resin (mM/g) with Fmoc-amino acids was purchased from Beadtech (Seoul, Korea). 1-[Bis(dimethylamino) methylene]-1H-1,2,3-triazolo[4,5-b]pyridinium 3-oxid hexafluorophosphate (HATU) was purchased from Beadtech
(Seoul, Korea). Piperidine, diisopropylethylamine (DIPEA), triisopropylsilane (TIS), phenol, and thioanisole were obtained from Sigma Aldrich. Tetrahydrofuran (THF), acetonitrile and trifluoroacetic acid (TFA) were purchased from Burdick &
Jackson (Morris Plains, NJ, USA). 1,2-Ethanedithiol (EDT) was purchased from Sigma-Aldrich (MO, USA). Anti-Runt-related transcription factor 2 (Runx2), anti-osteocalcin (OCN), and anti-OPN were purchased from Abcam (Cambridge, UK).
Anti-Smad1/5/8, anti-pSmad1/5/8, and anti-collagen type Ⅰ were purchased from Santa Cruz Biotechnology, Inc. (Dallas, TX, USA), and anti-glyceraldehyde 3-phosphate dehydrogenase (GAPDH) was purchased from Merck Millipore (Darmstadt, German). Bone morphogenic protein (BMP)-2 was purchased from R&D Systems (Abingdon, UK). All other reagents and products were purchased from Sigma-Aldrich (St. Louis, MO, USA) unless noted otherwise.
2.2.2 Synthesis and purification of CDPs
The CPNE7-derived peptides (CDPs) were synthesized by solid phase peptide synthesis using Fmoc chemistry according to the literature. Briefly, 2-chlorotrityl chloride resins were pre-swollen in DMF (50 mg/mL), and the Fmoc-protecting groups of the resin and amino acids were removed using 30 % piperidine in DMF, 10 eq. DIPEA, 5 eq. HBTU, and 5 eq. of Fmoc-protected amino acid, calculated according to the loading of the resin. The cleavage and side chain deprotection of the
peptide-resin proceeded for 4 h using
TFA/water/thioanisole/phenol/ethanedithiol (8.5/0.5/0.5/0.5,0.25).
The peptide cleavage solutions were triturated with diethyl ether, and the aqueous solutions containing peptides were lyophilized.
The synthesized peptide resins were dried using methylene chloride. Cleaved peptide solutions were mixed with diethyl ether, and the crude peptides were obtained. The prepared peptides were purified by reversed-phase high-performance liquid chromatography (Waters AutoPrep system, MA, Milford, USA) using a Vydac C18 column (Grace, Columbia, MD, USA) and a gradient of water/acetonitrile containing 0.1 % TFA. The peptides were characterized in terms of molecular weight by LC/MS and were found to have the expected molecular weights (CDP 1 : 1171, CDP 2 : 1212, CDP 3 : 2510, CDP 4 : 1315, CDP 5 : 1065, CDP 6 : 2363). The final purity of all the peptides was >93 %.
2.2.3 Cell culture
The dental pulp stem cells (DPSCs) used in this study were from Dr. Gene Lee, Seoul National University, Korea. The cells were cultured in Minimum Essential Medium Eagle Alpha Modifications (α-MEM) (HyClone, Road Logan, UT, USA) supplemented with 10 % fetal bovine serum (FBS) and 1 % antibiotic-antimycotic solution (Thermo Fisher Scientific, Waltham, MA, USA). The human periodontal ligament stem cells (hPDLSCs) were cultured at 37℃ under a humidified 95 % : 5
% (v/v) mixture of air and
CO2.Culturemediawerechangedthreetimesaweek.Forsub-cultureupo nreaching80-90%confluency,thecellsweredetachedfromcultureflask susingasolutionof0.05%trypsin-0.02%ethylenediaminetetraaceticaci
d(EDTA)andwerethenseededintofreshcultureflasksataratioof1:6.
2.2.4 Observation of internalization of CDPs using confocal microscopy
FITC-labeled CDPs were added to cells at various peptide concentrations (50 μM, 100 μM, 200 μM, 500 μM, 1 mM).
Following 30 min of incubation at 37 °C in humidified 5 % CO2,thecellswerewashedwithPBSextensively,fixedwith10%NBFsolut ionfor10minatroomtemperature,andthenexaminedbyconfocalmicrosc opy.ConfocallaserscanningmicroscopywasperformedusinganOlympu sFV-300laserscanningmicroscopeoperatedwithFLUOVIEWsoftware (Olympus,Tokyo,Japan).Thelaserwassetat488nm(green)toproducet heexcitationwavelengthforfluorescein.
2.2.5 CDP cell toxicity test: MTT assay
The cell viability was determined using a 3-(4,5-dimethylthiazol-2-yl)-2,5-diphenyltetrazolium bromide (MTT) colorimetric assay. Before the experiments, the DPSCs were plated in 96-well plates and maintained for 24 h. CDPs were added to the cells for 30 min at 37 °C. At the indicated time, the cells in the 96-well plates were incubated with 0.5 mg/mL MTT for 2 h at 37 °C. The intensity of the MTT product was measured at 550 nm using a microplate reader.
2.2.6 In vitro osteogenic differentiation stimulated
by CDPs: Western blot assay
At the end of the culture period, cells were lysed for 30 min at room temperature in lysis buffer (M-PER™ Mammalian Protein Extraction Reagent, Thermo Fisher Scientific, Waltham, MA, USA) containing protease inhibitor cocktail (Roche, Penzberg, Germany) and phosphatase inhibitor cocktail 2 (Sigma-Aldrich, St. Louis, MO, USA). Protein concentration was measured with a bicinchoninic acid (BCA) assay kit (Thermo Fisher Scientific, Waltham, MA, USA). Equal aliquots of protein (50 μg) were boiled for 7 min in 5x sample buffer (250 mM Tris-HCl (pH 6.8), 50 % glycerol, 10 % sodium dodecyl sulfate (SDS), 500 μ M dithiothreitol (DTT), 0.5 % bromophenol blue) and separated on 15 % SDS-polyacrylamide gel electrophoresis (PAGE) gels.
Proteins were transferred to nitrocellulose membranes, washed with 1x TBS-T (20 mM Tris-HCl pH 7.6, 137 mM NaCl, and 0.1 % Tween 20), and blocked for 1 hour at room temperature in 1x TBS-T with 5 % skim milk. The membranes were washed three times and incubated with primary antibodies (anti-Runx2, anti-Smad1/5/8, anti-pSmad1/5/8, anti-collagen type Ⅰ, anti-OCN, anti-OPN, anti-ALP, anti-TAZ, anti-GAPDH (1:1000)) in TBS-T containing 5 % skim milk for 18 hours at 4
℃. After three washes, the membranes were incubated with secondary antibodies (HRP-conjugated goat anti-rabbit IgG and HRP-conjugated goat anti-mouse IgG 1:2000 in TBS-T) for 1 hour, followed by another three washes. Protein bands were visualized with chemiluminescence reagent (Super Signal West Pico Chemiluminescent Substrate, Thermo Fisher Scientific, Waltham, MA, USA).
2.2.7 In vitro osteogenic differentiation induced by CDP4: Alkaline phosphatase activity assay
For the determination of alkaline phosphatase (ALP) activity induced by CDPs, DPSCs were grown to confluence in 24-well culture plates and incubated with CDP4 (50 μM, 100 μM, 200 μM, or 500 μM), CDP1 (negative control peptide, 500 μM), CPNE7 protein (2 nM = 100 ng/ml), or BMP-2 (7 nM = 100 ng/ml) for 7 days in growth medium (GM, α-MEM supplemented with 10 % FBS and 1 % antibiotic-antimycotic solution) and osteogenic medium (OM, hMSC Osteogenic BulletKit, Lonza, Basel, Switzerland). The media were changed every 3days with the addition of fresh CDPs, CPNE7 protein or BMP-2 . For ALP staining, cells were washed three times with cold Dulbecco’s phosphate-buffered saline (DPBS) and fixed with 10 % NBF solution for 10 min at room temperature. After additional washing with DPBS, cells were stained using an ALP detection kit (Millipore, USA) for 15 min at room temperature, followed by two washes with water and air drying. Matrix mineralization was quantified by extracting the ALP stain with dimethyl sulfoxide (DMSO, Sigma-Aldrich, St. Louis, MO, USA) at room temperature for 10 min. Absorbance of the extracted ALP stain was measured at 550 nm.
2.2.8 In vitro osteogenic differentiation induced by CDP4: Alizarin red S stain assay
DPSCs were grown until confluent in 24-well culture plates and were then incubated with CDP4 (50 μM, 100 μM, 200 μM, or 500 μM), CDP1 (negative control peptide, 500 μM), CPNE7 protein (2 nM = 100 ng/ml), or BMP-2 (2 nM = 100 ng/ml) for 28 days in GM and OM. The media were exchanged for fresh media every 3 days with fresh CDP1, CDP4, CPNE7 protein, or BMP-2 also added. At the end of peptide/protein treatment, cells were washed three times with DPBS and fixed in 95 % ethanol for 15 min at room temperature. After an additional wash in water, the cells were incubated with 2 % alizarin red S (Sigma-Aldrich, St. Louis, MO, USA) in water for 20 min at room temperature, washed twice with water and then air dried. Matrix mineralization was quantified by extracting the alizarin red S stain with 10 % cetylpyridinium chloride (Sigma-Aldrich, St. Louis, MO, USA) at room temperature for 2 hours. Absorbance of the extracted alizarin red S stain was measured at 570 nm.
2.2.9 In vitro osteogenic differentiation induced by CDP4: Quantitative real-time polymerase chain reaction assay
The DPSCs were incubated in peptide or protein for 28 days in mineralization medium. At the end of the indicated time, the total RNA was isolated using TRIzol (Thermo Fisher Scientific, Waltham, MA, USA) and then quantified by ultraviolet (UV) spectroscopy. A cDNA library was synthesized using DNase I-treated total RNA (1 mg) by oligo dT priming using a Super
Script II pre-amplification system (Thermo Fisher Scientific, Waltham, MA, USA). PCR (polymerase chain reaction) was performed using a GeneAmp PCR 9700 thermo cycler. Real-time quantitative PCR analysis was performed on an ABI PRISM 7500 system (Applied Biosystems, CA, USA) using SYBR Green I dye detection. The reactions were performed according to the manufacturer’s instructions. The PCR conditions were as follows: 10 s at 95 ℃, followed by 30-35 cycles of 10 s at 95
℃, 10 s at the annealing temperature, and 10 s at 72 ℃. Human glyceraldehyde-3-phosphate dehydrogenase (GAPDH) was used as a reference control to normalize for equal loading of template cDNA. The PCR primer sequences are shown in Table 1.
2.2.10 In vitro osteogenic differentiation induced by CDP4: Western blot assay
The DPSCs were incubated with phosphate-buffered saline (PBS), CDPs (200 μM or 500 μM), CPNE7 protein (2 nM = 100 ng/ml), or BMP-2 (7 nM = 100 ng/ml) for the indicated times. At the end of the culture period, cells were lysed for 30 min at room temperature in lysis buffer (M-PER™ Mammalian Protein Extraction Reagent, Thermo Fisher Scientific, Waltham, MA, USA) containing protease inhibitor cocktail (Roche, Penzberg, Germany) and phosphatase inhibitor cocktail 2 (Sigma-Aldrich, St. Louis, MO, USA). The protein concentration was measured with a bicinchoninic acid (BCA) assay kit (Thermo Fisher Scientific, Waltham, MA, USA). Equal aliquots of protein (50 μg) were boiled for 7 min in 5x sample buffer (250 mM Tris-HCl (pH 6.8), 50 % glycerol, 10 % sodium dodecyl
sulfate (SDS), 500 μM dithiothreitol (DTT), and 0.5 % bromophenol blue) and separated on 10 % SDS-polyacrylamide gel electrophoresis (PAGE) gels. Proteins were transferred to nitrocellulose membranes, washed with 1x TBS-T (20 mM Tris-HCl pH 7.6, 137 mM NaCl, and 0.1 % Tween 20) and blocked for 1 hour at room temperature in 1x TBS-T with 5 % skim milk. The membranes were washed three times and incubated with primary antibodies (anti-Runx2, anti-Smad1/5/8, anti-pSmad1/5/8, anti-collagen type Ⅰ, anti-OCN, anti-OPN, anti-TAZ, and anti-GAPDH (1:1000)) in TBS-T containing 5 % skim milk for 16 hours at 4 ℃. After three washes, the membranes were incubated with secondary antibodies (HRP-conjugated goat anti-rabbit IgG and HRP-conjugated goat anti-mouse IgG 1:2000 in TBS-T) for 1 hour, followed by another three washes. Protein bands were visualized with a chemiluminescence reagent (Super Signal West Pico Chemiluminescent Substrate, Thermo Fisher Scientific, Waltham, MA, USA).
2.2.11 Surgical procedure for application of CDP4–
collagen gel in the mouse calvarial defect model
Imprinting Control Region (ICR) mice weighing 30 ~ 40 g were used to assess the in vivo bone forming capacity of CDP4-collagen gel. The mice were anesthetized with Zoletil 50 (Virbac, Carros, France) and Rompun (Bayer AG, Leverkusen, German). A midline incision was made over the calvarium, and a full-thickness flap was elevated. A critically sized 5-mm calvarial defect was created using a trephine under sterile saline
irrigation. The animals were divided into 6 groups: No treatment (NT), Collagen gel only, CDP4-collagen gel, BMP-2-collagen gel, and CPNE7 protein-collagen gel. The flaps were sutured by layer with 4-0 chromic gut and 4-0 silk. All the animals received a single intramuscular injection of cefazolin (Chong Kun Dang pharmaceutical corp., Seoul, Republic of Korea)
2.2.12 In vivo osteogenesis measured by micro-computed tomography analysis
Four weeks after implantation, the mice were sacrificed. Their skulls were harvested and fixed in 10 % NBF. The degree of bone formation at the critical-sized calvarial defects was estimated by micro-computed tomography (micro-CT, SkyScan 1172, Bruker, Billerica, MA, USA). The percent of bone volume and bone mineral density in each defect site was calculated using analysis software (CT analyzer, Bruker, Billerica, MA, USA).
2.2.13 Histological analysis of osteogenesis induced by CDP4-collagen gel in the calvarial defect
Following micro-CT scanning, each sample was decalcified in 10 % neutral buffered formalin for 2 weeks at room temperature on a rotating rocker. Following decalcification, samples were dehydrated overnight. Samples were then cut along the coronal plane at the midline of the defect and embedded in paraffin.
Then, 5-μm-thick sections were mounted on individual slides and stained with hematoxylin and eosin stain and Masson's trichrome stain. Representative samples were evaluated for new bone formation.
2.3 Statistical analysis
All experiments were independently repeated at least three times. All values were expressed as the mean ± S.D., and the means were compared using one-way ANOVA followed by Student's t-test. P-values of < 0.05 were considered statistically significant.
Table 1. The nucleotide sequences of the primers used for examining osteogenic markers (alkaline phosphatase (ALP), runt-related transcription factor 2 (RUNX2), osteocalcin (OCN)) and the housekeeping gene (glyceraldehyde 3-phosphate dehydrogenase (GAPDH)).
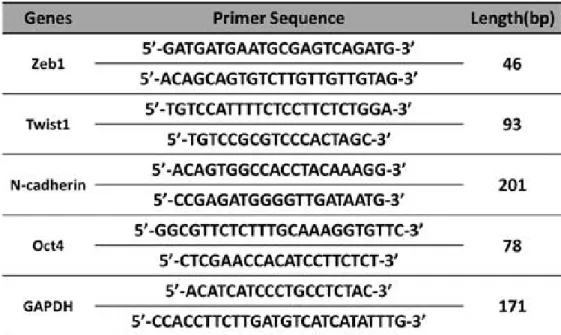
Table 2. The nucleotide sequences of the primers used for examining fibroblast markers (Zeb1 and Twist1), the epithelial-mesenchymal marker (N-cadherin), the pluripotency marker (Oct4) and the housekeeping gene (glyceraldehyde 3-phosphate dehydrogenase (GAPDH)).
Ⅲ. Results
3.1 Synthetic peptides for promotion of cell reprogramming
3.1.1 Generation of Xeno-Free iPS Cells via Peptide transduction in a vitronectin-based feeder-independent culture system.
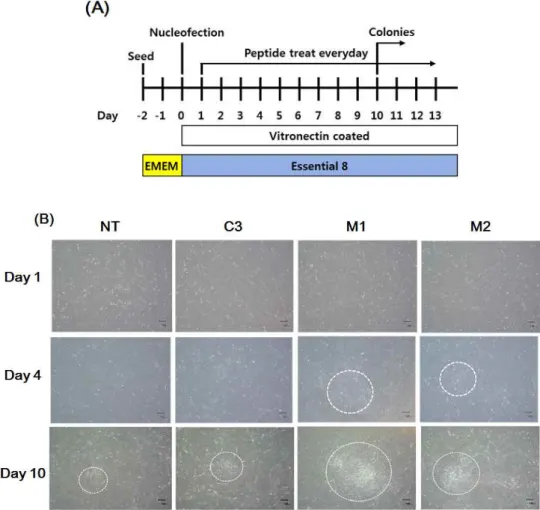
In our experiments, we sought to generate xeno-free iPS cells by combining human a vitronectin-based xeno-free/feeder-free human iPS cell culture system with a vector-mediated reprogramming method. At Day 0, a vector mixture of Oct4, Sox2, Klf4, cMyc and Lin28 was transfected into fibroblasts using electroporation, and cells were seeded into a 6-well vitronectin-coated plate. Starting the next day, cells were treated with M1 and M2 peptides or control peptide daily. When cells were observed, the M1 and M2 peptide-treated groups exhibited an MET status between Days 3 and 4, whereas MET was observed at Days 9 and 10 in the control-treated group.
Each ESC-like colony was selected on approximately days 14~16 and was cultured using our vitronectin-based xeno-free/feeder-free hiPSC culture system for expansion.
Figure 1. Generation of iPS cells using a human vitronectin-based xeno-free/feeder-free hPSC medium. (A) A schematic representation of the experimental design. Nucleofected (mediated by electroporation) human dermal fibroblasts were seeded on a 6-well plate as shown in the schedule. (B) ESC-like colonies that represented mesenchymal-epithelial transitioned cells began to appear on Day 10 after cell seeding (see the center of the white circle).
3.1.2 Characterization of reprogrammed cells using Flow cytometry
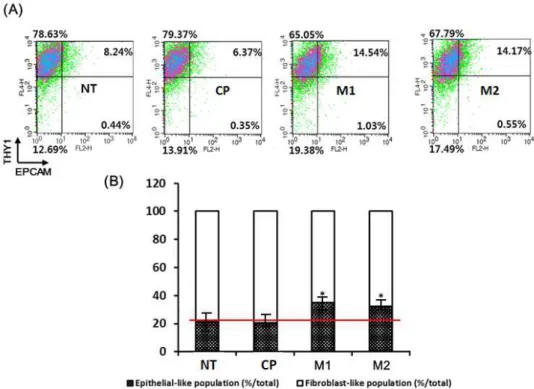
To check the reprogramming status of cells at Day 10, flow cytometry was used to measure the proportion of the population with an epithelial or mesenchymal status. For the mesenchymal reference value, THY 1 antibody (SC-59398) and human dermal fibroblasts (hDFs) were used. For the epithelial reference value, EPCAM antibody (ab20160) and human mammary epithelial cells (HMECs) were used.
The M1 and M2 peptide-treated groups revealed more epithelial-like morphology than the control peptide-treated or untreated groups. The graphs show the populations of epithelial-like cells and mesenchymal-like cells.
As a result, it was confirmed that M1 and M2 peptides promote mesenchymal to epithelial transition (MET) in fibroblasts.
Figure 2. Flow cytometry assay to identify the population of epithelial-like cells and mesenchymal-like cells.
3.1.3 Identification of colonization using Alkaline
phosphatase (ALP) staining and
Immunofluorescence.
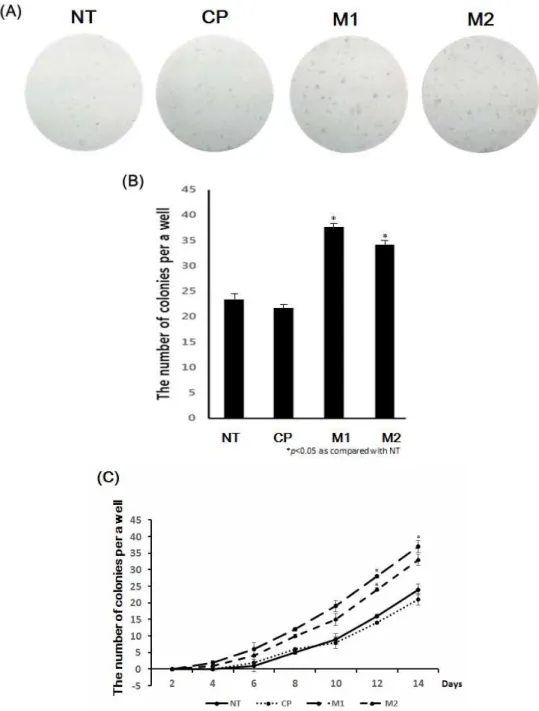
After nucleofection, fibroblasts were treated with peptides (M1, M2, and CP) daily, and they started forming colonies. Cells were cultured under the standard conditions for iPS cell induction and monitored daily for morphological changes (ESC-like colony formation). After 2 days of nucleofection, cell morphology began to change and became more epithelial-like. After 10 days, colonies began to be assessed with an alkaline phosphatase (ALP) staining assay. (Figure 3 A) To quantify the number of colonies, ALP staining assays were performed every other day up to Day 14. As shown in Figure 3 B, the M1 and M2 peptide-treated groups had a higher number of colonies than the other groups on Day 14.
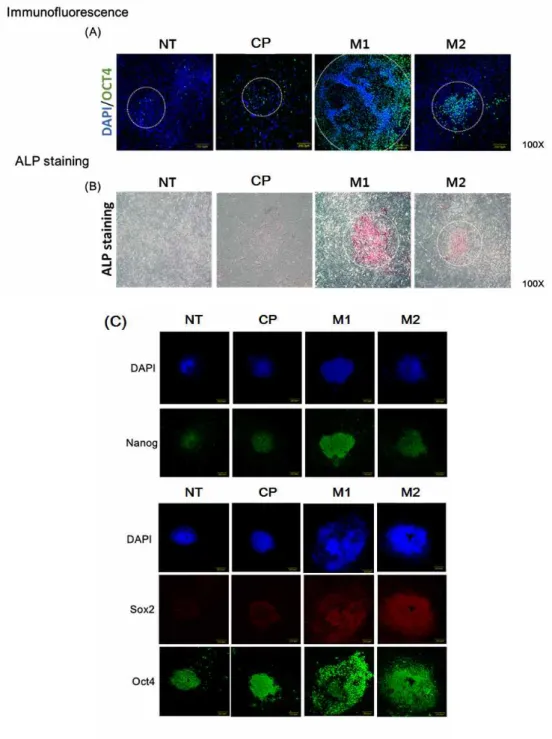
At Day 10 after peptide treatment, an immunofluorescence assay was performed to compare the sizes of the colonies between groups. M1 and M2 peptide-treated groups exhibited larger colonies than the other groups. Addition of M1 and M2 peptides significantly increased both the number and size of the colonies.
Thus, M1 and M2 peptides enhanced the efficiency of iPS cell generation.
Figure 3. (A, B) To investigate how many colonies emerged, an alkaline phosphatase (ALP) staining assay was performed after peptide treatment for 14 days. (C) These graphs show the number of colonies that were stained every 2 days.
Figure 4. Immunostaining of the colonies for several pluripotency markers (Oct4, Sox2 and Nanog).
3.1.4 Identification of colonization using western blotting
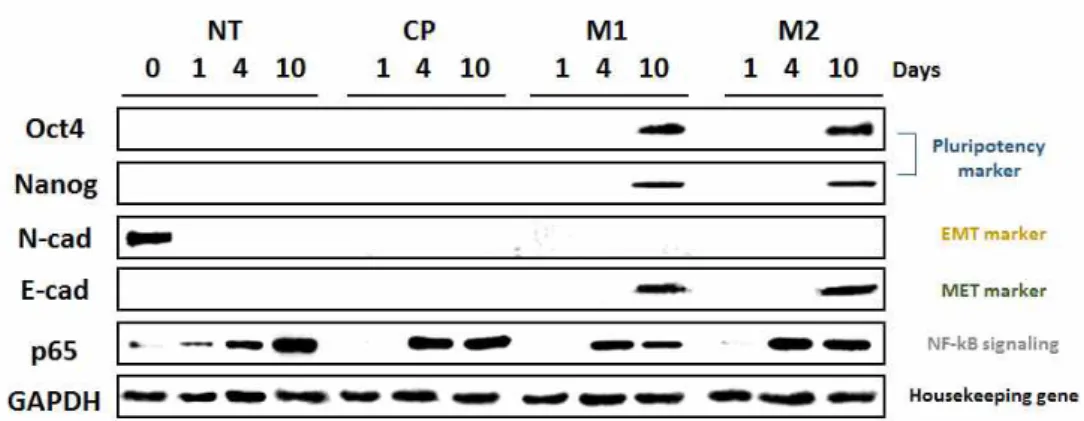
In the above results, it was confirmed that NF-κB inhibitor peptides (M1 and M2) enhanced the reprogramming efficiency of fibroblasts to convert them into iPS cells. To evaluate the reprogramming ability of M1 and M2 biochemically, western blotting and PCR were performed. The effect of M1 and M2 peptides on NF-κB activity and EMT- and MET-related signaling pathways was examined. E-cadherin and N-cadherin are representative proteins of EMT and MET. p65 is an NF-κB subunit. In 10 days, Oct4 and Nanog proteins, stem cell markers, and E-cadherin, an MET marker, were expressed in M1 and M2 peptide-treated cells. However, the N-cadherin protein disappeared during the period after treatment with peptides (M1, M2, and CP); N-cadherin was only observed in cells on Day 0.
p65 protein was detected in 4 days. In the case of p65 protein, the protein expression level was increased for 4~10 days after treatment with M1 and M2 peptides, suggesting that M1 and M2 peptides inhibited NF-κB signaling.
These data demonstrated that M1 and M2 peptides stimulate MET by inhibiting NF-κB.
Figure 5. Changes in the activation of pluripotency marker proteins (Oct4 and Nanog), EMT and MET marker proteins (N-cadherin and E-cadherin), and NF-κB signaling protein (p65) were analyzed by western blot analysis at 0, 4, and 10 days after peptide treatment.
3.1.5 Identification of colonization using PCR
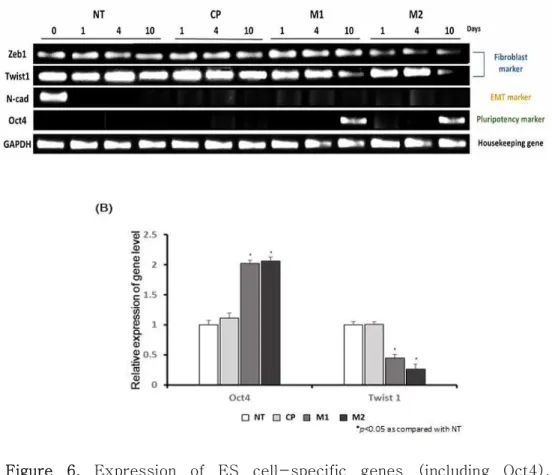
To investigate the transcriptional changes in reprogramming-related genes induced by M1 and M2 treatment, the expression levels of fibroblast-specific genes (Zeb1 and Twist1), an EMT-specific gene (N-cadherin) and a pluripotency-specific gene (Oct4) were evaluated at Days 1, 4 and 10. The expression of the Zeb1 and Twist1 genes was significantly decreased in the M1- and M2-treated groups, but not in the control or untreated group. Interestingly, the Twist1 gene was gradually decreased in the M1 and M2 group.
However, in the other group, the expression level of the Twist1 gene was not changed. Further, similar to the western blot results, the N-cadherin gene was not expressed any of the days after treatment with peptides (M1, M2, and C3), except on Day 0.
The graph shows the relative expression level of the Oct4 and Twist1 genes.
It was confirmed that M1 and M2 peptides inhibit mesenchymal-related genes. Therefore, M1 and M2 peptides promote MET transition.
Figure 6. Expression of ES cell-specific genes (including Oct4), fibroblast-specific genes (Zeb1 and Twist1) and an EMT gene (N-cadherin) were analyzed by RT-PCR. These data showed that fibroblast-specific genes (Zeb1 and Twist1) were decreased, and the Oct4 gene was expressed after M1 and M2 peptide treatment.
3.1.6 Characterization of iPS cells treated with peptides
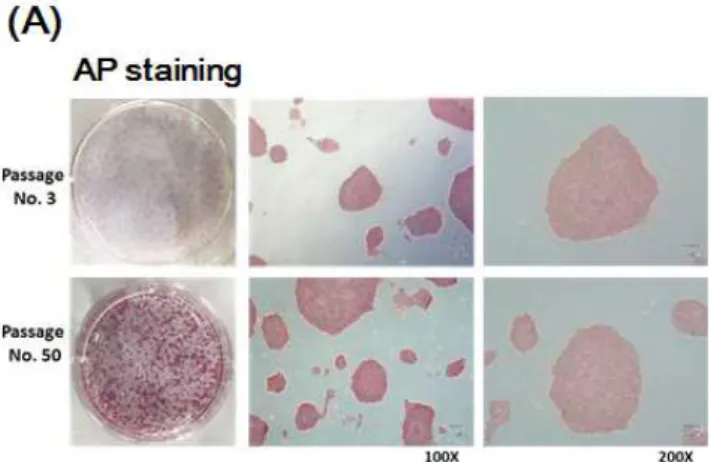
To determine if iPS cells generated by M1 and M2 peptides have stem cell-like features, these cells were maintained for a long period of time (over 50 passages). When these cells were stained with ALP and compared morphologically, there was no difference between P3 and P50. An ALP staining assay showed that young (passage no. 3) iPS cells and old (passage no. 50) iPS cells expressed the same level of pluripotency. All of the colonies exhibited sharp boundaries and rounded shapes, indicating their undifferentiated state. To more closely examine whether these iPS cells expressed markers of undifferentiated cells, immunostaining was performed for several antigens specific for PSCs. Oct4, Sox2, SSEA4 and Tra-1-60 were robustly expressed in the iPS cells that had been passaged 50 times in our vitronectin-based xeno-free/feeder-free hPSC culture system.
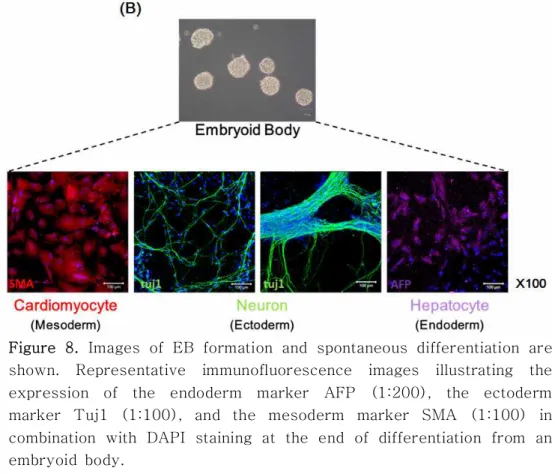
To examine whether the iPS cells acquired pluripotency, the cells were spontaneously differentiated into derivatives of the three germ layers in vitro. To this end, EBs were generated first, followed by the formation of adherent cultures on vitronectin-coated dishes. When analyzed 21 days after differentiation on vitronectin, clear expression of representative markers for ectoderm (Neuron, Class III β-tubulin (Tuj1)), mesoderm (cardiomyocyte, smooth muscle actin (SMA)), and endoderm (hepatocyte, alpha-fetoprotein (AFP)) was detected.
Figure 7. Characterization of iPS cells. Comparison of passage no. 3 iPS cells and passage no. 50 iPS cells. The AP staining assay indicated that old iPS cells, which were treated with peptide daily, also had pluripotential capability. Immunofluorescence results showed that pluripotency iPS markers (Oct4, Sox2, Nanog and Tra-1-60) were expressed at the same levels between passages 3 and 50 in iPS cells.
Figure 8. Images of EB formation and spontaneous differentiation are shown. Representative immunofluorescence images illustrating the expression of the endoderm marker AFP (1:200), the ectoderm marker Tuj1 (1:100), and the mesoderm marker SMA (1:100) in combination with DAPI staining at the end of differentiation from an embryoid body.
3.2 CPNE7-derived peptide for bone regeneration 3.2.1 Synthesis of CDPs
The CPNE7-derived peptides (CDPs) were synthesized using Fmoc chemistry. Peptide molecular weight and purity were assessed by LC/MS and HPLC, respectively. The CDPs were obtained as the major synthesis products (purity of all CDPs ≥ 93 %). To confirm that CDP1 ~ CDP6 were synthesized correctly based on their molar weight, LC/MS was used. In each
CDP mass spectrum peaks of
[CDP1]+1,[CDP2]+1,[CDP3+3H]+3,[CDP4+2H]+2,[CDP5]+1,and[CD P6+3H]+3wereobserved. The molecular weights of synthesized CDPs were CDP1 : 1171, CDP2 : 1212, CDP3 : 2510, CDP4 : 1315, CDP5 : 1065, and CDP6 : 2363.
Figure 9. LC/MS results for CPNE7-derived peptides (CDPs, domains 1~6) after purification. The peak indicates the molecular weight of the peptides.
3.2.2 Cell translocation efficiency of CDPs
FITC was tagged to the N-terminus of the CDPs to aid in visualization. Then, using confocal microscopy 30min after peptide treatment, the ability of the CDPs to translocation to cells was confirmed, and the translocation efficiency was determined. In Figure 10, internalized, fluorescence-tagged CDPs are shown. Brighter fluorescence indicates that the CDPs entered the cytoplasm of cell. The fluorescence signal showed that CDP4 had the best translocation ability. CDP3 and CDP6 also showed cell penetrating efficiency, but it was not higher than CDP4. However, CDP1, CDP2 and CDP5 had no cell translocation ability.
Figure 10. Cellular localization of fluorescence-labeled CDPs in DPSCs (30 min). Cellular localization was monitored with confocal microscopy. The peptide concentrations used were 50 μM, 100 μM, 200 μM, 500 μM, and 1 mM.
3.2.3 Viability of cells treated with CDPs
To investigate if these peptides are cytotoxic, cell proliferation was quantitatively measured using an MTT assay. DPSCs were seeded on Day 0, and then, cell proliferation was analyzed on Days 1, 2 and 3. The CDP concentrations tested were 50 μM, 100 μM, 200 μM, 400 μM, 500 μM, 800 μM, 1 mM and 2 mM. The cells were treated with CDPs once, and the MTT assay was performed after one day, two days, and three days.
The MTT assay results showed that CDP1, CDP2, CDP3, CDP4 were safe for DPSCs, whereas CDP5 and CDP6 exhibited cytotoxicity.
Figure 11. Effect of peptides on cell viability. Changes in cell viability after treatment with the CDPs were examined using an MTT assay.
The DPSCs were treated with various concentrations of CDPs (50 μ M, 100 μM, 200 μM, 400 μM, 500 μM, 800 μM, 1 mM, and 2 mM) for 0, 1, 2, and 3 days in complete medium containing 10 % FBS. The intensity of the MTT product was measured at 550 nm using a microplate reader.
3.2.4 Osteogenic activity of CDPs in vitro
Whether the CDPs were able to induce osteogenic differentiation in DPSCs was determined.
To confirm the osteogenic induction potential of synthesized CDPs, the expression level of osteogenic markers was evaluated by western blot. Due to the cytotoxicity of CDP5 and CDP6 in DPSCs, CDP5 and CDP6 were not used in this test. The expression level of osteogenic proteins was examined 28 days after peptide or protein transduction. The peptide concentration was fixed at 200 μM and 500 μM. The expression level of Osteocalcin in CDP4-treated cells was most similar to that in CPNE7- and BMP-2-treated cells. In 200 μM concentration conditions, CDP4 substantially increased Osteocalcin expression, more than the other peptides, CDP1, CDP2, and CDP3. In 500 μ M concentration conditions, the level of Osteocalcin was again highest in CDP4-treated cells.
Based on the results of the western blot to assess differentiation , CDP4 strongly increased the levels of osteogenic differentiation markers. To examine whether CDP4 has the best osteogenic induction ability for bone differentiation, cells were differentiated to bone, and then, the ALP activity was assessed.
The ability of the synthesized CDP4 to increase ALP activity and induce calcium deposits was tested in cells with or without CDP4, CPNE7 protein or BMP-2 treatment. Consistent with the western blot results, CDP4 (200 μM and 500 μM) showed significantly enhanced ALP activity and formation of calcium phosphate crystals, similar to CPNE7 and BMP-2, which were
used as positive controls.
To confirm the effect of CDP4 on osteogenic differentiation, osteogenic gene markers such as ALP, Runx2, and Osteocalcin were detected with quantitative real-time PCR. Treatment with CDP4 increased the gene expression of ALP, Runx2, and Osteocalcin. CPNE7- and BMP-2-treated DPSCs showed an increase in all osteogenic markers, presenting expression levels similar to those of CDP4.
Figure 12. Osteogenic-specific protein expression induced by CPNE7-derived peptides (CDP1, CDP2, CDP3, and CDP4), CPNE7 protein, and BMP-2. The DPSCs were incubated with CDPs (200 μM and 500 μM), CPNE7 protein (2 nM = 100 ng/ml), or BMP-2 (7 nM
= 100 ng/ml), and the expression levels of osteogenic markers ,such as Osteocalcin(OCN), representing DPSC differentiation, were detected by western blot.
Figure 13. The alkaline phosphatase (ALP) activity assay. DPSCs were grown to confluence in 24-well culture plates and incubated with CDP4 (200 μM and 500 μM), CDP1 (500 μM), CPNE7 protein (2 nM = 100 ng/ml), or BMP-2 (7 nM = 100 ng/ml) for 28 days in growth medium (GM) and osteogenic medium (OM). Osteogenic differentiation was induced by CDP4, CPNE7 protein, and BMP-2. The activity of the ALP enzyme in the media was detected.
Figure 14. The alizarin red S assay. Osteogenic differentiation was induced by biomolecules. DPSCs were grown to confluence in 24-well culture plates and incubated with CDP4 (200 μM and 500 μM), CDP1 (negative control, 500 μM), CPNE7 protein (2 nM = 100 ng/ml), or BMP-2 (7 nM = 100 ng/ml) for 28 days in growth medium and osteogenic medium (OM). Osteogenic differentiation was induced by CDP4. The DPSCs were treated with CDP4 for 28 days in GM or OM and then stained for alizarin red S.
Figure 15. Osteogenic-specific gene expression induced by CDP4.
Gene expression levels of osteogenic markers (ALP, Runx2, and Osteocalcin) representing differentiation and mineralization in DPSCs were detected by RT-PCR. The DPSCs were treated with CDP4 (500 μM), CDP1 (500 μM), CPNE7 protein (2 nM = 100 ng/ml), or BMP-2 (7 nM = 100 ng/ml) for 21 days in osteogenic media, and the gene expression levels of osteogenic markers were detected.
Figure 16. Phosphorylation of Smad 1/5/8 and other osteogenic markers (TAZ, Runx2, Osteocalcin, Osteopontin, ALP, and Col1A1) was detected by western blot. DPSCs were incubated with CDP4 (500 μM), CPNE7 protein (2 nM = 100 ng/ml), or BMP-2 (7 nM = 100 ng/ml) for 28 days. Almost all osteogenic markers were detected 14 days after CDP4 treatment.
3.2.5 Bone formation induced by CDP4 in a Collagen gel
To examine whether a CPNE7-derived peptide is able to generate bone in vivo, CDP4-collagen gel mixtures were applied to the mouse calvarial defect. Figure 17 shows 3D microCT images and histological sections of the mouse calvarial defects with No treatment (NT), collagen gel only (Collagen), CPNE7-derived peptide 4 domain (CDP4 200 μM and 500 μ M)-, bone morphogenetic protein (BMP-2)- and CPNE7 protein- loaded collagen gels 4 weeks after surgery.
The 3D microCT images were taken to examine the microarchitecture and distribution of mineralization within the peptide-loaded collagen gels (Figure 17). The NT group exhibited minimal mineralized regions, and the mineralized regions present were mostly confined to the defect edge. Similar to the NT group, the collagen-only group displayed small patches of mineralization. Interestingly, in the CDP4-collagen gel-treated group, new bone formation was markedly observed within the implant region. In particular, the CDP4 500 μ M-collagen gel group showed more growth of mineralized area from the defect edge, compared to the NT, Collagen gel, and CDP4 200 μM-collagen gel groups. As a positive control, the BMP-2- and CPNE7-treated groups showed a significant amount of new bone formation, which was similar to that observed in the CDP4 500 μM-collagen gel group.
Histological specimens were taken to further examine the bone formation in the No treatment, Collagen gel, CDP4-, BMP-2-, and CPNE7-loaded collagen gel groups. In the No treatment
group, dense and fibrous connective tissue at the defect site was observed. No severe inflammatory reactions were observed along the side of the dura mater in untreated groups. The group treated with collagen gel showed little bone formation from the defect, similar to the No treatment group. However, in the group treated with CDP4-loaded collagen gel, the new bone formation was marked, with bone growth starting from the bony borders toward the center of the defect. These results were consistent with the analysis of the 3D microCT images, in that CDP4 was revealed to induce new bone formation, similar to the BMP-2- and CPNE7-loaded collagen groups.
Figure 17. The 3D micro-CT images were reconstructed using analysis software. Mouse calvarial defect models were treated with either no treatment (NT) or with Collagen gel, CPNE7-derived peptide 4 domain (CDP4)-, bone morphogenetic protein (BMP)-2- or CPNE7 protein-Collagen gel implants. Then, 4 weeks after implantation, mice were sacrificed and bone formation was estimated by micro-CT. The red area indicates the area of regenerated bone.
Figure 18. The no treatment (NT), Collagen, CPNE7-derived peptide 4 domain (CDP4, 200 μM and 500 μM), bone morphogenetic protein (BMP-2) and CPNE7 protein groups were measured for bone volume (A) and bone mineral density (B). BMD values are presented as differences from the density of the phantom . (*p<0.05 compared with NT)
Figure 19. Representative H&E-stained histological samples obtained 4 weeks post-surgery from mice that received collagen gel implants: No treatment group (original magnification 1X, 4X, 10X, 20X), Collagen gel group (original magnification 1X, 4X, 10X, 20X), CPNE7-derived peptide 4 domain (CDP4)-collagen gel group (original magnification 1X, 4X, 10X, 20X), Bone morphogenetic protein (BMP-2)-collagen gel group (original magnification 1X, 4X, 10X, 20X) and CPNE7 protein-collagen gel group.
Figure 20. Representative Masson's trichrome-stained histological samples obtained 4 weeks post-surgery from mice that received collagen gel implants: No treatment group (original magnification 1X, 4X, 10X, 20X), Collagen gel group (original magnification 1X, 4X, 10X, 20X), CPNE7-derived peptide 4 domain (CDP4)-collagen gel group (original magnification 1X, 4X, 10X, 20X), Bone morphogenetic protein (BMP-2)-collagen gel group (original magnification 1X, 4X, 10X, 20X) and CPNE7 protein-collagen gel group.
Ⅳ. Discussion & Conclusion
MET is an important cellular process during the reprogramming of fibroblasts into iPS cells.
It has been reported that EMT and MET are primarily regulated by transcriptional regulation and/or the extracellular environment. Thus, pro-EMT cytokines such as Zeb1, Snail and Twist play a role in preserving fibroblasts through inhibition of MET, eventually blocking reprogramming. To induce MET, which is critical for cell reprogramming, extrinsic factors are required.
For example, Alk5i, a selective inhibitor of TGF-βRI kinase, can help improve human iPS cell generation by inhibiting EMT [17, 18]. This study suggested that blocking EMT is important for cell reprogramming.
Additionally, it was reported that NF-κB is essential for EMT and metastasis in cancer progression [3]. Inhibition of NF-κB signaling prevented EMT in Ras-transformed epithelial cells, while activation of this pathway promoted the transition to a mesenchymal phenotype even in the absence of TGF-β.
Furthermore, inhibition of NF-κB activity in mesenchymal cells caused a reversal of EMT, suggesting that NF-κB is essential for regulating both the induction and maintenance of EMT and MET.
In the canonical NF-κB pathway, the inhibitory protein IκB gets phosphorylated by the IKK complex, followed by rapid ubiquitination and proteasome-mediated degradation, thus releasing NF-κB [19]. Upon translocation of free NF-κB to the nucleus, many downstream targets, such as Snail, Twist and
Zeb1, involved in EMT are induced [20].
In short, activated NF-κB can induce Snail, Twist and Zeb1.
Simultaneous induction of Snail, Twist and Zeb1 promotes EMT and suppresses MET [3, 4].
Figure 21. Overall concept of the complete mechanisms
To promote reprogramming efficiency, the synthetic peptides M1 and M2 were employed to inhibit NF-κB. These peptides inhibited EMT and accelerated the reverse process, MET, leading to inhibition of NF-κB signaling (Figure 5, 6). It seems to be important that many signaling mechanisms of EMT, MET and NF-κB are changed in the early phase after transfection with Yamanaka factors such as Oct4, Sox2, Klf4, and cMyc.
Therefore, this study focused on the early phase after the Yamanaka factors were introduced into fibroblasts for 10~14 days.
After nucleofection, cells were treated with M1 and M2 peptides daily for up to 10 days. After that, flow cytometry was performed to determine the proportion of the epithelial-like cell population. Quantified data show that the epithelial-like populations in the M1 and M2 peptide-treated groups were increased by 1.5~2 times. (Figure 2). Moreover, ALP assays were performed to confirm colony formation. (Figure 3).
In this study, gene expression was analyzed in fibroblasts and expression of the Oct4 gene was confirmed on Day 10 (Figure 6). The transcription factors Snail and Twist are known as inhibitors of E-cadherin and Oct4 [21, 22]. In addition, in our results, the expression of Snail and Twist gradually decreased until Day 10 after nucleofection. Decreasing Snail, Twist and Zeb1 levels leads to an increase in Oct4 and E-cadherin expression. Thus, the Oct4 expression level was checked at Day 10 and found to be highly increased (Figure 6). It still needs to be confirmed that the N-cadherin protein disappeared after applying hESC qualified medium, Essential 8 medium.
Several chemicals have recently been reported to either enhance reprogramming efficiencies or substitute for specific reprogramming factors, including chromatin modifiers, DNA methyltransferase inhibitors and TGF-β pathway inhibitors [23, 24]. In this study, functional peptides were shown to inhibit the translocation of intracellular NF-κB proteins into the nucleus, thereby inhibiting EMT, while at the same time promoting MET,