저작자표시-비영리-변경금지 2.0 대한민국 이용자는 아래의 조건을 따르는 경우에 한하여 자유롭게
l 이 저작물을 복제, 배포, 전송, 전시, 공연 및 방송할 수 있습니다. 다음과 같은 조건을 따라야 합니다:
l 귀하는, 이 저작물의 재이용이나 배포의 경우, 이 저작물에 적용된 이용허락조건 을 명확하게 나타내어야 합니다.
l 저작권자로부터 별도의 허가를 받으면 이러한 조건들은 적용되지 않습니다.
저작권법에 따른 이용자의 권리는 위의 내용에 의하여 영향을 받지 않습니다. 이것은 이용허락규약(Legal Code)을 이해하기 쉽게 요약한 것입니다.
Disclaimer
저작자표시. 귀하는 원저작자를 표시하여야 합니다.
비영리. 귀하는 이 저작물을 영리 목적으로 이용할 수 없습니다.
변경금지. 귀하는 이 저작물을 개작, 변형 또는 가공할 수 없습니다.
의학 석사 학위논문
Research for anticancer mechanism of Toxoplasma gondii GRA16 protein against
hepatocellular carcinoma cells
간암세포에서 톡소포자충 단백질 GRA16 의 항암기전 연구
2020 년 1 월
서울대학교 대학원
의과대학 의학과 열대의학전공 김 상 균
간암세포에서 톡소포자충 단백질 GRA16 의 항암기전 연구
지도교수 신 은 희
이 논문을 의학석사 학위논문으로 제출함
2020 년 1 월
서울대학교 대학원 의학과 열대의학
김 상 균
김상균의 석사학위논문을 인준함 2020 년 1 월
위 원 장 (인)
부 위 원 장 (인)
위 원 (인)
Research for anticancer mechanism of Toxoplasma gondii GRA16 protein against
hepatocellular carcinoma cells
by
Sang-Gyun Kim
(Directed by Prof. Eun-Hee Shin)
A thesis submitted to the Department of Medicine in partial fulfillment of the requirement of the Degree of Master of Science in Medicine (Tropical Medicine and Parasitology) at
Seoul National University College of Medicine
January 2020
Approved by Thesis Committee:
Professor Chairman
Professor Vice chairman
Professor
ABSTRACT
Dense granule protein 16 (GRA16) is a Toxoplasma gondii secreted protein that localizes to the parasitophorous vacuole (PV) membrane. According to the recent studies, GRA16 interacts with HAUSP, a deubiquitinase enzyme, and directly regulates p53 and MDM2 through deubiquitylation. The present study aimed to investigate the efficacy of GRA16 in anticancer treatment. Given that alterations in phosphatase and tensin homolog (PTEN) and p53 are vital in liver carcinogenesis, and considering that the abnormal p53 gene appears in hepatocellular carcinoma (HCC), I investigated whether the expression of GRA16 in genetically modified HCC cells (GRA16-p53-wild HepG2 and GRA16-p53-null Hep3B) regulates PTEN and p53. I established the above mentioned GRA16 cell lines using the retrovirus system and evaluated the detailed mechanism of PTEN regulation using these cells. According to the results, the cell proliferation, anti-apoptotic factors, p-AKT/AKT ratio, cell migration, and invasive activity decreased in GRA16-stable-HepG2 cells. Conversely, the apoptotic factors PTEN, p53, and apoptotic cells (%) increased in GRA16-stable-HepG2 cells. However, these trends were not observed in Hep3B cells. Furthermore, HAUSP-bound GRA16 preferentially increased the stabilization of p53 by the nuclear localization of PTEN, rather than by MDM2-dependent mechanisms. These molecular changes appear to correlate with the reduced tumor mass in GRA16-stable-HepG2 cell-xenograft nude mice. A central finding of this study is that GRA16 as a HAUSP inhibitor targets the nuclear localization of PTEN and induces the anticancer effect in a p53-dependent manner. The genetic absence of p53 lowers
the endogenous PTEN level and does not induce the GRA16-related anticancer activity. Taken together, my results suggest that the action of GRA16 targets the nuclear localization of PTEN and exerts an anticancer effect in a p53-dependent manner. Therefore, the efficacy GRA16 could be newly highlighted in the HCC treatment in a p53-dependent manner.
--- Keywords : GRA16 / HAUSP / HCC / PTEN / Apoptosis / Toxoplasma gondii
Student number : 2017-23973
CONTENTS
Abstract ···Ⅰ
List of figures ···Ⅳ
List of abbreviations ···Ⅴ
Introduction ···1
Materials and Methods ···3
Results ···14
Discussion ···34
References ···39
Abstract in Korean ···42
LIST OF FIGURES
Figure 1. Establishment of GRA16-expressing stable cell line and comparison of cell proliferation and total cell number between HepG2 and Hep3B
Figure 2. Protein expressions of PTEN and p53, as well as AKT phosphorylation in GRA16-stable-HepG2 and –Hep3B cells
Figure 3. The increase in the nuclear localization of PTEN in GRA16-stable-HepG2 cells
Figure 4. Regulation of the cell cycle by GRA16 in HepG2 and Hep3B
Figure 5. The increased apoptosis in GRA16-stable-HepG2 cells
Figure 6. Effects of GRA16 on the mobility and invasive activity of GRA16-stable-HepG2 and -Hep3B cells
Figure 7. Tumor reduction in xenograft mice
LIST OF ABBREVIATIONS
HAUSP : Herpesvirus-associated ubiquitin-specific protease MDM2 : Mouse double minute 2 homolog
P53 : Tumor protein p53
PTEN : Phosphatase and tensin homologue GRA16 : Dense granule protein 16
PP2A : Protein phosphatase 2
GAPDH : Glyceraldehyde 3-phosphate dehydrogenase ROP : Rhoptry protein
HCC : Hepatocellular carcinoma PCR :Polymerase Chain Reaction IgG : Immunoglobulin G
FOXO3a : Fokhead box protein O3
p21 : Cyclin-dependent kinase inhibitor 1A Bax : Bcl-2 associated X protein
Bcl-2 : B-cell lymphoma 2 Pi : Propidium iodide
FACS : Fluorescenc-activated cell sorting APC : Allophycocyanin
HA : Human influenza hemagglutinin PTK2 : Protein tyrosine kinase 2 MMP2 : Matrix metalloproteinase-2
INTRODUCTION
The herpes virus‐associated ubiquitin‐specific protease (HAUSP) is known to deubiquitinate MDM2 (an E3 ligase) and destabilize p53 in human cells[1-3]. HAUSP (also called USP7) deubiquitinates the tumor‐suppressor phosphatase, and tensin homologue (PTEN; deleted in chromosome 10)[1,4,5] leads to PTEN nuclear exclusion, resulting in the destabilization of p53 transcription[1,4-6].
Thus, HAUSP’s deubiquitinating MDM2 and PTEN plays an important role in cell proliferation and differentiation. Accordingly, suppression of HAUSP is critical strategy for anticancer therapeutic intervention[1-6]. Therefore, it is important to identify HAUSP inhibitors for therapeutic intervention of cancer. Recently, a study reported that Toxoplasma GRA16 binds to HAUSP and PP2A, alters p53 levels in a HAUSP-dependent manner during infection, and eventually increases virulence through the inhibition of HAUSP activity and host cell subversion[9].
Toxoplasma gondii (T. gondii), a most common intracellular pathogen, infects humans and other warm-blooded animals. T. gondii can produce the
infection of multiple organs and tissues in the acute stage and that of the brain in the chronic stage. T. gondii regulates the host immunity for its survival[8,9]. The immune modulate activation is mediated by several T. gondii-related molecules, such as rhoptry protein (ROP), dense granule protein (GRA), and the lysate protein[9-16]. Based on the immune modulatory characteristics of T. gondii, therapeutic strategies for cancer and neurodegenerative diseases have been proposed by using T. gondii molecules[12-15]. Among T. gondii-specific molecules, GRA16 is secreted into the parasitophorous vacuole, after which it moves from the
vacuolar space to the host cell cytoplasm and nucleus where it forms a complex with two host cell enzymes, HAUSP and PP2A-B55, which then bind to different regions of GRA16[9, 16]. Based on this results, in this study, I investigated the p53 stabilization and anticancer effect through HAUSP inhibition by GRA16. My goal was to determine intermediate events between HAUSP inhibition and p53
stabilization. Research on GRA16-HAUSP-p53 could be crucial to evaluate the anticancer activity of GRA16.
In particular, p53 transcriptional activity has been known to be frequently disrupted in HCC by highly expressed HAUSP. Moreover, the expression of nuclear PTEN has been reported to decrease in the patients with advanced-stage HCC[5, 7, 17-20]. Therefore, given that HCC is one of the 10 most common cancer types worldwide, with no ideal treatment yet, HCC is an appropriate model for my study.
Accordingly, the development of a new HAUSP inhibitor has been underway, and it is anticipated that the monitoring of nuclear PTEN is crucial for cancer
therapy[17,18]. Based on these findings, I investigated whether the characteristics of GRA16, recognized as a new HAUSP inhibitor, could be used for anticancer
intervention, as, at present, the exact mechanism of how GRA16 induces anticancer effect remains unclear.
MATERIALS AND METHODS
1. Cell culture
HepG2 and Hep3B cells, a human liver cancer cell line, were purchased from the Korean Cell Line Bank (KCLB, Seoul, Korea) and cultured with
Dulbecco’s Modified Eagle’s Medium (DMEM) (1x, liquid (high glucose), WELGENE Inc., Gyeongsan, Korea) containing 10% fetal bovine serum (FBS, WELGENE Inc. Gyeongsan, Korea), and 1% antibiotic antimycotic solution
(WELGENE Inc, Gyeongsan, Korea) in 100-mm dishes (SPL Life Sciences, Pocheon, Korea) under 5% CO2 and 37℃ in CO2 incubator.
2. Plasmid construction for GRA16-stable cell line
The Toxoplasma gondii derived dense granule protein 16 (GRA16) was amplified by polymerase chain reaction (PCR) with a pair of specific primers (forward primer: 5'- CGG AAT TCC GAT GTA TCG AAA CCA CTC A-3’ and reverse primer: 5'- CCG TCG ACT CAC ATC TGA TCA TTT TTC C-3‘) designed according to the reference sequence from ToxoDB database. (Gene ID: ToxoDB, TGGT1_208830). The EcoR I and Sal I restriction sites were introduced in the primers (underlined). PCR reactions were performed using the following
amplification conditions: 95℃ for 5 min, followed by 35 cycles consisting of 95℃
for 30 s, 58℃ for 40 s, 72℃ for 1 min 30 s, following by a 3 min extension at 72℃. The products (1518 bp) were inserted into pBABE-HA vectors (Addgene,
Cambridge, MA, USA) and sequenced by the Cosmo corporation (Cosmogenetech, ltd., seoul, Korea). Retrovirus vectors lack viral structural genes and require packaging cells to generate viral articles. Conventionally, Platinum-A packaging cells (Cell Biolabs, Inc., San Diego, CA) used to establish stable producers of recombinant retroviruses. Platinum-A cells were transfected with pBABE HA II–GRA16 (GRA16‐inserted vector, pBABE‐GRA16) or pBABE HA II-Vector (empty vector, pBABE‐empty) using the Lipofectamine 3000 transfection kit (Life
Technologies, NY, USA) and Opti-MEM (Life Technologies, Gaithersburg, MD) were added following the manufacturer’s protocol. HepG2 and Hep3B cells were
infected with the recombinant retroviruses for 48 hours and then selected with puromycin (2 mg/ml)-resistant stable cell lines, pBABE-GRA16 or pBABE-empty vector stable cell lines.
3. Co-Immunoprecipitation for binding between GRA16 and HAUSP
For the co-immunoprecipitation (co-IP) assay, I extracted total proteins in 5 × 10⁶ HepG2 or Hep3B cells by incubating for 15 min at room temperature (RT) using M-PER mammalian protein extraction reagent (Pierce Biotechnology, Inc., Rockford, IL, USA). Before co-IP, 40 μL of the packed volume protein A/G-plus agarose beads (Santa Cruz Biotechnology, CA, USA) was previously incubated with 5 mg HA-tag Ab (Elabscience, Wuhan, China) with PBS to be 600 μL for 16 hours at 4℃. After washing three times with PBS, protein A/G-plus agarose beads previously reacted with HA-tag Ab were added in 0.5 mg of each extracted protein (HepG2 or Hep3B) and incubated for 4 hours at 4℃. Next, the
mixture was washed five times in 100 μL of PBS-T buffer (0.05% Tween 20 in PBS) and boiled with 2 × sample buffer (120 mM Tris, 20% glycerol, 4% SDS, 28.8 mM 2-mercaptoethanol, and 0.01% bromophenol blue) at 95℃ for 5 min. After centrifugation, I used the supernatant of each sample for the co-IP assay using western blotting with the HAUSP Ab (Cell Signaling Technology, Danvers, MA, USA).
4. Cell proliferation
I seeded 5 × 10³ cells on a 96-well plate and incubated for 2, 4, and 6 days to investigate the cytotoxicity of cells that divided into experimental groups (control, vector, GRA16) in HepG2 and Hep3B cells. The viability of cells at each incubation time was assessed using the Cell Counting Kit (CCK-8; Dojindo, Kumamoto, Japan) according to the manufacture’s instructions. 1 hour before the end of experiments, I added 10 μL of the CCK-8 solution to each well and incubated the cells for 1 hour at 37℃. The results were measured by the optical density at 451 nm using a microplate reader (Thermo Fisher Scientific, Waltham, MA, USA). For the cell proliferation analysis, HepG2 and Hep3B cells were seeded into 24-well plates at 3 × 10⁴ cells/well and cultured for 6 days. I monitored the degree of cell proliferation by the Trypan blue exclusion test on 2, 4 and 6 days after cell seeding. Then, viable cells were counted using a hemocytometer on completely detached cells using the Trypsin–EDTA solution. All experiments were performed in triplicate and results were obtained through three independent experiments for each study.
5. Gene expression of GRA16 for the established stable cell lines, HepG2-GRA16 and Hep3B-GRA16
I extracted the total RNA using the HiGene Total RNA Prep Kit (BIOFACT, Daejeon, Korea) and reverse-transcribed it to cDNA using a Reverse-Transcription Master Premix Kit with oligo d(T)15 primer (ELPIS Biotech, Daejeon, Korea). Then, cDNA samples were subjected to the PCR analysis to validate the gene expression of GRA16 in the stable cell lines. The PCR condition was as follows: 5 μL of primers (2 pmol/mL), 2 μL of cDNA sample, and 8 μL of HPLC-graded water, and 15 μL of 2× PCR premix (Solgent, Daejeon, Korea) were mixed and target genes were amplified in a SureCycler 8800 thermal cycler (Agilent Technologies, Santa Clara, CA). In addition, designs of primers were carried out by referring the sequence from the ToxoDB database (Gene ID: ToxoDB, TGGT1_208830) using the Geneious Pro R8 program (Biomatters Ltd., Auckland, New Zealand); the primer sequences were as follows: pBABE vector: 5'-TAG CTC TTG ATC CGG CAA AC-3’ (forward) and 5'-AAG TTG CAG GAC CAC TTC TG-3’(reverse); GRA16:
5'-ATG TAT CGA AAC CAC TCA GGG’(forward) and 5'-TCA CAT CTG ATC ATT TTT CCG C-3’(reverse). I performed PCR reactions as follows: 95℃ for 5 min, followed by 35 cycles comprising 95℃ for 5 min, 58℃ for 40 s, and 72℃ for 1 min 30 s, finally followed by an extension at 72℃ for 3 min. Finally, I analyzed PCR products by 1% agarose gel electrophoresis with the Stay Safe Nucleic Acid Gel Stain (RBC, Banqiao City, Taiwan).
6. Real-time PCR
Amplifications to target genes were performed using the CFX96 Real-Time PCR Detection System (Bio-Rad Laboratories, Hercules, CA). The real-time PCR was performed using SYBR Green I detection chemistry (Bio-Rad Laboratories); the real-time PCR condition was as follows: 15 min at 95℃, followed by 40 cycles comprising 20 s at 95℃, and 20 s at 60℃, and 30 s at 72℃. After amplification, I performed the melting curve analysis from 65℃ to 95℃, with increments of 0.5℃
per 5 s. In addition, primer sequences were as follows: Foxo3a: 5'-TGG ATG CGT GGA CGG ACT TC-3’(forward) and 5'-CGT GCA CGG CTT GCT TAC TG-3’
(reverse); p21: 5'-TCC TCA TCC CGT GTT CTC CT-3’(forward) and 5'-CAC CCT GCC CAA CCT TAG AG-3’(reverse); BAX: 5'-CTT TTG CTT CAG GGT TTC ATC CAG G-3’(forward) and 5'-ATC CTC TGC AGC TCC ATG TTA CTG-3’(reverse);
Survivin: 5'-AGT CCC TGG CTC CTC TAC TG-3’(forward) and 5'-TGA AGG TTG GGC TGA CAG AC-3’(reverse); Bcl-2: 5'-ACT GAG GAG CTT TGT TTC AAC CAA G-3’(forward) and 5'-GCC ACG TAA AGC AAC TCT CTA AAG G-3’
(reverse); MMP2: 5'-AGC ATG TCC CTA CCG AGT CT-3’(forward) and 5'-AAA CAG ATG GCA AAC ACG GC-3’(reverse); PTK2: 5'-TGA TGC ATG GTG TGA AGC CT-3’(forward) and 5'-CCA GGA TTG TGC TGA GCT GA-3’(reverse);
PTEN: 5'-CCA GTC AGA GGC GCT ATG TG-3’(forward) and 5'-TCG TGT GGG TCC TGA ATT GG-3’(reverse); MDM2: 5'-AGG AAT CAT CGG ACT CAG GTA CAT C-3’(forward) and 5'-CAG ATT TGT GGC GTT TTC TTT GTC G-3’
(reverse); GAPDH: 5'-GGT GAA GGT CGG AGT CAA CGG A-3’(forward) and 5'-GAG GGA TCT CGC TCC TGG AAG A-3’(reverse). The data analysis was performed using the bio-rad CFX manager software ver 3.1 (Bio-Rad
Laboratories). Then, I recorded Ct values of the house keeping gene, GAPDH, for all cDNA samples to assess the fold change of the target gene expression compared with control and, then, calculated for the fold change of the gene expression for vector (transfected by empty vector) or GRA16 (stable cells with GRA16) compared with control in each target gene.
7. Western blotting
I cultured the cells in a 6-well plate with the complete DMEM medium for 6 days, followed by harvesting for the preparation of the total protein. After washing with PBS, total proteins of cells were extracted using the M-PER Mammalian Protein Extraction Kit (Pierce Biotechnology, Inc.) according to the manufacturer’s protocol. After centrifugation, the concentration of the total protein in the supernatant was evaluated using a NanoDrop spectrophotometer (NanoDrop Technologies, Oxfordshire, UK). Then, the cell lysate (50 mg) in each sample was mixed with 2 × Sample Buffer, boiled at 95℃ for 5 min, and proteins were separated using sodium dodecyl sulfate (SDS)–10% polyacrylamide gel electrophoresis (PAGE) at 100 V for 110 min, followed by transferring to an Immun-Blot® PVDF membrane (Bio-Rad Laboratories) using the Mini Trans-Blot Electrophoretic Transfer Cell (Bio-Rad Laboratories) at 80 V for 100 min. Next, I incubated the membranes with 5% skimmed milk for 1 hour at RT and washed three times with TBS-T for 10 min, followed by incubation with anti-p53 Ab (Santa Cruz Biotechnology), anti-PTEN Ab (Santa Cruz Biotechnology), anti-AKT Ab (Enzo Life Sciences, Farmingdale, NY), anti-phospho-AKT (Ser473) Ab (Enzo Life Sciences), and anti-β-actin Ab (Santa Cruz Biotechnology) for 16 hours at 4℃.
After washing three times with TBS-T for 10 min, I incubated the membrane with anti-rabbit IgG- or anti-mouse IgG-peroxidase conjugate as a secondary Ab (Santa Cruz Biotechnology) for 1 hour at RT. Then, to detect the expression of the PTEN protein in the nucleus and cytoplasm of HepG2 and Hep3B cells, I harvested the cultured cells and isolated nuclear and cytoplasmic extracts using NE-PER nuclear and cytoplasmic extraction reagents (Pierce Biotechnology, Inc.) according to the manufacturer’s instructions. In addition, 25 mg of protein was separated of each fraction by 10% SDS–PAGE, followed by western blotting with an anti-PTEN Ab (Santa Cruz Biotechnology), anti-lamin B Ab (M-20; Santa Cruz Biotechnology), and anti-β-actin Ab (Santa Cruz Biotechnology). Signals were detected by exposing the membrane to the enhanced chemiluminescence (ECL) Pierce kit (Pierce Biotechnology, Inc.) using the Fuji LAS 1000 Lumino Image Analyzer (Fujifilm Corporation, Tokyo, Japan) and evaluated using an image calculator (ImageJ program).
8. Immunofluorescence staining
I obtained immunofluorescence images of cells after immunostaining with HA-Tag Ab (Elabscience) and anti-PTEN Ab (Santa Cruz Biotechnology) to investigate the expression of GRA16 in GRA16-stable-HepG2 and –Hep3B cells and the nuclear localization of PTEN. In this experiment, I seeded cells into a 96-well plate and incubated for 24 hours at 37℃. After washing with PBS, cells were fixed with 4% paraformaldehyde for 10 min and permeabilized by 0.1% Triton X-100 in PBS for 5 min. Then, after washing PBS, cells were incubated with PBS-T containing 1% BSA and 22.52 mg/mL glycine for 30 min, followed by
staining with anti-HA Tag Ab or anti-PTEN Ab for 1 hour. After washing, cells were incubated with secondary anti-mouse IgG Ab (Alexa 546) (Thermo Fisher Scientific, Waltham, MA) in PBS-T containing 1% BSA for 1 hour. After washing with PBS-T, I incubated cells with 300 nM of DAPI solution (Life Technologies, Carlsbad, CA, USA) for 5 min. After washing, I observed immunostained cells using fluorescent microscopy (Leica DMI6000 B).
9. Cell cycle analysis
For cell cycle analysis, HepG2 and Hep3B cells with and without GRA16 were seeded at 5 × 10⁵ cells/well in a 6-well plate for 6 days. Then, the cultured cells were harvested by the Trypsin–EDTA solution and centrifuged at 1500 rpm for 5 min. After removing supernatants, the cells were washed with cold PBS and, then, fixed in 1 mL of ice-cold 70% ethanol and stored for 2 hours at -20℃.
After washing, cells were resuspended in 200 μL of the PI–RNAase mixture solution containing 3.8 mM of sodium citrate, 50 μg/mL of PI (Sigma, St Louis, MO, USA) and 100 mg /mL of RNAase (Sigma) for the final concentration, followed by incubation for 15 min at 4℃ in the dark. I analyzed results by flow cytometry using a FACSCalibur (Becton Dickinson, San Jose, CA). Furthermore, data were acquired by the linear amplification of FL2 and analyzed for the proportions of cells in G0–G1,S-phase, and G2–M phases of the cell cycle using the CellQuest software (Becton Dickinson).
10. Cell apoptosis assays using the flow cytometry analysis
I cultured HepG2 and Hep3B cells by 5 × 10⁵ cells/well in 6-well plates for 6 days. After washing with PBS, I harvested cells by the Trypsin–EDTA treatment and obtained cell pellets by centrifugation at 1500 rpm for 5 min. After washing, the cell pellets were resuspended in 500 μL Annexin V binding buffer, followed by staining with both 5 μL of Annexin V–APC (BioLegend, San Diego, CA) and 2 μL of PI (1 mg/mL in distilled water; Sigma). After a 15 min incubation, I analyzed apoptotic cells by flow cytometry using the FACSCalibur (Becton Dickinson).
11. Wound healing assay
For the wound healing assay, I seeded HepG2 and Hep3B cells with and without GRA16 at 5 × 10⁵ cells/well in a 24-well plate and incubated for 24 hours in the CO2 incubator. At approximately 90% confluency, I scratched the inner bottom of the well by drawing a line with a 200 μL Eppendorf yellow tip and confirmed the movement of cells into the scratched space at 0, 24 and 48 hours by microscopic images using a digital camera (Leica DFC 280; Leica Microsystems, Bensheim, Germany) and a microscope (BX-51; Olympus Corporation) with the AF6000 Leica Las-X software (Leica Microsystems). Based on the wound width, data were evaluated by the migration distance using the ImageJ program.
12. Transwell migration/invasion assay
I assessed the migration and invasion ability of cells using the Matrigel-coated Transwell cell culture chambers (8 μm pore size; Millipore, Billerica, MA, USA). Briefly, I added 700 μL of the complete DMEM medium to the lower chamber in a 24-well plate. Then, cells to be placed on the top were resuspended in the serum-free DMEM medium and, then, 200 μL of the resuspended cells solution (1 × 10⁵ cells) was seeded onto the upper chamber of each Transwell. After 24 hours incubation, I fixed the cells with 4% formaldehyde for 10 min at RT and permeabilized by 100% methanol for 2 min. After washing with PBS, cells were stained with 10% Giemsa staining solution for 15 min at RT.
Finally, after noninvasive cells were scraped off with a cotton swab, I counted invasive cells in five randomly selected areas per well (magnification,×200). Data were obtained in triplicate.
13. Cancer cell xenograft and tumor production in GRA16 stable cell lines
I purchased 5-week-old BALB/c nude mice from Orient Bio Inc.
(Seongnam, Korea) and housed at RT with a 12 hours light–dark cycle in a specific pathogen-free barrier zone of Seoul National University College of Medicine animal facilities. After acclimatizing for 1 week before the experiment, mice were categorized as experimental groups by weight constantly. To produce the tumor mass, HepG2 and Hep3B cells (3 × 10⁶ cells/100 mL of PBS) were mixed with 100 mL of Matrigel Basement Membrane Matrix, Phenol-Red free (BD Biosciences), and
injected subcutaneously into the right side of the waist of each mouse. I measured tumor sizes once every 3 days after visible tumor formation in each group of HepG2 (five mice) and in Hep3B (five mice) during experimental period and calculated using the formula: V = ab2/2 (where a and b are tumor length and width, respectively). Mice were sacrificed by cervical dislocation after anesthetizing with diethyl ether at the end of the experiments, and weights of tumor masses were measured additionally using an electronic plate scale (Cas Inc., Yangju-si, Korea).
RESULTS
1. Establishment of GRA16-expressing stable cell line and comparison of cell proliferation and total cell number between HepG2 and Hep3B
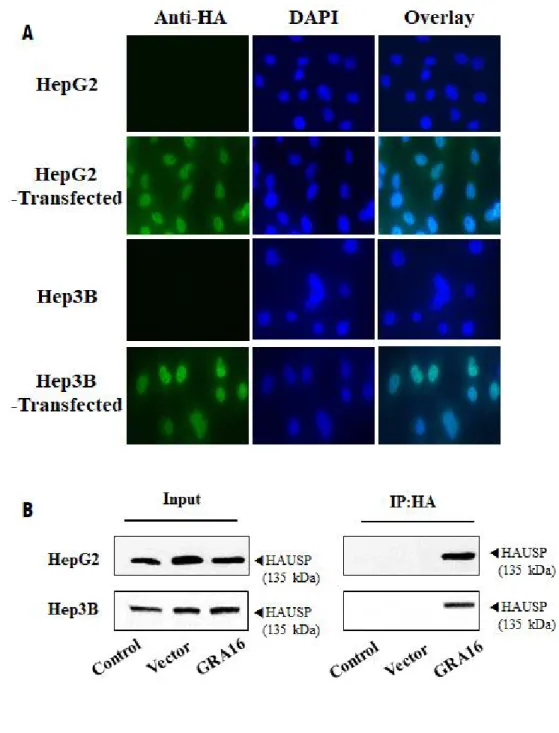
To determine the role of GRA16 protein as a HAUSP inhibitor in cancer cells, I established a stable cell line expressing GRA16 protein for HepG2 and Hep3B as human HCC cells of p53-wild and p53-null type, respectively (Figure 1).
All experimental groups were divided into the control group (no transfection), vector group (transfected with pBABE vector), and GRA16 group (transfected with pBABE-GRA16 vector). Figure 1A describes establishing a stable cell line carrying the Toxoplasma GRA16 gene using immunostaining. Figure 1B shows the result of the co-immunoprecipitation (co-IP) analysis between GRA16 and HAUSP. As shown in Figure 1A and 1B, GRA16 genes were stably expressed in transfected HepG2 and Hep3B cells. Furthermore, the results of co-IP experiment also showed that GRA16-HAUSP complex is present in GRA16-stable cell lines. This evidence confirmed that GRA16 is expressed in stable cell lines and binds intracellularly with HAUSP. In order to determine the role of GRA16 function, I evaluated the changes in the cell proliferation and total cell counts for 6 days of the in vitro culture. The cell proliferation and total cell counts in the control and vector groups did not differ between HepG2 and Hep3B. However, remarkably, the cell count of GRA16-stable-HepG2 cells significantly decreased with a significant decrease in cell proliferation as compared with that in the control and vector
groups (p < 0.05; Figure 1C‐a and C‐b). In contrast, the cell proliferation and total cell counts of GRA16-stable-Hep3B cells did not differ between the control and vector groups (Figure 1Da-b).
Figure 1. (A) The figure shows the expression of HA-tagged GRA16 proteins in the immunofluorescence assay using anti-HA Ab. (B) The figure shows GRA16 protein bound to HAUSP within GRA16-stable cells (Co-IP analysis). (C and D) The cell proliferation and total cell number were measured by using the Cell Counting Kit (CCK) and the Trypan blue exclusion test on 2, 4 and 6 days after incubation. The optical density (OD) value for the cell proliferation assay was measured at 451 nm, and total living cells were counted microscopically. The experimental groups are divided into the control, vector and GRA16 groups, and data are presented as the mean ± SD of three independent experiments, each performed in triplicate. *The significant difference in the vector and GRA16 groups compared with control (p < 0.05). †The significant difference between vector and GRA16 stable cells (p < 0.05).
2. Protein expressions of PTEN and p53, and AKT phosphorylation in GRA16-stable-HepG2 and –Hep3B cells
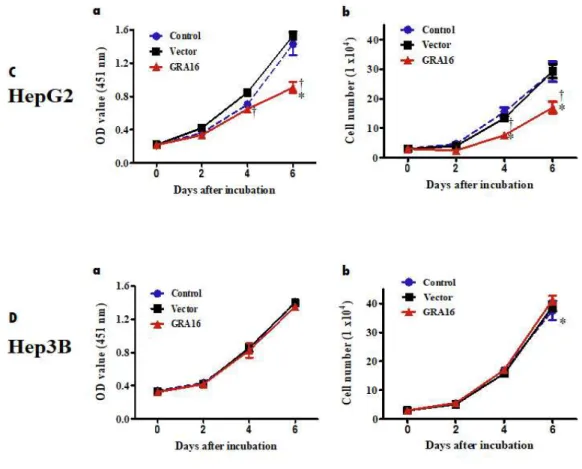
I performed Western blotting using the specific antibodies to determine the effect of GRA16 on the expressions of PTEN, p53, and AKT phosphorylation (Figure 2). As anticipated, the protein expression of p53 was observed in HepG2 p53-wild cells, but not in Hep3B p53-null cells (Figure 2C-b). It also up-regulated PTEN expression, but down-regulated AKT phosphorylation levels in
GRA16-stable-HepG2 cells as compared to the control and vector groups (p < 0.05;
Figure 2A-a and A-b). However, PTEN expression and the p-AKT/AKT ratio in Hep3B cells were not different between the control and vector groups (Figure 2B-a and B-b). I examined the mRNA expression levels of PTEN in HepG2 and Hep3B, and the mRNA level was found to decrease in Hep3B as compared to HepG2 (Figure 2C-a). These findings suggested that regulation of PTEN/AKT activity is closely related to endogenous p53 expression. Thus, I expected that expression of GRA16 would plays a role as a HAUSP inhibitor up-regulation of p53 by increasing PTEN expression in p53-wild-type HepG2. In addition, it was
supported by a significant increased intensity of the p53 protein normalized by β-actin in GRA16-stable-HepG2 cells in comparison to the control and vector groups (p < 0.05; Figure 2C-b).
However, Hep3B was absent in p53 protein, and no significant differences in PTEN/AKT activity were observed (Figure 2B-b and C-b). Thus, these findings suggested that, in the presence of p53, GRA16 as a HAUSP inhibitor up-regulates PTEN expression and down-regulates AKT activity, subsequently increasing p53 expression. In the absence of p53, the role of GRA16 is limited to regulating
PTEN/AKT activity and p53 stabilization.
Figure 2. (A-a and B-a) The figures show the western blotting results of PTEN, p53, and phosphorylation of AKT in HepG2 and Hep3B cells. (A-b and B-b) The figures show the relative band intensity of PTEN/β-actin and p-AKT/AKT in HepG2 and Hep3B. *The statistical difference for the relative band intensity of vector or GRA16 group compared with control (p < 0.05). (C-a) The figure shows endogenously expressed PTEN levels (mRNA and protein) in the control group (HepG2 or Hep3B). *The statistical difference in the PTEN level between HepG2
and Hep3B (p < 0.05). (C-b) The figure shows the mRNA level of p53 normalized by β-actin in HepG2 and Hep3B. *The significant difference between the control and GRA16 groups (p < 0.05). †The significant difference between the vector and GRA16 groups (p < 0.05).
3. An increase in the nuclear localization of PTEN in GRA16-stable–HepG2 cells
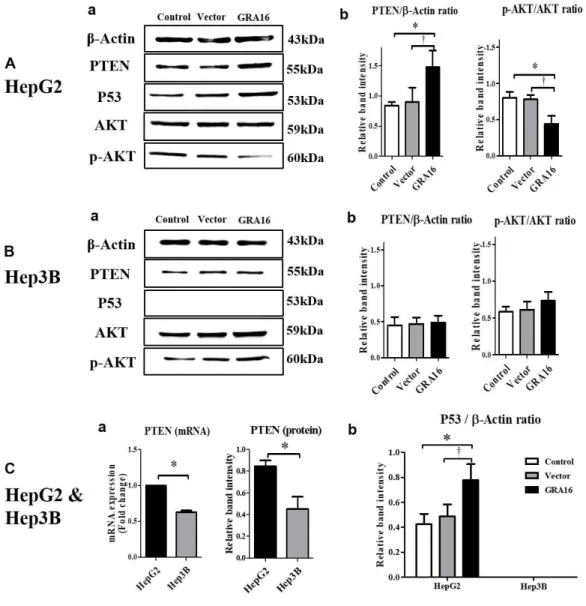
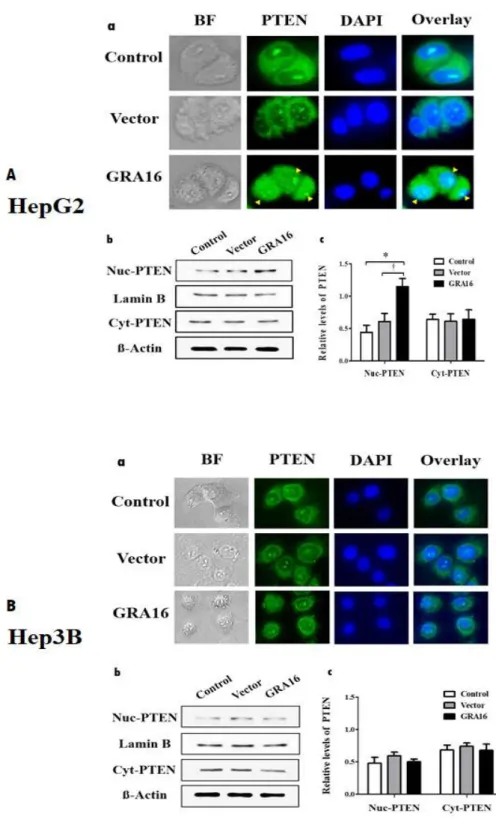
The results demonstrate that the levels of PTEN and p53 expressions were distinct in GRA16-stable-HepG2 cells. To investigate the role of up-regulation of PTEN expression of GRA16 protein, I used the immunofluorescence assay stained the PTEN protein in the nucleus and cytoplasm of GRA16-stable-HepG2 and –Hep3B. Then, I confirmed the increase in nuclear localization of PTEN by GRA16
and investigated PTEN protein concentration between nuclear PTEN and cytosol PTEN using Western blotting (Figure 3). The fluorescence intensity in the nucleus region of HepG2 cells was higher in the GRA16 group than in the control and vector groups (Figure 3A-a). However, the fluorescence intensity in the nucleus of Hep3B cells was equivalent to the fluorescence intensity in the control and vector groups (Figure 3B-a). I also investigated the expression levels of PTEN between nucleus and cytoplasm using Western blotting to demonstrate an increase in nuclear PTEN in GRA16-stable cells. Lamin B was used as internal control in the nucleus, while β-actin was used as internal control in the cytoplasm (Figure 3A-b and A-c and B-b and B-c). In GRA16-stable-HepG2 cells, the levels of nuclear PTEN increased significantly more than in the control and vector groups. In contrast, the levels of cytoplasmic PTEN did not change (p < 0.05; Figure 3A-c).
In addition, in Hep3B cells, the levels of nuclear and cytoplasmic PTEN were not affected by GRA16 (Figure 3B-c). These findings suggest that GRA16 as a HASUP inhibitor regulates PTEN nuclear import in the presence of endogenous p53.
Figure 3. (A-a) and (B-a) The figures show the fluorescent intensity with which the PTEN protein expressed within cells was immunostained. BF; bright field; PTEN, GFP-positive green fluorescence using anti-PTEN Ab; DAPI, nuclear
DNA stained with DAPI; Overlay, the merged fluorescent image (overlaid between GFP and DAPI fluorescence). (A-b) and (B-b) The figures show the western blot images for nuclear PTEN (Nuc-PTEN) and cytoplasmic PTEN (Cyt-PTEN). Protein bands of Lamin B and β-actin show the expression of housekeeping proteins in the nucleus and cytoplasm, respectively. (A-c) and (B-c) The figures show the relative levels of PTEN, which are normalized by Lamin B and β-actin, respectively, in the nucleus and cytoplasm in HepG2 and Hep3B. *The significant difference between the control and GRA16 groups (p < 0.05). †The significant difference between the vector and GRA16 groups (p < 0.05).
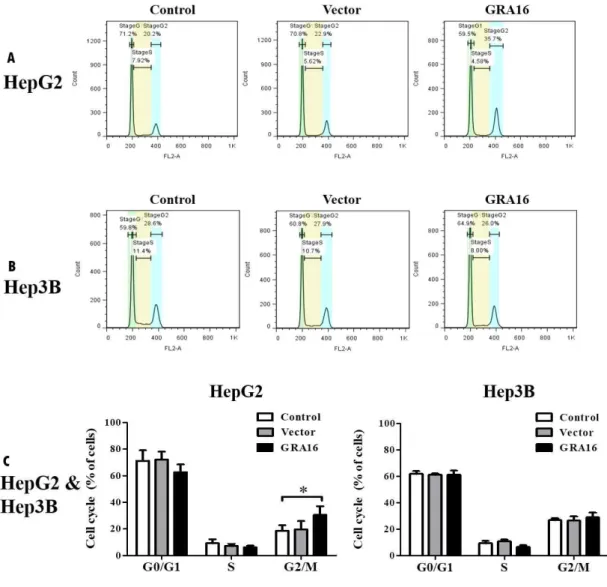
4. Regulation of the cell cycle by GRA16 in GRA16-stable- HepG2
The results demonstrate that GRA16-stable-HepG2 cells increased the levels of nuclear PTEN and decreased in total cell numbers and AKT phosphorylation, implying control of cell cycle (Figure 4). Therefore, I used the FACS analysis to quantify the percentage of cells at each stage of the cell cycle.
Figure 4A and B show images of cell cycle analysis results by the FACS analysis, while Figure 4C shows the percentage of cells in each stage of the cell cycle. In the present study, GRA16-stable-HepG2 cells exhibited a significant retention in the G2–M phase compared to the control cells (30.57% ± 5.28% and 18.53% ± 3.47%, respectively; p < 0.05; Figure 4A and C). However,
GRA16-stable-Hep3B cells did not show any difference from other groups (control and vector) in percentage of cells in each cell cycle (Figure 4B and C). Table 1 provides further detail about these findings.
Figure 4. (A) and (B) figures for the pattern of cell cycle analyzed by the FACS using the PI staining. (C) The figures show the difference in relative fractions of the cell cycle (%) in HepG2 and Hep3B. *The significant difference between the control and GRA16 groups in each fraction (p < 0.05).
5. Differences in the induction of apoptosis between GRA16-stable-HepG2 and –Hep3B cells
The results revealed the differences in levels of nuclear PTEN, p53, and AKT phosphorylation between GRA16-stable-HepG2 and -Hep3B cells. Since these factors are associated with p53-dependent cell apoptosis, I evaluated the effect of GRA16 on the induction of cell apoptosis between GRA16-stable-HepG2 and -Hep3B cells using the FACS method with double staining of Annexin V and propidium iodide (PI; Figure 5). The results showed the total number of apoptotic cells in each group. In the GRA16-stable-HepG2 cells, but not in
Hep3B-stable-GRA16, the total number of apoptotic cells significantly increased (p
< 0.05; Figure 5A-b and B-b). This suggests that GRA16 plays an important role in the interaction of PTEN with p53 during HASUP inhibition of p53 stabilization, and as a precondition for that role, the presence of p53 is necessary for the apoptosis of cancer cells by GRA16.
Figure 5. (A-a) and (B-a) figures show the percentage of apoptotic cells analyzed by the Annexin V and PI staining. (A-b and B-b) Apoptotic cells (%)
were analyzed by FACS and compared among the control, vector, and GRA16 groups. The result showed that an increase in apoptotic cells under the presence of GRA16 was observed in HepG2 (27.4% ± 2.74%) but not Hep3B (5.9% ± 0.28%) in comparison to the control and vector groups (11.25% ± 1.85% and 9.46%
± 1.21% in HepG2, and 6.70% ± 0.63% and 7.03 ± 0.22% in Hep3B, respectively;
Figure 5A-b and B-b) *The significant difference between the control and GRA16 groups (p < 0.05). (C) As anticipated, the mRNA levels of apoptotic factors (Foxo3a, BAX, and p21) in GRA16-stable-HepG2 cells were significantly increased by 1.3 ± 0.08- to 1.6 ± 0.1-fold in comparison to both control (“1-fold”) and vector groups (0.8 ± 0.14- to 1.0 ± 0.09-fold) (p < 0.05; Figure 5A). In contrast, the mRNA levels of antiapoptotic factors (Bcl-2 and Survivin) were decreased by 0.4 ± 0.08- and 0.5 ± 0.07-fold, respectively, in GRA16-stable-HepG2 cells (p <
0.05; Figure 5A). However, the increase in apoptotic factors was not observed in Hep3B cells (0.6 ± 0.1- to 1.1 ± 0.13-fold; Figure 5B). Meanwhile, antiapoptotic factors exhibited no change in GRA16-stable-Hep3B cells as well as the control and vector groups (Figure 5B). These findings implied that the role of GRA16 as a HASUP inhibitor was exhibited in p53-wild-type cells.
6. Effects of GRA16 on the mobility and invasive activity of GRA16-stable-HepG2 and –Hep3B cancer cells
The increased apoptosis of cancer cells might result in the anticancer effect, and the expressions of molecules, such as migration factors, could be altered. Therefore, I aimed to investigate the effects of GRA16 on the cancer cell mobility and invasive activity. To this end, two cell migration assays namely, the wound closure assay and Transwell cell migration assay, were used in HepG2 and Hep3B. In addition, I evaluated the mRNA levels of two important cell migration factors, MMP2 and PTK2, which are involved in the degradation of extracellular matrix (ECM), associated with cancer cell invasion and metastasis (Figure 6).
In HepG2 cells, the presence of GRA16 significantly reduced cell mobility at 24 and 48 hours after incubation as compared to the control and vector groups (p < 0.05; Figure 6A-b). In addition, the decreased cell mobility suggests that the wounded area was not reduced (Figure 6A-a). However, this pattern did not hold in Hep3B cells, indicating no effect of GRA16 (Figure 6B-b); this result emphasized repeatedly the significance of the endogenous p53 for the anticancer activity of GRA16. Similarly, the mRNA levels of MMP-2 and PTK2 significantly reduced in GRA16-stable-HepG2 cells, but not in GRA16-stable-Hep3B cells (p < 0.05; Figure 6A-c and B-c). Moreover, the Transwell invasion assay, which exhibited similar results, was consistent with the wound healing assay (Figure 6C-a and C-b). These results convincingly demonstrate that the effect of GRA16 as a HAUSP inhibitor could induce the anticancer effect in p53-wild HCC cells.
Figure 6. (A-a) In HepG2 cells, the presence of GRA16 significantly reduced cell mobility at 24 and 48 hours after incubation in comparison to the control and vector groups (p < 0.05;). In addition, the decreased cell mobility suggests that the wounded area was not reduced. (A-b) Briefly, wounded areas (%) in the control, vector, and GRA16-stable-HepG2 cells appeared at 61.8 ± 4.31, 59.4 ± 4.0, and 84.0 ± 2.6, respectively, at 24 hours after scratching, and at 24.9
± 4.54, 17.0 ± 5.25, and 53.1 ± 4.48, respectively, at 48 hours after scratching (p < 0.05). (B) In Hep3B, the wounded area (%) after scratching was covered in the same degree a, indicating no effect of GRA16; this result emphasized repeatedly the significance of the endogenous p53 for the anticancer activity of GRA16. (A-c and B-c) the mRNA levels of MMP-2 and PTK2 were significantly reduced in GRA16-stable-HepG2 cells in comparison to GRA16-stable-Hep3B cells (0.50 ± 0.10- and 0.5 ± 0.04-fold, respectively, in HepG2 cells vs. 0.95 ± 0.20- and 0.96 ± 0.19-fold, respectively in Hep3B cells) when the mRNA level in control was “1-fold” (p < 0.05;). (C) Moreover, the Transwell invasion assay exhibited similar results as follows. The number of migrated cells in the experiment using Matrigel-coated Transwell cell culture chambers was quantified by cell counting at 24 hours after incubation and calculated by the relative migration capability (%) compared with the control (100%). Of note, the result was also consistent with that of the wound healing assay. (C-b) Furthermore, the relative migration capability (%) of GRA16-stable-HepG2 cells was decreased by 46.4% ± 5.64% in comparison to the control (100.0%) and vector cells (77.3% ± 7.94%). However, the effect of GRA16 was not demonstrated in Hep3B cells . Based on these results, I convinced that the effect of GRA16 as a HAUSP inhibitor could induce the anticancer effect in p53-wild HCC cells.
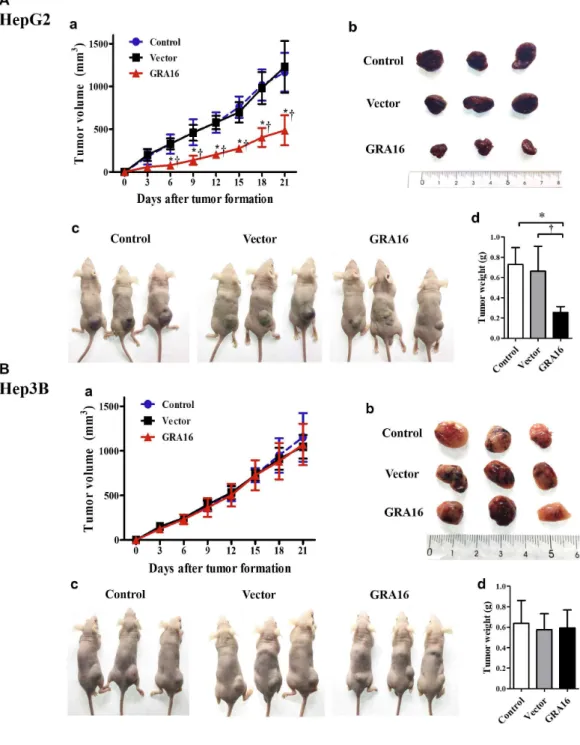
7. Tumor reduction induced by GRA16 in xenograft mice
I investigated the in vivo tumor reduction effect in GRA16-stable-HepG2 and -Hep3B cells using a xenograft model to demonstrate the anticancer activity of GRA16. The measurement of tumor sizes in nude mice xenograft of HepG2 and Hep3B cells (control, vector and GRA16 groups) was performed after a visible tumor formation (Figure 7). The results showed that the tumor size and mass increased in the control and vector groups (Figure 7A-a, A-d and 7B-a, B-d).
However, in the GRA16-stable-HepG2, the tumor size and mass were significantly lower than the other groups (control and vector groups; p < 0.05; Figure 7A‐a and A‐b). Furthermore, the tumor weight in of GRA16-stable-HepG2 cells was also significantly lower than the other groups (p < 0.05; Figure 7A‐d). However, the tumor mass and weights of Hep3B cells continuously increased without difference (Figure 7B‐a and B-d). Taken together, these results provide strong support to the conclusion that GRA16 enhances anticancer effect in nude mice xenografts in the presence of p53.
Figure 7. (A-a and A-b) Nude mice xenograft with control- and vector-HepG2 cells exhibited a gradual increase in the tumor mass from 6 days after inoculations and measured the tumor mass for data after visible tumor formation. (B-a and B-b) Similarly, nude mice xenograft with control- and vector-Hep3B cells exhibited a gradual increase in the tumor mass after visible
tumor formation. (A-c) The tumor mass in nude mice xenograft with GRA-stable HepG2 cells was significantly lower than that in other two groups (control and vector; p < 0.05;). (A-d) The tumor weights in nude mice xenograft with GRA16-stable-HepG2 cells (0.26 ± 0.06 g) were significantly smaller than those in the other two groups (control, 0.80 ± 0.16 g, and vector, 0.70 ± 0.23 g). (B-a and B-d) The tumor mass and tumor weights in nude mice xenograft with GRA-stable Hep3B cells were not shown in the difference in comparison to other two groups (control and vector).
DISCUSSION
Previous research reported HAUSP inhibition as an anticancer drug target
[1]. The action of HAUSP is highly specific for substrates such as MDM2, p53, PTEN, and FOXO4[1, 3, 8]. Previous studies showed that overexpressed HAUSP plays a critical role in cancer, and its level is highly useful to anticipate the prognosis of cancer treatment[1-3]. The primary role of HAUSP is to prevent the MDM2 self-ubiquitination and promote the ubiquitination and proteasomal degradation of p53; furthermore, it results in the deubiquitination and nuclear exclusion of PTEN and eventually destabilizes p53[1-6]. In contrast, the HAUSP inhibition induces the MDM2 ubiquitination and nuclear localization of PTEN and stabilizes p53 through dynamic posttranslational modification of the deubiquitination and ubiquitination[1, 3]. In addition, HAUSP inhibitors can regulate the ultimate expression of oncogenes due to their roles in the hyper-ubiquitination and subsequent proteolysis of oncogenes[2]. This could be attributed to the fact that the endogenous increase in HAUSP has been reported in various tumors, such as myeloma, prostate cancer, neuroblastoma, gliomas, ovarian cancer, and colon tumor, and that small-molecule inhibitors against HASUP have been effective as the cancer therapeutics stabilizing tumor-suppressor p53[2, 3]. In some cases, the elevated level of MDM2 and nuclear exclusion of PTEN was reported in cancer progression; accordingly, changes in these target molecules are critical indicators to determine the efficacy after the anticancer treatment[2, 4-6, 18]. Accordingly, in the present study, I assessed the vital detailed mechanisms wherein GRA16 as an HAUSP inhibitor acts at the stage of auto-regulatory networks of HAUSP/MDM2/PTEN/p53 to induce anticancer
activity.
HCC is common malignant liver cancer that accounts for > 90% of all liver cancer cases and is the third leading cause of cancer-related mortality[7]. A high expression of HAUSP is reported to be frequent in HCC tissues, and a high HAUSP level correlates with a larger tumor size[7]. Therefore, it is clinically imperative to target HAUSP for HCC therapy, and the HCC suppression using an HAUSP inhibitor should be investigated[7]. Hence, if GRA16 has an anticancer effect, it is of high importance to be studied for developing a new candidate for HCC therapy. In the first study reporting a binding between GRA16 and HAUSP, GRA16 was reported to target the host cell nucleus and alter the gene expression, thereby increasing the p53 level in a HAUSP-dependent manner[9]; however, the target substrate for GRA16 action was not precisely determined. In the present study, I determined whether the anticancer effect could be induced by using the HAUSP-binding effect of GRA16 in HCC, and, moreover, which mechanisms underlie inducing the p53 stabilization after the HAUSP inhibition. In addition, given that some human cancer types, including HCC, exhibit the abnormal p53 gene or disrupted p53 gene activation pathways, the effect of GRA16 warrants evaluation in the conditions with and without the p53 gene[17]. Thus, in the present study, I developed genetically modified GRA16-stable cancer cells for p53-wild-type, HepG2, and p53-null-type, Hep3B, and established the binding between GRA16 and HAUSP within cells using the co-IP assay. In addition, I evaluated the mRNA expressions of target substrates, MDM2 and PTEN, of HAUSP;
of note, an increase in the mRNA level was observed not in MDM2, but in PTEN and for only GRA16-stable-HepG2. However, Hep3B cells did not exhibit any changes in the levels of MDM2 and PTEN within cells in which GRA16 was
expressed. Due to the existence of conflicting results for Hep3B cells, this finding could be construed as debatable. However, some limitations still exist. A previous study did not consider the detailed mechanism between the HAUSP inhibition and the reduced cell proliferation capacity[7] and observed an increase in the PTEN nuclear pool without further investigating the apoptosis mechanism[8]. Conversely, other studies reported that the tumor-suppressor PTEN directly interacted with p53 through the increase of endogenous p53 by the deubiquitination and acetylation of p53 in the AKT-independent manner in hereditary cancer[6, 21]. Those studies emphasized the importance of endogenous p53 for the anticancer effect by PTEN, because one of the transcriptional targets of p53 is also PTEN and there exists an auto-regulatory feedback between PTEN and p53[6, 21]. In HCC tumors, the downregulation of the nuclear PTEN is an essential step in hepatocarcinogenesis [5,
19-21]. Therefore, the strategy for the anticancer drug development needs to be differentiated by molecular mechanisms depending on the genetic basis of p53 and considered in the PTEN levels. As revealed by my results, the deleted p53-bearing Hep3B decreased in the PTEN level as compared with p53-wild HepG2. In addition, Hep3B was found to be completely unresponsive to the action of GRA16 for the cell proliferation, apoptosis-inducing molecules, PTEN expression, and AKT phosphorylation. In contrast, HepG2 responded remarkably to GRA16 as follows. In GRA16-expressing stable HepG2, apoptotic molecules, the expression and nuclear localization of PTEN, endogenous p53 expression, retention of the G2–M phase of the cell cycle, and apoptotic cells increased. These findings suggest that the mechanism of GRA16 inducing apoptosis of tumor cells is the p53 stabilization according to the increase of the nuclear localization of PTEN. PTEN induces apoptosis of tumors by not only the p53 stabilization by its nuclear localization,
but also by the antagonization to the AKT phosphorylation[22]. In the patients with cervical cancer, a high level of the p-AKT expression and the low PTEN level were observed and correlated with a low 5-year survival rate[22]. Therefore, the PTEN increased by cancer therapy is a crucial downregulator of the AKT by the AKT dephosphorylation, and inhibits the cell migration, causing the cell cycle arrest in tumor cells[19]. In addition, the activation of p53 can result in the downregulation of the cellular AKT level[23]. Consequently, a decrease in the AKT phosphorylation, which was demonstrated in the present study, appears to be strengthening the antitumor activity in the situation of the auto-regulatory feedback between nuclear PTEN and p53[23]. The major role of a HASUP inhibitor includes the cell cycle arrest in the G2–M phase and the activation of the apoptotic pathway in a MDM2/PTEN-dependent manner[8]. However, the effect of GRA16 for the induction of the cell cycle arrest and the apoptotic pathway was clearly demonstrated in a PTEN-dependent manner[8]. My results present a new possibility of the existence of the auto-regulatory feedback loop between PTEN and p53 in GRA16-stable-HepG2. In particular, since the crucial cancer therapy is based on either chemotherapy or radiotherapy, which induces p53-dependent apoptosis, the presence of wild-type p53 in tumor cells is the basis of an effective chemotherapy[17]. Accordingly, I emphasize the efficacy of GRA16 in the presence of wild p53, as well as the biology of a specific tumor type.
Furthermore, I also suggest that GRA16 might serve as a complement to increase the efficacy of other chemotherapeutic agents. In conclusion, my results clearly demonstrate the role of GRA16 as a PTEN regulator and underscore the importance of endogenous p53. GRA16 as a HAUSP inhibitor induces the anticancer effect in both in vitro and in vivo studies, and these results probably
reflect the possibility of GRA16 as a new supplementary anticancer therapeutic agent. Furthermore, this study newly proves that the major role of GRA16 is to inhibit the translocation of PTEN from the nucleus to the cytoplasm through the HAUSP inhibition, suggesting that GRA16 can be applied as an alternative to treatment of HCC.
REFERENCES
1. Davis MI, Simeonov A. Ubiquitin-specific proteases as druggable targets.
Drug Target Rev (2015) 2(3):60.
2. Tavana O, Gu W. Modulation of the p53/MDM2 interplay by HAUSP inhibitors. J Mol Cell Biol (2017) 9(1):45-52. doi: 10.1093/jmcb/mjw049
3. Wei R, Liu X, Yu W, Yang T, Cai W, Liu J, et al. Deubiquitinases in cancer. Oncotarget (2015) 6(15):12872. doi: 10.18632/oncotarget.3671
4. Song MS, Salmena L, Carracedo A, Egia A, Lo-Coco F, Teruya-Feldstein J, et al. The deubiquitinylation and localization of PTEN are regulated by a HAUSP–
PML network. Nature (2008) 455(7214):813. doi: 10.1038/nature07290
5. Trotman LC, Wang X, Alimonti A, Chen Z, Teruya-Feldstein J, Yang H, et al. Ubiquitination regulates PTEN nuclear import and tumor suppression. Cell (2007) 128(1):141-56. doi: 10.1016/j.cell.2006.11.040
6. Nakanishi A, Kitagishi Y, Ogura Y, Matsuda S. The tumor suppressor PTEN interacts with p53 in hereditary cancer. Int J Oncol (2014) 44(6):1813-9. doi:
10.3892/ijo.2014.2377
7. Wang X, Zhang Q, Wang Y, Zhuang H, Chen B. Clinical Significance of Ubiquitin Specific Protease 7 (USP7) in Predicting Prognosis of Hepatocellular Carcinoma and its Functional Mechanisms. Med Sci Monit (2018) 24:1742. doi:
10.12659/MSM.909368
8. Carrà G, Panuzzo C, Torti D, Parvis G, Crivellaro S, Familiari U, et al.
Therapeutic inhibition of USP7-PTEN network in chronic lymphocytic leukemia: a strategy to overcome TP53 mutated/deleted clones. Oncotarget (2017) 8(22):35508.
doi: 10.18632/oncotarget.16348
9. Bougdour A, Durandau E, Brenier-Pinchart M-P, Ortet P, Barakat M, Kieffer S, et al. Host cell subversion by Toxoplasma GRA16, an exported dense granule protein that targets the host cell nucleus and alters gene expression. Cell Host Microbe (2013) 13(4):489-500. doi: 10.1016/j.chom.2013.03.002
10. Shin E-H, Chun YS, Kim W-H, Kim J-L, Pyo K-H, Chai J-Y. Immune responses of mice intraduodenally infected with Toxoplasma gondii KI-1 tachyzoites. Korean J Parasitol (2011) 49(2):115. doi: 10.3347/kjp.2011.49.2.115
11. Hwang YS, Shin J-H, Yang J-P, Jung B-K, Lee SH, Shin E-H.
characteristics of infection immunity regulated by Toxoplasma gondii to Maintain chronic infection in the Brain. Front Immunol (2018) 9:158. doi:
10.3389/fimmu.2018.00158
12. Pyo K-H, Lee Y-W, Lim SM, Shin E-H. Immune adjuvant effect of a Toxoplasma gondii profilin-like protein in autologous whole-tumor-cell vaccination in mice. Oncotarget (2016) 7(45):74107-19. doi: 10.18632/oncotarget.12316
13. Jung B-K, Pyo K-H, Shin KY, Hwang YS, Lim H, Lee SJ, et al. Toxoplasma gondii infection in the brain inhibits neuronal degeneration and learning and memory impairments in a murine model of Alzheimer's disease. PLoS One (2012) 7(3):e33312. doi: 10.1371/journal.pone.0033312
14. Pyo K-H, Jung B-K, Chai J-Y, Shin E-H. Suppressed CD31 expression in sarcoma-180 tumors after injection with Toxoplasma gondii lysate antigen in BALB/c mice. Korean J Parasitol (2010) 48(2):171. doi: 10.3347/kjp.2010.48.2.171 15. Pyo K-H, Jung B-K, Xin C-F, Lee Y-W, Chai J-Y, Shin E-H. Prominent IL-12 production and tumor reduction in athymic nude mice after Toxoplasma gondii lysate antigen treatment. Korean J Parasitol (2014) 52(6):605. doi:
10.3347/kjp.2014.52.6.605
16. Bougdour A, Tardieux I, Hakimi MA. Toxoplasma exports dense granule proteins beyond the vacuole to the host cell nucleus and rewires the host genome expression. Cell Microbiol (2014) 16(3):334-43. doi: 10.1111/cmi.12255
17. Guan Y-S, La Z, Yang L, He Q, Li P. p53 gene in treatment of hepatic carcinoma: status quo. World J Gastroenterol (2007) 13(7):985. doi:
10.3748/wjg.v13.i7.985
18. Terai S, Matsuzaki Y, Masuhara M, Kondou S, Yasunaga M, Okita K. High MDM2 mRNA expression in hepatoblastoma cell-lines. Int Hepatol Comm (1995) 3(6):330-6. doi: 10.1016/0928-4346(95)00203-U
19. Khalid A, Hussain T, Manzoor S, Saalim M, Khaliq S. PTEN: A potential prognostic marker in virus-induced hepatocellular carcinoma. Tumour Biol (2017) 39(6):1010428317705754. doi: 10.1177/1010428317705754
20. Rahman MA, Kyriazanos ID, Ono T, Yamanoi A, Kohno H, Tsuchiya M, et al. Impact of PTEN expression on the outcome of hepatitis C virus‐positive cirrhotic hepatocellular carcinoma patients: Possible relationship with COX II and inducible nitric oxide synthase. Int J Cancer (2002) 100(2):152-7. doi:
0.1002/ijc.10458
21. Peyrou M, Bourgoin L, Foti M. PTEN in liver diseases and cancer. World J Gastroenterol (2010) 16(37):4627.
22. Lee M-S, Jeong M-H, Lee H-W, Han H-J, Ko A, Hewitt SM, et al.
PI3K/AKT activation induces PTEN ubiquitination and destabilization accelerating tumourigenesis. Nat Commun (2015) 6:7769. doi: 10.1038/ncomms8769
23. Oren M, Damalas A, Gottlieb T, Michael D, Taplick J, LEAL JF, et al.
Regulation of p53. Ann N Y Acad Sci (2002) 973(1):374-83. doi:
10.1111/j.1749-6632.2002.tb04669.x
국문초록
GRA16 단백질은 톡소포자충 분비단백질로써 기생충 공포막에 위치한 단백질 이다. 최근 연구에 따르면, GRA16은 P53과 MDM2의 탈유비퀴틴화를 통해 직접 조 절하는 효소인 HAUSP와 상호 작용한다고 알려졌다. 본 연구에서는 항암 치료에서 HAUSP와의 작용을 통한 GRA16의 항암 작용을 연구하고자 하였다. 간암 세포에서 포스파타제 및 텐신 상동체(PTEN)와 p53의 유전자의 변형이 흔하게 발견되기 때문 에, 간암세포인 중 야생형 p53 타입인 HepG2 세포주와 p53의 유전자가 소실된 Hep3B 세포주에서 레트로바이러스 시스템을 사용하여 상기 언급 된 GRA16 단백질 을 발현하는 세포를 확립하였고, 확립된 세포를 사용하여 PTEN과 p53 조절의 상세
한 메커니즘을 연구하였다. 본 연구에서 확립된 세포를 이용하여 생체 외(In vitro)
실험에서 세포증식, 세포주기, 세포사멸, 암세포의 전이 및 침습 관련 실험을 진행 하였으며, 야생형 p53 타입인 HepG2-GRA16 세포에서 PTEN의 핵 내 국소화 및 p53의 안정화를 통한 암세포의 성장억제를 확인할 수 있었다. 그러나 이러한 결과 는 p53이 소실된 Hep3B-GRA16 세포주에는 관찰되지 않았다. 또한, 탈유비퀴틴 효 소인 HAUSP와 GRA16의 작용은 일반적으로 알려진 HAUSP 억제를 통한 MDM2 메 커니즘보다 PTEN의 핵 국소화에 의한 p53의 안정화가 일어남을 확인하였다. 이러 한 유전자 변화를 통한 암 세포 억제 작용은 누드 마우스에서 암세포 이종이식을 통한 연구에서도 확인 할 수 있었다. HepG2-GRA16 세포주 에서는 GRA16을 발현 하지 않는 HepG2 세포에 비해 종양 크기가 감소함을 확인 할 수 있었으나 Hep3B-GRA16 세포주 에서는 GRA16이 발현하지 않는 Hep3B 세포와 차이를 보이 지 않았다. 이 연구의 중요한 발견은 HAUSP 억제제로써 GRA16이 PTEN의 핵 국소 화를 유도하고 p53 의존적 방식으로 항암효과를 유도함을 확인 한 것이다. 종합적 으로, GRA16은 p53 의존적 방식으로 간암세포에서의 치료를 새롭게 제시할 수 있
음을 강조한다.
--- 주요어 : 간암세포, 톡소포자충, 포스파타제 및 텐신 상동체(PTEN),
유비퀴틴 특이적 프로테아제 7(USP7/HAUSP), 암세포사멸
학 번 : 2017-23973